This 89-Year-Old Investor Wants More Growth! My 52% Answer.
Brett Owens, Chief Investment Strategist
Updated: July 15, 2026
I need to ask your honest opinion, my careful contrarian! Should this reader move on from me?
“I’m 89 years young and active,” Peter wrote. “Don’t need income—only growth.”
(I’m the income guy. Do I have a growth arrow in my quiver, or should this young man look elsewhere to get rich?)
First of all Peter, you’re the man. You’re doing many, many things right to eschew current income at the spry age of 89. Good for you for staying active and for being in a position to still pursue portfolio price gains.
Peter went on to explain that he holds six of my official recommendations. He also owns the Vanguard Information Technology ETF (VGT). And then he dropped the hammer on me:
“Should I stop reading your missives? If so, which writer should I follow?”
Which writer—as in which other writer! Peter Pan, I appreciate the candor. Never get old, Peter. And never stop telling people how it is.
My main beat is high yields. Most readers here are retired, or approaching retirement, and looking to lock in that high income today. They are all about turning the pile of cash they’ve saved their entire lives into a sustainable dividend machine to fund their retirements.
Many have $500K to $1 million or $2 million or so. They like the 8% yields because they generate $40,000 per year on a $500K nest egg. Or $160K per year in payouts on $2 million.
But it sounds like you are in an excellent spot. Your pile is quite cushion-y and you just want to keep growing the nest egg. Awesome.
It’s rare to see a growth emphasis at age 89. Usually at 39, 49 or even 59—when we have years to decades to retirement—do we focus on growth. So Peter, don’t grow up! Let’s keep your portfolio rolling with the safest, securest way to more gains—the dividend magnet.
Over the long haul, stock prices follow their payouts higher or lower. Find me a company growing its dividend by double-digits and I’ll show you a long-term 10%+ annual total return machine! Dividend hikes are the most reliable way to invest in growth. We get rich on the dividend schedule.
The current yield of a dividend magnet stock never tips off what’s happening. It looks pedestrian at 1% or 2% or 3%. But what’s really happening is that the Peter Pan portfolio is flying along, humming at double digits per year alongside that dividend growth.
We’re doing a twist, Peter, on what you’re seeing with VGT. It’s a more nuanced, pick-and-shovel approach to the market. Let me give you an example.
EQT Corp (EQT) is the power broker behind many of the stocks you’re buying in your Vanguard fund.
We added it to our Hidden Yields dividend growth portfolio back in January 2024, discussing that there were only three sure things in life: death, taxes and the cyclical nature of natural gas.
At the time, gas fetched a measly $3.25 per million BTUs. Producers were shutting down their wells because they simply weren’t profitable. And of course, investors were fleeing the sector. And that’s why we bought—knowing that the cure for low prices was low prices.
EQT is the premier producer in Appalachia, sitting on nearly 4,000 profitable drilling locations at even rock-bottom gas prices! Yet at the time the stock was impossibly cheap, trading around six times free cash flow. The company was set to generate roughly $14 billion in free cash over the next five years, against a market cap of $15 billion. In other words, we could buy the whole company and get paid back by 2028. And we’re already more than halfway there, with the cash still rolling in…and its pace likely to pick up!
Fast-forward to today, and EQT’s market cap has ballooned to $37 billion. The reason? Natural gas for electricity generation is in high demand, with AI sucking up all the available juice it can find. Every time you ask ChatGPT or Claude what it thinks about something, the machines are spinning, and they demand energy. Skeptics can argue about how much a single query burns, but nobody argues about the gigawatts AI in aggregate requires.
So, how’s EQT doing? The price alone is up 47% since our initial buy, with more room to run!
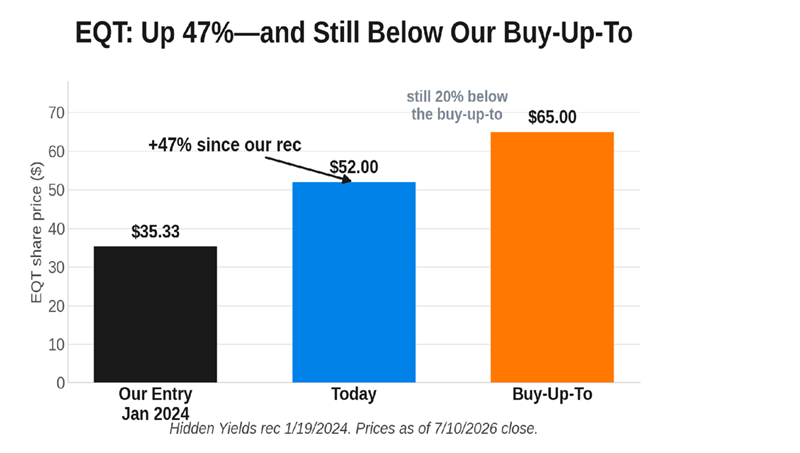
In total we’re up 52%, including dividends. And this stock has more room to run because EQT’s natural gas is critical to the current AI build out.
Why do I still like EQT after this run? Two words. Two letters, actually: AI.
Let’s consider Homer City (not named after Mr. Simpson, to my knowledge, who lives in Springfield, anyway). This is a dead coal plant in Pennsylvania, once the state’s largest, and it’s experiencing a renaissance as an AI power campus. The Homer City location spans 3,200 acres and will produce 4.4 gigawatts of on-site gas generation. That’s the output of roughly four large nuclear reactors. It flips on next year, and EQT is the exclusive gas supplier in one of the largest single-site gas deals in North American history.
EQT is the power broker behind the bots. AI runs on electricity, which is ultimately EQT’s gas.
And this is the biggest buildout in modern American history. We’re talking about $700 billion of data-center spending from the “hyperscalers” (Google, Microsoft, Amazon and friends) this year alone! And that’s nearly double last year’s investment.
Current grid “wait times” are 5+ years. Want power? Take a number! Or consider “on-site natural gas” which is a VIP power plant right next door to the data center. (No line to wait in!) On-sites can deploy in just two years versus 5+. This is why “the natty” is booming and we’ll see more Homer Cities across the country.
Data centers are projected to boost America’s power-plant gas burn by 20% by 2030. Homer City’s contract alone supplies one-tenth of that increase and EQT is locked in to benefit:
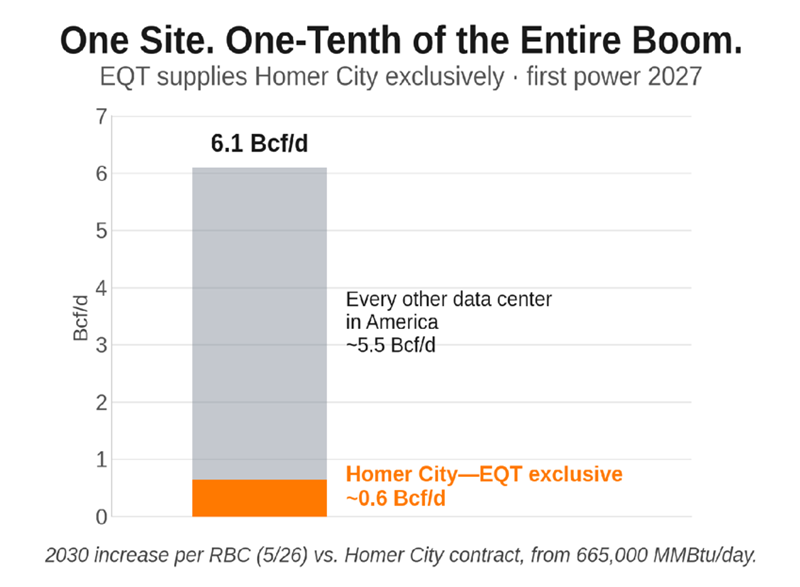
The boom is already showing up in EQT’s top and bottom lines. First-quarter revenue nearly doubled to $3.4 billion, and profits nearly doubled as well.
And get this—gas itself is still cheap! “Henry Hub” standard variety goes for just $3.20 per million BTUs today, which is about the same it was trading at when we bought EQT. The company has nearly doubled its profits with zero help from gas price gains thus far.
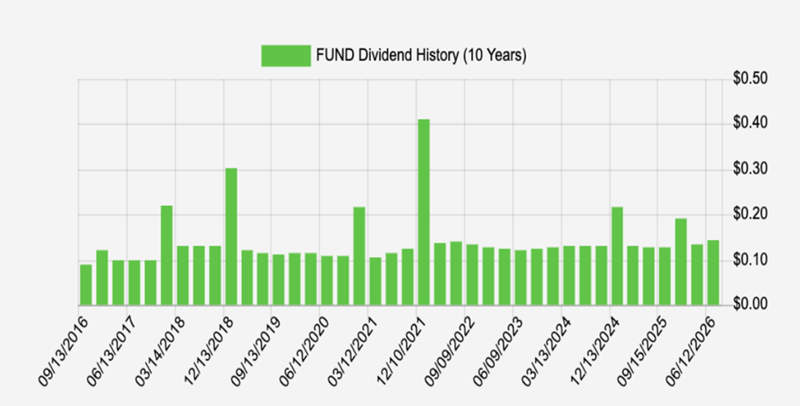
As I mentioned (warned!) earlier, these “pick and shovel” payers rarely impress with their current yields. EQT yields just 1.3% today, which is fine for you, Peter. You’ll appreciate that EQT pays just 12% of its profits as dividends today and that management just raised its dividend in October by 5%. More hikes ahead are likely.
So, to answer your question, Peter: please, no—don’t stop reading. Keep on asking the questions that investors half your age forget to ask. Yeah, we can do growth. Here’s how I’d recommend we do it responsibly.
As my kids are fond of pointing out to their friends: I’m 44 and a half (ah, youth). Halfway to you, Peter—and I aspire to be you when I grow up. Bless her heart, my youngest’s friend mentioned last week that there was no way her dad was in his 40s—he looked like he was in his 30s. I know 30 is ancient to an eight-year-old, but hey, I’ll take it. Halfway to you, Peter. Still chasing growth—with a protective stock seatbelt on!
And EQT isn’t the only dividend grower to buy here. Above where EQT operates—up on the land’s surface—we have a company that owns the buildings and cashes the rent checks from these hyperscalers. This company is basically the landlord to everyone participating in the AI boom. The biggest names in tech are paying rent to this firm.