
2025 dividends to date £359.00
Cash for re-investment £215.00
Investment Trust Dividends
2025 dividends to date £359.00
Cash for re-investment £215.00

If your risk tolerance allows u to consider buying a position in FAIR, (see below) u could lessen the risk by pair trading with a lower risk share, no share is entirely risk free.
Annual financial results for the year ended 30 June 2024
This announcement contains regulated information
CHAIRMAN’S COMMENT
“City of London’s total return of 15.6% outperformed the FTSE All-Share Index. The dividend was increased for the 58th consecutive year and fully covered by earnings per share.”
INVESTMENT OBJECTIVE
The Company’s objective is to provide long-term growth in income and capital, principally by investment in equities listed on the London Stock Exchange. The Board fully recognises the importance of dividend income to shareholders.
CTY currently yields 4.8%, other dividend heroes could be researched.
FAIR/CTY. The blended yield would be 9%, ensuring a higher yield with a lessened risk profile.

Thanks for reading The Oak Bloke’s Substack! Subscribe for free to receive new posts and support my work.
Dear reader
This is an idea from the OB 2024 (which are up 1.3% in 2025), and one of the highest yielding shares out there. In fact your broker asks you to “prove” you are sophisticated enough to buy this share.
This article recaps the principle of a “CLO” and examines performance and considers what 2025 might bring.
So you’ve heard of junk bonds, probably. What makes it “junk” exactly? Risk. BB rated or below is junk. Above BB is “investment grade”. The theory is lending to the government is perfectly safe, and then lending to business is risky. Those risks range from AAA down to CCC. Investment grade you’ll earn 5%-6%. Junk you’ll earn much more. 10%-17%. Some loans are “junkier” than others. The “junkiest” can be picked up for pennies in the pound. Bit like factoring. But is “junk” actually junk? Or is there brass where there’s muck?
So a CLO is basically a packaging up and pooling of various loans into a vehicle which funds itself via what it calls equity and debt. The debt investors get diversification and credit-enhancement benefit, while CLO equity investors get higher returns.
Confused? If only I had someone like Margot Robbie to explain.
Now Margot, if you paid attention, explained CDOs and MBS Mortgage Backed Securities and just gave you quite a negative view of these. CLOs aren’t CDOs (which are based on residential mortgages) – CLOs are business loans instead. But the principle is similar. Hence the video.
Potentially yes. But this blog article “how CLOs” endured the great financial crisis” provides an excellent explanation of why the great short (poor man) Michael Burry wouldn’t (and to my knowledge didn’t) bet the house (so to speak ha ha) against CLOs.
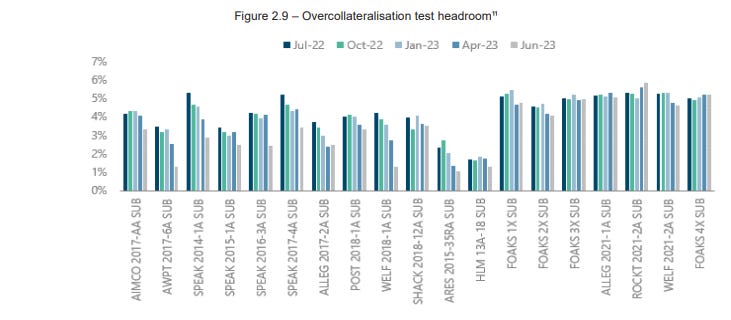
CLOs or Collateralised Loan Obligations are managed by clever firms who, on your behalf, sniff out and buy a package of loans, but who also borrow money to enhance returns and manage risk. To “over collateralise” means to buy CLOs that come with a degree of protection. If defaults remain at X% then you don’t lose out. That’s called a cushion…. a margin of safety. It’s about 4%-5% in FAIR’s case. More on that when we speak about the Covid crisis later.
How do you even buy FAIR? Well you have to become a “sophisticated investor”. In plain English this means your broker will have a short, online questionnaire. Once you answer those satisfactorily this unlocks certain investments you couldn’t access before. Put them in your ISA or SIPP same as any other share. Each time you access FAIR’s web site you have to agree some T&Cs before they’ll let you see any info.
One of these “sophisticated” options are CLOs run, bought and managed by firms like Fair Oak Income. These invest in both equity and debt. They run a lot of mathematical models to control for risk and because loans are bought and sold much like stocks and shares they recycle funds into new CLOs and CLNs. The OCF charge is 1.29% so they make good money in this world.
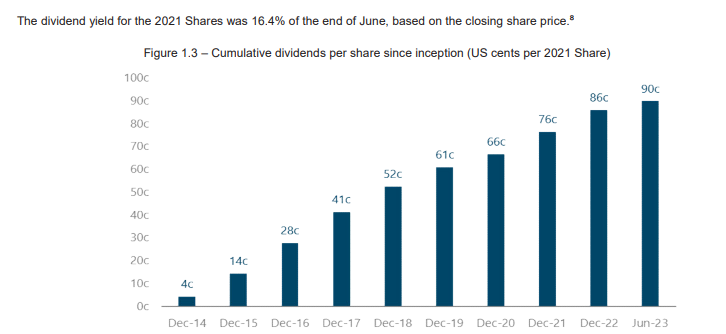
The dividend yield is currently above 14%. And FAIR has been consistently churning out dividends since 2014. It’s fair to say you aren’t going to achieve great capital gains but if your objective is to generate income then this investment has quite some attraction.
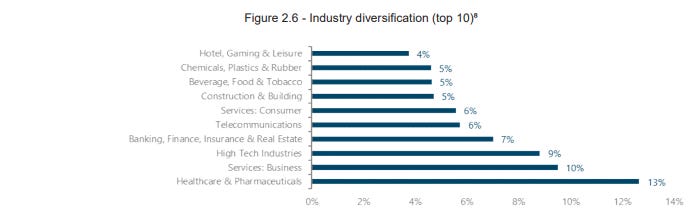
While a huge black swan event would affect CLOs and rising levels of default could affect future returns it’s also the case that CLOs are generally managed to spread risk by geography, by industry and by specific lender. Your eggs aren’t in a single basket.
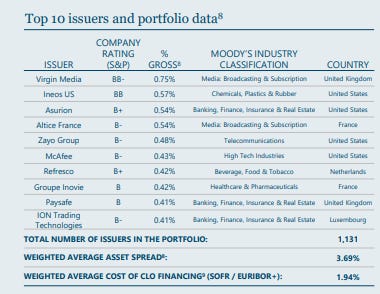
This is the industry diversification of FAIR. So quite some degree of diversification.
Generally things would have to get “really bad” to actually lose money as in above 5%. Below this level is called “Distress”.
A few years back we had elevated “Distress” during covid. Fair Oaks annual report shows us what happened next. Distress in green spiked and then fell. Defaults in blue rose and receded. Overcollateralisation meant FAIR – or FAIR shareholders – didn’t lose anything…. on that occasion.
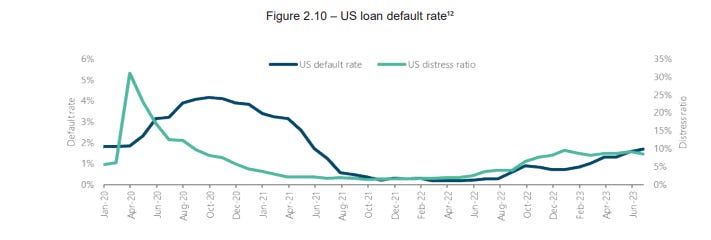
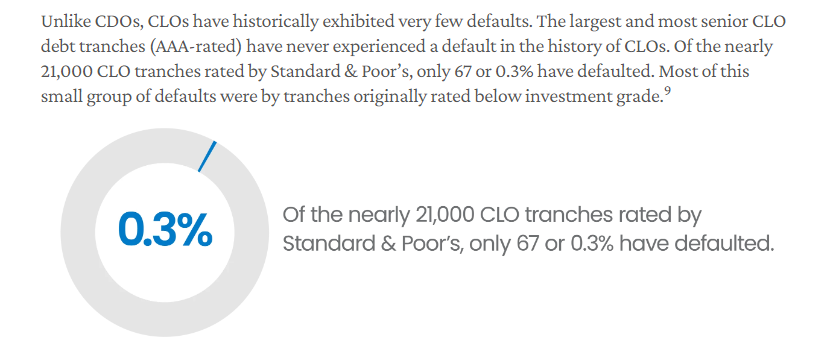
In the event of things getting bad beyond Covid level bad, a further level of bad would be dividends are cut (but in 2020/2021 they weren’t). Level 2 bad would be capital loss. But this is rarer than you might think. The link to Clarion shows this statistic.
But the other perspective about “things getting bad” is that new loans get cheaper and more profitable (aka reinvestment spreads). For example Clarion tells us “Historically, wider reinvestment spreads can mitigate or exceed elevated loan losses during economic downturns. Reflecting this dynamic, total returns for CLOs rose in the years following the GFC.” (The GFC is not a Roald Dahl character but instead the Great Financial Crisis i.e. 2008-2009)
This is illustrated in Fair Oaks 2022 report – during Covid you could buy loans for “25% off” during the 1st lockdown. So a 20% yield jumps to a 27% yield, so losing 12% through defaults, is countered by +5% over collateralisation plus gaining +7% yield on new investments. So these are opposing forces which suddenly makes CLOs – and Black Swans – a bit less scary. In my mind at least. Especially if your mathematical models mean you build and conserve cash ahead of bad events and can therefore take advantage of said bad events by buying at 25% off.
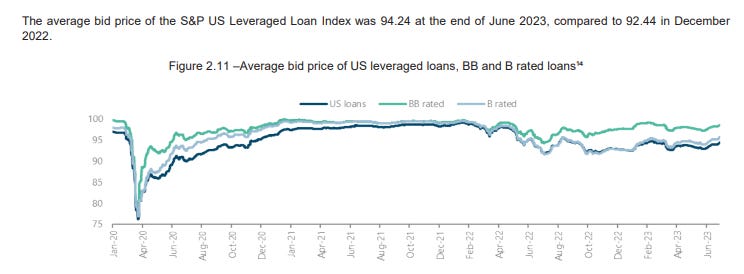
The above chart is basically what gives these outsize returns. If a business is being charged say 10% interest for a loan, then the price of the risk of that loan means you can buy that 10% loan for say 94p in the pound. By borrowing money a CLO equity holder can earn well over 20% through leverage. That’s roughly the business model.
Looking at the 2022 and 2021 accounts you can see there’s a fair value through P&L gain in 1 year and a loss in another. Roughly speaking “distributions” which are the loan repayments fund the dividend and then fair gains and losses increase or decrease the capital.
To my mind, looking at FAIR’s P&L there are actual returns “distributions” funding the dividend so this isn’t a snake eating its own tail. It’s also true, however, these are complicated accounts so isn’t as simple as buying and selling widgets. See my back of a fag packet assessment further on.
I can’t answer that. There are several out there all delivering a high dividend. BGLF was another reader idea. Fair is one of the highest yielders. One could argue lower yielders potentially offers higher chances of capital growth. This video gives you a glimpse into the world of CLOs.
For most investment writers this topic area is difficult & complicated. Far easier to talk about the likes of a company selling widgets. When writing an article about FAIR it’s an easy cop out to focus negatively on the risk – writing such an article is almost the simplest way to explain (and dismiss) Fair Oaks or CLOs like this.
But otherwise all articles are negative, negative, negative. Risk, risk, risk. Go and search for yourself – here’s a link to Google news for Fair Oaks.
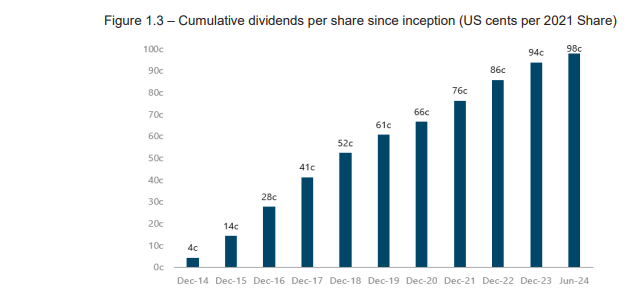
8c dividends cost $36m/year. So 90 cents distributed is about $405m cumulatively.
$432m original share capital and -$170m negative retained earnings (that sounds scary doesn’t it?) is $260m net (and $240m as at the last accounts 30/06/24).
So in 8 years, FAIR has more or less returned ALL capital (okay 93.75% $432m-$405m if you’re being picky). Plus still has assets of $260m (which is about 55p a share) and that 55p is like a profit. Okay dividend distributions eats into that number, but it’s still a profit. Not a snake eating itself which was the reason to do that maths and to think about that $170m apparent LOSS. So what I’m saying is if you’d bought FAIR on day 1 (in 2014) you’d still be quids in still in 2025.
This analysis is my attempt to explain the opprotunity and gives the good and bad of Fair Oaks income. Hopefully it helps also demystify this complicated area a little bit and gives you a starting point for your own research and to consider whether you should become a “sophisticated” investor.
I ran through the different metrics over the past 4 years to get an idea of how FAIR fares over time.
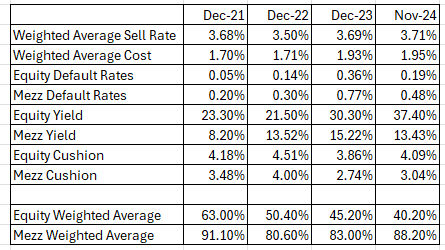
CLO Equity at the end of 2024 offers increasing yields but can be bought at lower levels. While Mezzanine debt is in front of equity the low default rates and a reasonable average 3%-4% OC Test Cushion offers quite some comfort.

I personally continue to hold FAIR and it is nice to see the dividend roll in each quarter. I don’t expect it to deliver capital returns, in fact my analysis expects some limited amount of capital losses, but as a tasty dividend machine the dials appear to point to still point green in 2025. In fact those growing CLO equity yields look positively ripe.
Regards
The Oak Bloke
Disclaimers:
This is not advice, make your own investment decisions.
Micro cap and Nano cap holdings might have a higher risk and higher volatility than companies that are traditionally defined as “blue chip”
It is one of the largest energy infrastructure companies in America, being specialized in oil and gas pipelines.
On May 15, it pays a dividend of $0.2875 per share, and in order to receive it, shares must be held before April 29. Its dividend yield is 6.10%.
On July 17 it presents its results. Looking ahead to 2024, it expects EPS or earnings per share to increase by 14.1% and revenue by 12.9%.
The company has been a trusted role model when it comes to dividends, increasing them for 6 consecutive years and maintaining payouts for 14 consecutive years, reflecting Kinder Morgan’s financial discipline and commitment to shareholder returns.
The first quarter results reinforce the company’s confidence and the company’s extensive pipeline network is expected to be instrumental in the shift to low-carbon energy sources.
In addition, Kinder Morgan shares are known for their low volatility, which may appeal to investors looking for stable stocks in the energy sector.
Over the past 12 months it is up 14.25% and has no sell ratings.
The potential the market gives it is around $20.41, although it will first have to overcome resistance at $19.33.
The dividend yield is 5.5%. The company has been increasing it for 17 consecutive years.
On April 23 it presents its accounts. For the current year the forecast is for an increase in EPS of 5.3% (9.8% by 2025) and revenue of 5.4%.
Philip Morris’ gross profit margin is 63.39%, indicating strong operating efficiency and pricing power in the market.
It has invested $12.5 billion to develop innovative adult smoke-free products, which are already in 84 countries and used by 20.8 million people, accounting for 37% of the company’s total net revenues in the full year 2023.
Its shares are up 0.80% over the past year. It has no sell ratings.
The market gives it a power at $108.09, although for example Citi is more bullish and puts it at $113.
The company was formerly known as Bell Atlantic Corporation and changed its name to Verizon Communications in June 2000. It was incorporated in 1983 and is headquartered in New York.
With a dividend yield of 6.57%, it ranks among the top performers in terms of dividends over the past seven years.
On April 22 we will know its quarterly results and this year it will meet its free cash flow (cash generation) target by touching $10 billion.
To its credit, Verizon gives customers access to exclusive, money-saving content offerings that they can’t find at other providers, and it is leading the industry.
It is a defensive stock with solid cash generation and good dividend coverage.
Over the last 12 months its shares are up 17.17% and it has no sell ratings.
The potential assigned by the market is at $45.72.
May 2 will be the time to know its accounts. By 2024, EPS is expected to increase by 5.3% and revenues by 9.3%.
Its shares have fallen by -21% in the last year, although in the last 3 months they have risen by 14.50%.
The market sees potential at $66.83.
This FTSE 250 firm offers one of the highest yields in any major FTSE index, which could one day generate enormous passive income if I invest wisely.
Posted by
By Simon Watkins

When investing, your capital is at risk. The value of your investments can go down as well as up and you may get back less than you put in.
I first bought shares in FTSE 250 investment manager abrdn (LSE: ABDN) after it was demoted from the FTSE 100 in 2023.
This may appear an odd choice to many, but I did it for three reasons that I still think hold good.
The first was that the resultant price drop had nothing to do with the firm’s fundamental quality. This meant to me that a potentially huge value gap immediately opened in the stock.
Specifically, FTSE 100-tracker funds had no choice but to sell the shares when they fell out of the leading index. The same applied to funds only allowed to invest in FTSE 100 shares.
Despite the company already being fundamentally very solid in my view, it embarked on a reorganisation. The aim of this was to cut costs, improve its offering to clients, and boost profitability.
A risk for my investment is if this reorganisation fails for some reason. However, it appears to be going well so far, with H1 results showing an IFRS post-tax profit of £171m. In the same period in 2023, it recorded a £145m loss.
Also positive was a 13% year-on-year reduction in operating costs over the same period – to £372m.
Its 24 October Q3 trading update showed assets under management increase 2% year on year – to £507bn.
I am considering buying another £5,000 block of abrdn shares, bringing the total up to £15,000. The previous two blocks were bought around the same share price as now, when the dividend paid was also 14.6p. This currently yields a stunning 11.1% based on its present £1.32 share price.
In fact, abrdn’s dividend has been the same since 2020. And analysts forecast it will stay the same this year and next.
So, £15,000 invested in abrdn would make me £1,665 in annual ‘passive income’ (this is income made with minimal effort) from now. If the yield averages the current 11.1% over 10 years (which is not guaranteed) this would rise to £16,650 and over 30 years to £49,950.
These returns are a lot more than I could make in my standard UK savings accounts.
However, if I used the dividends paid to buy more abrdn shares (‘dividend compounding’) then they could be much greater.
In abrdn’s case, doing this would make me £30,284 over 10 years, not £16,650, if the yield averaged the same. On the same basis, this would increase to £397,709, rather than£49,950!
By that point – and adding in the initial £15,000 investment – my abrdn holding would be worth £412,709.
If the 11.1% yield was still in play, this would generate me £45,811 a year in passive income.
Assuming inflation over the period, the buying power of that money would have been diminished somewhat by then. However, I should have a much more comfortable retirement than I would if I relied on the State Pension.
Consequently, I will be buying the additional abrdn shares very soon
Story by Mark Hartley
Stack of British pound coins falling on list of share prices© Provided by The Motley Fool
Building a portfolio of dividend shares as a means to earn a second income is a popular method used by British investors. Considering the unusually high yields found on the FTSE 100 and FTSE 250, it’s no surprise many see the benefit in the UK stock market.
Dividend investing can be a reliable source of passive income due to the regular payments. For those wanting to build up an investment, the dividends can also be reinvested to compound the growth. This makes them attractive to both early investors and retirees.
The key is to get started as soon as possible, even with just £5 a day. To ensure maximum returns, there’s a few important tips to remember to avoid making common investment mistakes.
Most investors already know the importance of diversification but it’s worth noting. Spreading an investment across different sectors and stocks reduces exposure to a single point of failure.
With dividends, aiming for a high The post Here’s what to look for when aiming to earn a second income from dividend shares appeared first on The Motley Fool UK. . But it’s not the only thing to consider. A history of consistent payments is also important — as is the payout ratio. This indicates the company’s ability to cover payments.
Dividends can be cut at any time so it’s important to assess the reliability of payments. A very high yield (10%+) can be a sign of a struggling stock with a plummeting share price.
In late 2021, investors may have jumped at the chance to buy Rio Tinto (LSE: RIO) shares after the yield soared past 11%. A growth in profits that year prompted the mining giant to pay a special dividend.
Even though the shares recovered the following year, the company slashed dividends by 38% on weaker revenue and earnings. Further reductions were made the following year, bringing the yield back down to 7.3%.
Lower dividends mean the company can invest more in growth, so things may improve from here. But such a cut still leaves a dent in a high-yield dividend portfolio.
A better option may be Imperial Brands (LSE: IMB). The tobacco giant is a reliable payer with a year-on-year dividend growth rate of 4.5%. Dividends have grown from 43p to 153p per share in the past two decades, with only one reduction during the pandemic.
Since 2020, NGP revenue is up 64%. Last year alone it grew 26.4%, helped by the launch of Zone oral pouches in the US. If that continues, it could remain a strong dividend stock. For investors focused on reliable dividend returns, I think it’s a stock worth considering.
The post Here’s what to look for when aiming to earn a second income from dividend shares appeared first on The Motley Fool UK.
Assura plc
Trading update for the third quarter ended 31 December 2024
Assura plc (“Assura”), the UK’s leading diversified healthcare REIT, today announces its Trading Update for the third quarter to 31 December 2024.
Jonathan Murphy, CEO, said:
“We have maintained momentum in the third quarter continuing to deliver against our strategic objectives. The recently acquired 14 private hospitals are now fully embedded into our portfolio and are performing as we anticipated. Our asset disposal programme, announced at the time of our private hospital acquisition, raised £48 million during the period and active discussions are underway on a further £110 million. We are on track to hit our target net debt to EBITDA below 9 times and LTV below 45% over the next 12 to 18 months.
“There is ongoing national recognition that improved health outcomes can be delivered by investment in community healthcare and through utilising capacity within the private sector. We have seen this recognition backed up by policy actions: £900 million of funding for GPs announced in December; an additional £100 million of committed investment to upgrade the GP estate; and this month a new partnership agreement between NHS England and the independent sector to work together for the benefit of patients. Assura is uniquely positioned to support this shift through the delivery of high-quality, modern and sustainable facilities.
“As the UK’s leading diversified healthcare REIT, our progress in the third quarter, and a dividend yield of over 9%, strengthens our position as an attractive long-term investment that is underpinned by stable trends in the UK healthcare sector.”
Delivery against our strategic objectives
• Disposal programme progressing strongly with 17 properties sold in the quarter for net proceeds £48.4 million, in line with book value, in addition:
o £110 million of disposals in active discussions
o £90 million further pipeline identified for potential disposal
• Positive progress on rent reviews, 59 settled in the quarter, covering £8.5 million of existing rent and generating an uplift of £0.6 million (7.2% uplift on previous passing rent)
• Well positioned to take advantage of the strong growth in the UK private hospitals market
o Early discussions on several asset enhancement opportunities on existing sites
o Growing pipeline of further development opportunities
• Completed one asset enhancement capital project (total spend £1.2 million) and 5 lease regears (existing rent £1.2 million); on site with a further two capital projects (total spend £4.0 million)
• Current quarterly dividend 0.84 pence per share, or 3.36 pence per share on an annualised basis (equivalent to 9.3% dividend yield on last night’s share price)
Pipeline of opportunities for strategic expansion and further growth
• £35 million of rent (20% of rent roll) due to be reviewed to RPI or CPI in Q1 2025
• Currently on site with five developments; total cost of £44 million with £22 million remaining to be spent
o Two net zero carbon buildings in the UK (one GP medical centre, one NHS children’s therapy centre) both of which are due to be completed and fully rent producing in the next quarter
o Three on site schemes in Ireland progressing well
• Pipeline of 12 capital asset enhancement projects (projected spend £8.3 million) over the next two years
• 29 lease re-gears covering £2.8 million of existing rent roll in the current pipeline
Strong and sustainable financial position
• Portfolio now stands at 608 properties with an annualised rent roll of £176.9 million (September 2024: £179.1 million)
• Net debt reduced by £46 million with disposal proceeds used to reduce the drawn revolving credit facility
• Weighted average interest rate 2.93% (September 2024: 3.0%); all drawn debt on fixed rate basis
• Weighted average debt maturity of 4.9 years, limited refinancing on drawn debt over the next 3 years. Over 40% of drawn debt matures beyond 2030, with our longest maturity debt at our lowest rates
• A- rating reaffirmed by Fitch in August following private hospital portfolio acquisition
• Net debt of £1,529 million (September 2024: £1,575 million) on a fully unsecured basis with cash and undrawn facilities of £190 million
SUPERMARKET INCOME REIT PLC
(the “Company”)
DIVIDEND DECLARATION
Supermarket Income REIT plc (LSE: SUPR), the real estate investment trust with secure, inflation-linked, long-dated income from grocery property, has today declared an interim dividend in respect of the period from 1 October 2024 to 31 December 2024 of 1.53 pence per ordinary share (the “Second Quarterly Dividend”).
The Second Quarterly Dividend will be paid on or around 28 February 2025 as a Property Income Distribution (“PID”) in respect of the Company’s tax-exempt property rental business to shareholders on the register as at 31 January 2025. The ex-dividend date will be 30 January 2025.
07 January 2025
Trustnet found 69 funds that achieved top-quartile returns in three back-to-back years.
By Emma Wallis,
News editor, Trustnet
Fund managers have had to contend with vastly different investment environments during the past three years, from high inflation and interest rate hikes in 2022, causing bonds and equities to plummet, to the recovery in 2023 and the bull market of 2024 – punctuated by a bout of volatility last summer.
Amidst mounting geopolitical tension, macroeconomic uncertainty, an artificial intelligence boom and a tumult of elections, 69 funds in the Investment Association (IA) universe managed to consistently beat their peer groups and deliver top-quartile returns in each of the past three calendar years.
This represents 2% of the 3,358 funds in the IA universe with three-year track records, where quartile rankings were available.
These figures exclude the IA Unclassified, Specialist, Volatility Managed, Targeted Absolute Return and Property Other sectors, for which quartile rankings were not attainable.
A larger cohort of 374 funds were top quartile in both 2023 and 2024, when markets were driven by similar factors, such as the AI exuberance and the dominance of the Magnificent Seven.
To some extent, 2023 was a transition period with interest rate hikes throughout the first half before a fourth-quarter relief rally once the market became convinced that rates had peaked.
Nonetheless, the investment environment of 2022 and the factors that drove performance were dramatically different to the following two years, as the chart below shows, which is why so few funds outperformed in all three years.
Performance of global equities and bonds, 2022-24
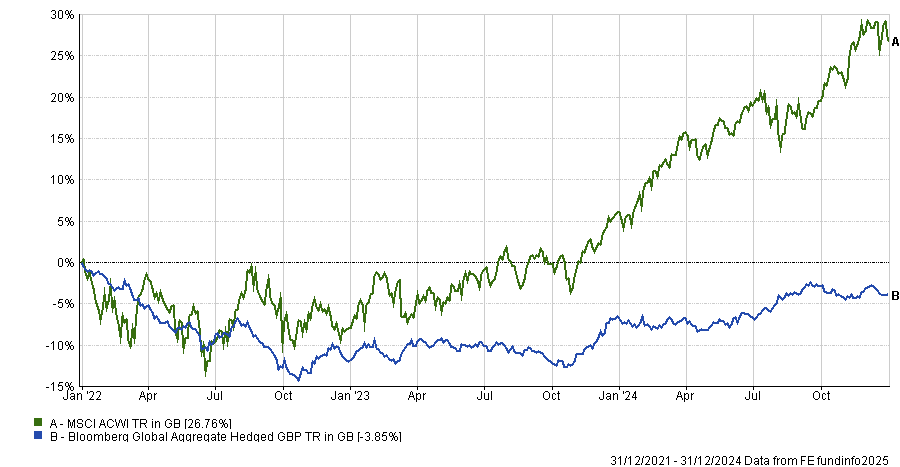
Source: FE Analytics
Amongst the 69 top-quartile funds in three back-to-back years, Japanese and Indian equity funds achieved some of the best overall performance, as the table below shows.
Japanese equities surged on the back of corporate governance reforms, economic modernisation and the return of inflation, while India’s exponential economic growth delivered compelling returns for investors.
The 25 consistent outperformers making the highest three-year returns
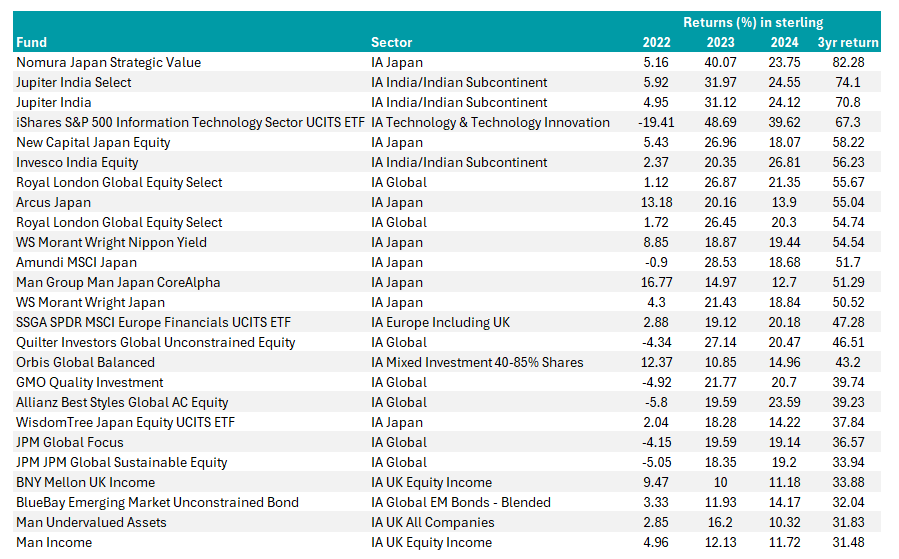
Source: FE Analytics
Nomura Japan Strategic Value, Jupiter India Select and Jupiter India delivered the highest returns over the three-year period.
The iShares S&P 500 Information Technology Sector UCITS ETF pipped them to the post in 2023 and 2024, as AI exuberance propelled chip designer Nvidia and other tech giants to ever greater heights. However, it made a thumping loss of -19.4% during the bear market of 2022, even though it was still within the top quartile of the IA Technology & Technology Innovation sector.
Tech stocks were pulled downwards in 2022 as demand fell off a cliff following the Covid-19 lockdown spending splurge and as interest rate hikes increased the discount rate used to value growth stocks.
The $1.8bn Nomura Japan Strategic Value fund takes the top spot for three-year performance and has beaten its sector and benchmark by a wide margin. Manager Yoshihiro Miyazaki uses quantitative screens combined with bottom-up fundamental research to find stocks priced below their intrinsic value, where corporate restructuring can unlock returns.
Performance of funds vs sector and benchmark, 2022-24
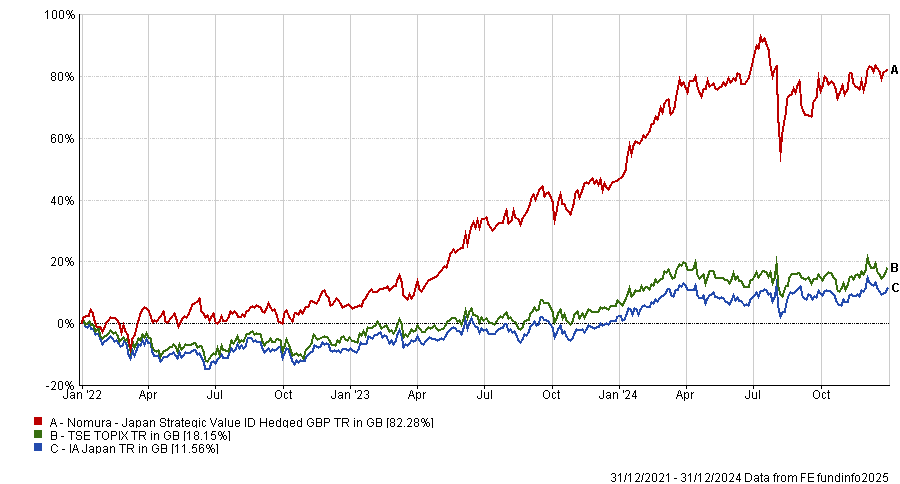
Source: FE Analytics
Eight Japanese equity funds attained top-quartile performance in three back-to-back years – slightly more than in the IA Global and IA Europe Excluding UK sectors (seven funds apiece, making them the next-best sectors for consistency).
Man Japan CoreAlpha and Arcus Japan deserve honourable mentions for being the top and fourth-best performers of all 69 reliable funds in the difficult market of 2022.
Performance of funds vs sector and benchmark, 2022-24
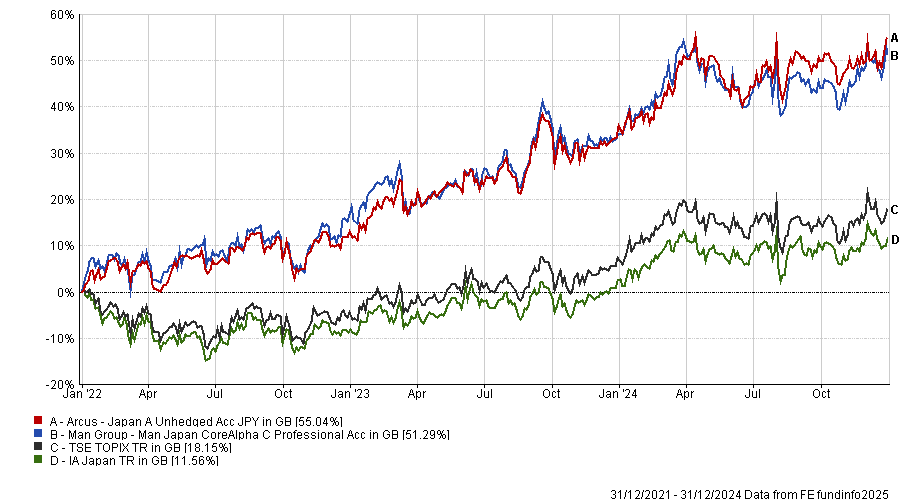
Source: FE Analytics
India was another sweet spot, where the £2bn Jupiter India fund proved popular with investors and was one of the most-bought funds during the first half of 2024. Managed by Avinash Vazirani, it has greater exposure to small- and mid-cap stocks, which are geared into India’s domestic growth story, than many of its peers.
Jason Hollands, managing director of Bestinvest, said: “The fund is managed by a well-regarded and stable team who have delivered very strong returns.”
Performance of funds vs sector and benchmark, 2022-24
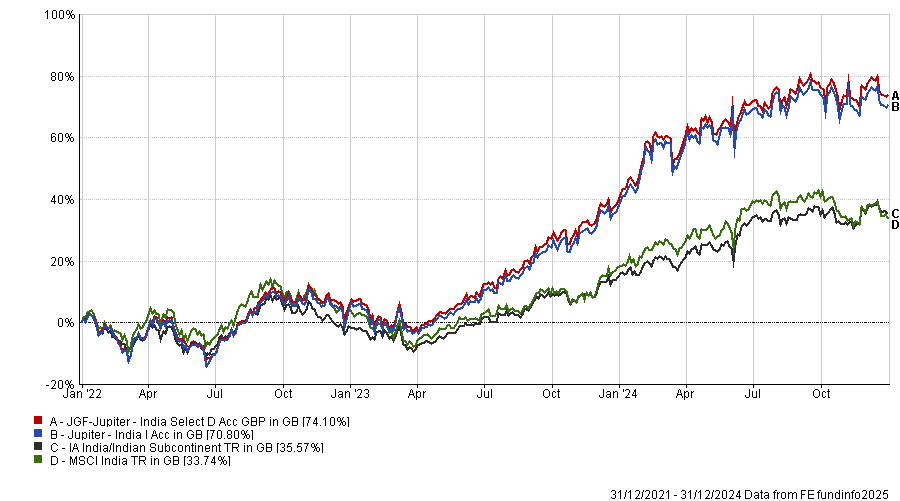
Source: FE Analytics
A full list of the 69 top-quartile funds in three back-to-back calendar years is below.
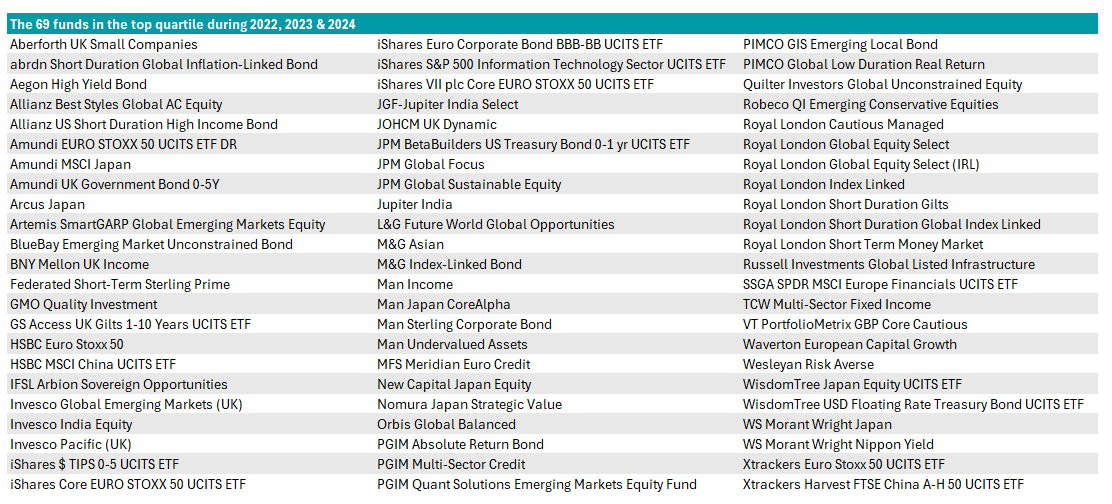
Source: FE Analytics
£££££££££££££££££
The Snowball invests mainly in Investment Trusts and has a position in one ETF, all for the dividend stream to be compounded.
If you have a longer term to your retirement, you could invest 75% for dividends and 25% for TR, or 50/50. The choice my friend is yours.
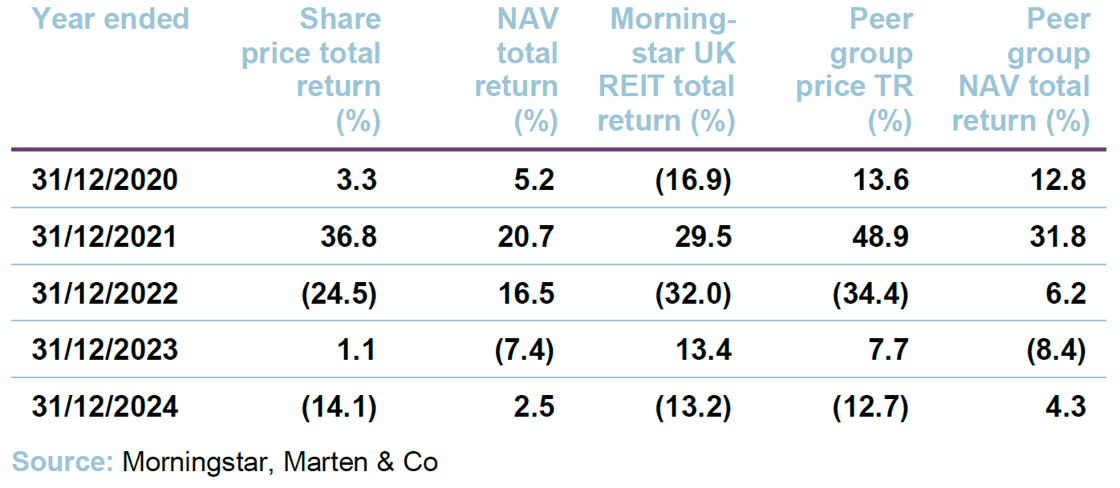
| Urban Logistics REIT |
| Discount at odds with growth plans |

| A negative reaction to the UK budget sent gilt rates higher and saw investor caution return to real estate stocks. The recent share price weakness that followed this has seen Urban Logistics REIT’s (SHED’s) discount widen to more than 30%, which is at odds with the sector fundamentals and the work the company’s adviser is putting in. An asset recycling programme is underway. Here the adviser is targeting new assets, where it can work its asset management enhancement magic. This, coupled with the adviser’s expertise in driving up rents and capturing rental reversion from its portfolio, should result in substantial earnings growth and much-coveted dividend cover. Meanwhile, a more normalised occupier market is forming, with supply and demand fundamentals returning to pre-COVID levels, putting greater emphasis on landlords’ ability to achieve returns. This is where SHED has traditionally excelled and, with its active approach to asset management, the foundations are set for a re-rating of its shares. |
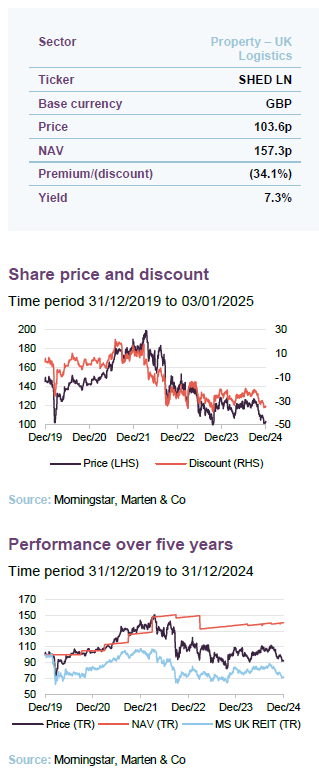
| SHED invests in a diverse portfolio of single-let, urban logistics properties located in the UK, with the aim of providing its shareholders with a 10% to 15% total return per annum. |

| This marketing communication has been prepared for Urban Logistics REIT Plc by Marten & Co (which is authorised and regulated by the Financial Conduct Authority) and is non-independent research as defined under Article 36 of the Commission Delegated Regulation (EU) 2017/565 of 25 April 2016 supplementing the Markets in Financial Instruments Directive (MIFID). It is intended for use by investment professionals as defined in article 19 (5) of the Financial Services Act 2000 (Financial Promotion) Order 2005. Marten & Co is not authorised to give advice to retail clients and, if you are not a professional investor, or in any other way are prohibited or restricted from receiving this information you should disregard it. Charts and data are sourced from Morningstar unless otherwise stated. Please read the important information at the back of this document. |
© 2026 Passive Income Live
Theme by Anders Noren — Up ↑
