Investment Trust Dividends

Month: June 2026 (Page 11 of 14)

Across the pond

Contrarians: How to Play the Inflation Panic for Cheap 7%+ Dividends

Brett Owens, Chief Investment Strategist
Updated: June 2, 2026

Inflation forever?

The fear has taken root seemingly everywhere: the media, the bond market, the futures market. They’ve all bought into the idea that scorching price hikes (and high interest rates) are here to stay.

If you’re like me, my fellow contrarian, you’re paying attention—but you also know something else about times like these: When everyone expects something to happen, something else usually does.

That’s what I want to talk to you about today. Because all the data I’m watching tells me the crowd is wrong: It’s deflation, not inflation they should be focused on.

Falling rates, not rising rates.

This disconnect has put some top-quality “preferred” (hint!) 7%+ dividends on the outs, giving contrarians a chance to buy cheap and “lock in” their high yields. Let’s get into it.

Inflation “Groupthink” Runs Deep

Let’s start where everyone looks when talking inflation and rates: the bond market.

The 10-year Treasury yield sits just under 4.5%. The 30-year yield is right around 5%, where it’s been for weeks. That’s a headache for anybody looking to borrow money (including Uncle Sam, with his already bloated credit card!).

Futures traders, too, have bought in. They see the Fed keeping rates where they are for the next six months or so. Then, by a slim majority, a rate hike in January:
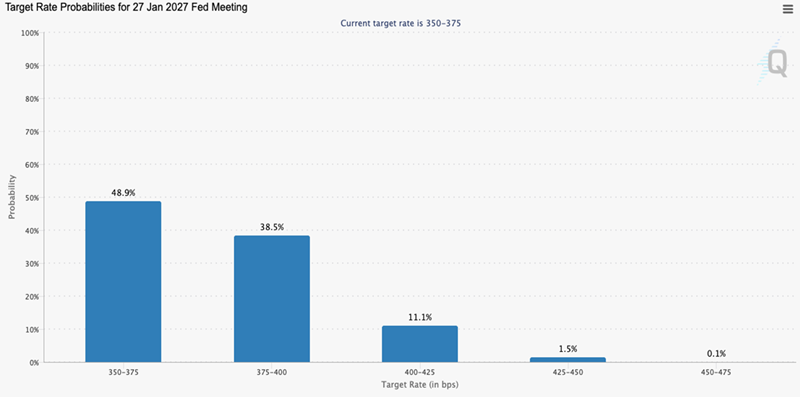

Source: CME Group

That looks like a pretty airtight argument for higher rates, right?

Except, well, here’s the other side of things, starting with wage growth, which has been trending one way since the pandemic: down.
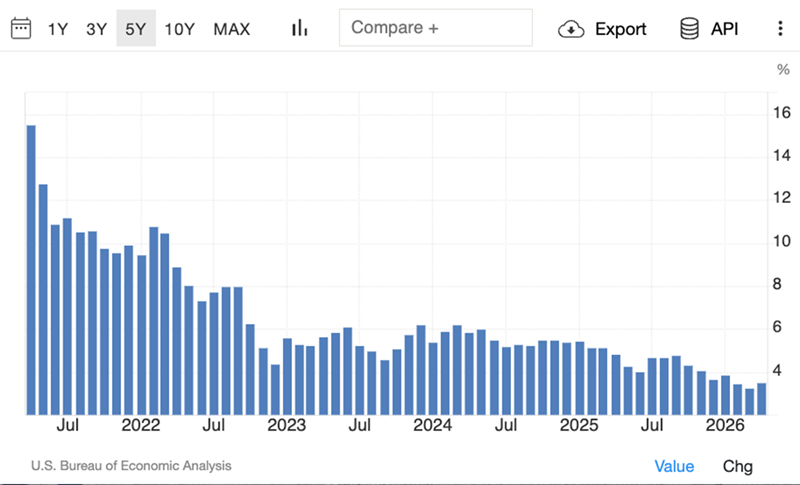
That’s clearly deflationary—and April’s rate of 3.6% fell behind the CPI. When that happens, people do one thing: cut back. The cure for high prices really is high prices!

Then there’s AI, which is an anchor on hiring. According to an April 2026 Goldman Sachs study, AI slowed monthly payroll growth by 16,000 jobs in the US over the preceding year. But the numbers don’t really matter here. Just talking about replacing workers with robots will cause some folks to sit on their wallets.

Iran? Neither it nor the US can afford to let this situation fester. Sooner or later, the strait will reopen. The oil will flow—and inflation will ease when it does.

And let’s not forget, we’ve got Kevin Warsh settling in at the Fed. The administration wants him to cut rates, and he’ll likely do so as soon as he can justify it.

But even with all this, investors still think inflation is here for the long haul. Let’s call that out with two 7%+ paying funds—including one with a payout that’s growing.

Inflation Fears Put These “Preferred” 7%+ Dividends on Sale

A couple weeks ago, we highlighted corporate-bond closed-end funds (CEFs) as timely plays on this situation, and they still are. Now let’s peer into another discounted corner of CEF-land: preferred shares.

The best way to think about preferreds is as stock/bond hybrids. They trade like a stock, and they pay dividends. But like a bond, they tend to trade around a par value, and the payout is usually fixed.

One more thing about those payouts: They’re typically a lot higher than those on a company’s common shares—regularly two or three times higher.

And like bonds, preferreds—or CEFs that hold them—are oversold today. That’s because while bond yields have risen with inflation fears, their prices have fallen (because prices move inversely to yields).

But as is the case with bond CEFs, these discounts have gone too far with preferred funds. That’s our cue.

A “Hybrid” Fund Trading for 12% Off (and Yielding 7.7%)

The 7.7%-yielding John Hancock Premium Dividend Fund (PDT) is a good place to start with preferreds because it’s a “hybrid,” investing 43% of its assets in common stocks, 30% in preferreds and 26% in bonds and other income securities.

That strategy has paid off, with the PDT’s common shares helping power the fund’s total return (in purple below) past the preferred-stock benchmark iShares Preferred and Income Securities ETF (PFF) in the last decade:

PDT’s “Hybrid” Portfolio Gives It a Boost
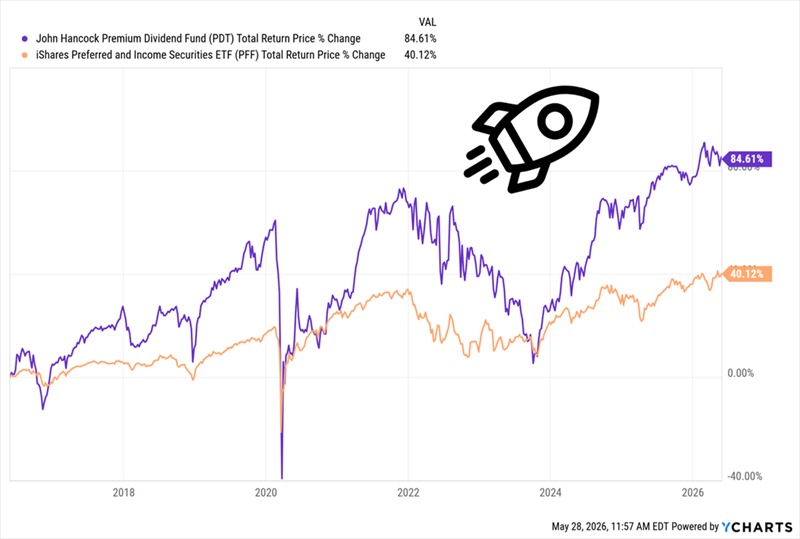
PDT also boosts its returns (and by extension an investor’s dividends and preferred-stock exposure) with leverage, to the tune of around 34% of its portfolio.

That would send many vanilla investors to the exits, with today’s interest rates. But we know this is a feature, not a bug: As rates fall, PDT’s borrowing costs will, too—as that rate decline boosts the value of its fixed-income portfolio.

Meantime, this smartly built fund is available at a 12.1% discount to net asset value (NAV, or the value of its underlying portfolio) as I write this. You can see that discount widening as the “inflation forever” mindset took hold this year:

PDT Gives Off a Clear Contrarian Buy Signal
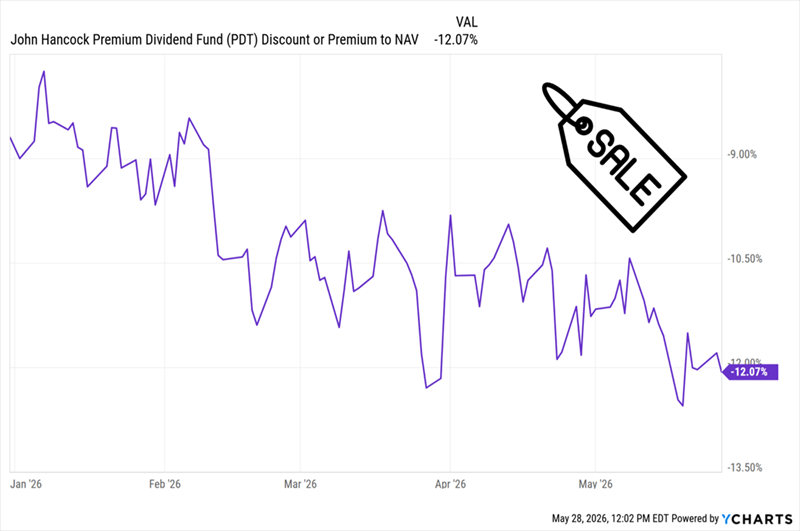
That’s a particularly sweet deal when you consider that PDT has, on average, traded around par over the last five years. A discount this deep is rare, and I don’t expect it to last in light of the steady 7.6%-yielding (and monthly paid) dividend PDT offers.

This 8.6% Dividend Is On a Growth Tear

The Flaherty & Crumrine Dynamic Preferred & Income Fund (DFP) is a “purer” play on preferreds than PDT, with 51% of its portfolio in these shares as of February 28. The rest is 45% bonds and around 4% convertible bonds and cash.

But even without PDT’s common-stock “afterburner,” DFP (in purple below) has still cleanly beaten its benchmark ETF, PFF, over the last decade, by nearly the same margin.

DFP Easily Beats Its Benchmark
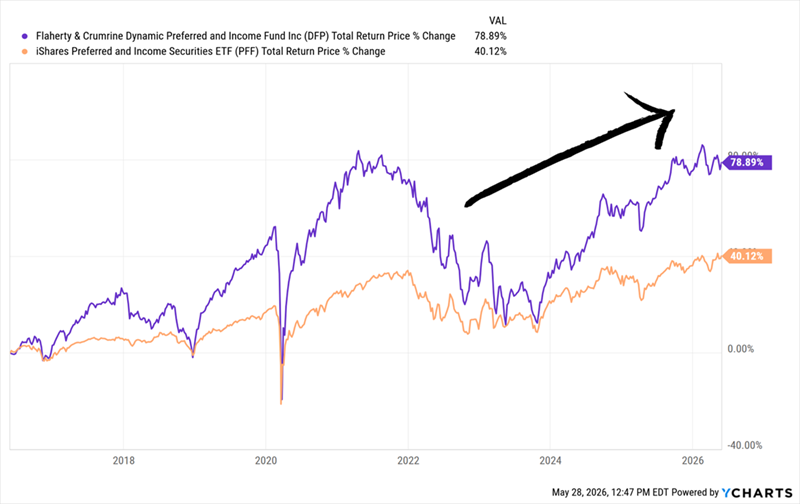
This performance shows why “human” preferred-fund managers won’t be replaced by AI. The preferred market is small, and personal connections are key to getting in on the hottest new issues. And F&C, which has been in fixed income for more than 40 years, has one of the deepest contact lists out there.

The fund’s strong return also supports its 8.6% dividend (again paid monthly), which has grown since DFP emerged from 2022’s inflation spike.

Management clearly sees through the current rate scare: It delivered a special dividend at the end of last year and hiked the regular payout again with the latest payment:

DFP’s Dividend Grows—and Shrugs Off the Fearmongers

Source: Income Calendar

That’s great for DFP shareholders, but what management is likely really trying to do here is narrow the fund’s discount, which has slumped to 8.3% in the last few years and has been stuck there since. Special payouts and dividend hikes are great ways for them to signal confidence and draw more buyers in.

DFP’s Discount Is Spinning Its Wheels (for Now)
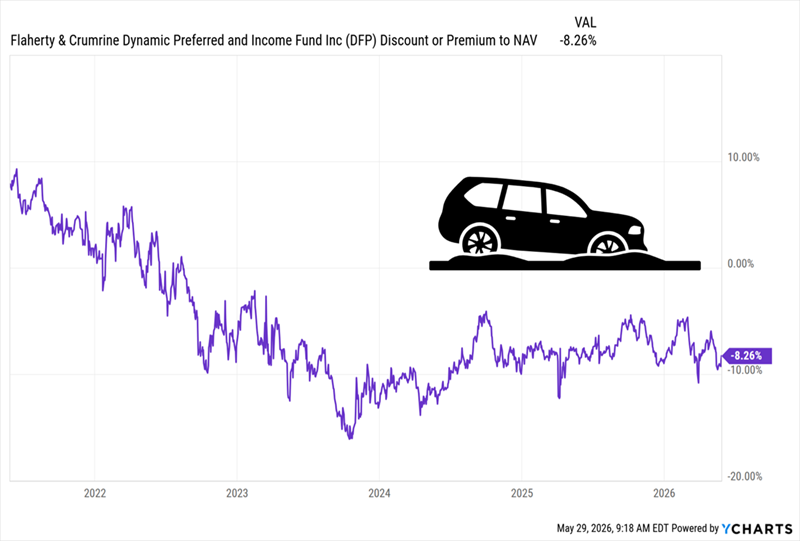
My prediction? They’ll be successful—and the fund’s high, and growing, monthly payout will put a floor under DFP’s discount and let investors pocket the fund’s growing income stream in peace.

Then, when today’s inflation scare ebbs, yields on existing fixed-income assets will slide, increasing the value of DFP’s portfolio and pushing its discount back toward par, where it was before the 2022 mess.

An 8.6% Payout Is Fine … But It Pales Next to a 11% Monster

Market comment

Oil shock complicates central bank outlooks

What now for central banks as higher oil prices driven by the Middle East conflict create a stagflationary shock for the global economy ?

Jumana SaleheenVanguard European Chief Economist

Shaan RaithathaVanguard Senior Economist

Key points

  • Oil prices above $100 are pushing inflation higher while slowing growth, leaving central banks grappling with a stagflationary backdrop that pressures both equities and bonds.
  • The ECB and BoE are more exposed to energy‑driven inflation risks and are now leaning towards higher‑for‑longer rates.
  • While central banks may look through the initial shock, concerns about inflation becoming embedded via wages and expectations mean that they are likely to err on the side of caution.

“The Middle East conflict has thrust global central banks into uncomfortable territory. With oil prices elevated, central banks are forced to navigate the classic stagflationary shock – where inflation accelerates as growth slows.”

Jumana Saleheen

Vanguard European Chief Economist

The Middle East conflict has thrust global central banks into uncomfortable territory. With oil prices having risen above $100 per barrel since the start of the conflict and expected to remain elevated in the weeks ahead, central banks face a challenge: how to respond when inflation accelerates and growth slows simultaneously.

This is a classic stagflationary shock. Oil price increases hit consumers and businesses almost immediately. Drivers feel it at the pump, the cost of transporting goods rises and price pressures start to ripple through the economy. Households and companies forced to pay more for energy have less to spend and invest, dragging down demand and pressuring economic growth.

Central banks find themselves pulled in opposite directions. Higher inflation implies tightening, but slowing growth implies easing. This high inflation/low growth combination could weigh on both equity and bond prices.

The calculus of forthcoming policy decisions

The US Federal Reserve (Fed), European Central Bank (ECB), Bank of England (BoE) and Bank of Japan (BoJ) explicitly addressed the energy shock in their April policy statements.

The ECB, given its reliance on energy imports, is particularly sensitive to the shock. Although it isn’t our baseline case, this sensitivity could lead the ECB to reverse a rate-cut cycle that took the deposit facility rate from 4% to 2% between June 2024 and June 2025. We have already revised our policy outlook for the UK and now expect the BoE to maintain the bank rate at 3.75%, not make two quarter-point cuts in 2026 as we had anticipated before the conflict.

How our central bank forecasts have shifted

Notes: Forecasts are for monetary policy rates at year-end 2026. The Fed’s forecast reflects the rounded midpoint of the Fed’s target policy-rate range.

Source: Vanguard.

We assess US monetary policy to be near neutral, where the policy rate would neither stimulate nor restrict economic activity. Although we continue to expect one quarter-point rate cut in 2026 from the current 3.5%–3.75% range, risks have shifted towards a longer period of policy inertia while the conflict plays out.

The effect of suddenly rising energy prices and monetary policy lags

The fundamental challenge is timing. While energy prices can surge overnight, monetary policy works with a lag. By the time higher interest rates soften demand – and, by extension, price increases – inflationary pressures may have already taken hold. The conventional wisdom has been to “look through” such supply shocks. But central banks can’t ignore potential knock-on effects. If higher inflation leads workers to demand higher wages, which feeds into broader price pressures, a temporary shock could become persistent. This is why we expect central banks to err on the side of caution in containing inflation.

The path depends on each central bank’s starting point. With inflation having tracked close to its 2% target in recent months and the labour market stable, the ECB finds itself in a stronger position to deal with an inflationary shock than in February 2022, when inflation was already at 6% and the labour market was tight. That recent history could keep the course of policy finely balanced between hiking and holding, with memories of surging inflation still fresh.

Assuming oil prices in a $90–$100 per barrel range and natural gas averaging €60/megawatt-hour for one to two quarters, we upgraded our 2026 ECB headline inflation forecast to 2.5% while lifting our forecast for core inflation – which excludes volatile food and energy prices – more modestly to 2.1%.

The BoE finds itself in more precarious territory. UK inflation has been above its 2% target for roughly five years. Core inflation remained above 3% in March 2026. Policymakers are still fighting the last battle even as a new one arrives. We recently downgraded our 2026 UK GDP forecast by 0.4 percentage points to 0.6%.

The US central bank has greater flexibility. As a net oil exporter, the US is experiencing a smaller shock overall. Higher oil prices hurt consumers but benefit domestic producers. While sticky services inflation and tariff pass-through create complications, the Fed can be patient. The dominant risk is that rates stay higher for longer, not that the Fed tightens policy.

The BoJ, meanwhile, is navigating upward price and policy normalisation rather than disinflation. Higher oil prices and yen weakness support that journey by lifting near-term inflation while strong wage growth underpins the broader normalisation narrative.

A reassertion of medium-term market dynamics

Stagflation is likely to be negative for both stocks and bonds. But assuming a limited duration for the Middle East conflict, we expect medium-term market dynamics to reassert themselves. We also continue to emphasise the potential for AI to be transformative and to spread its benefits throughout economies, as outlined in our 2026 annual outlook.

Market comment.

It took 15 years to recover from the last tech bubble

Investor’s Daily
brought to you by
Nickolai Hubble | June 5, 2026

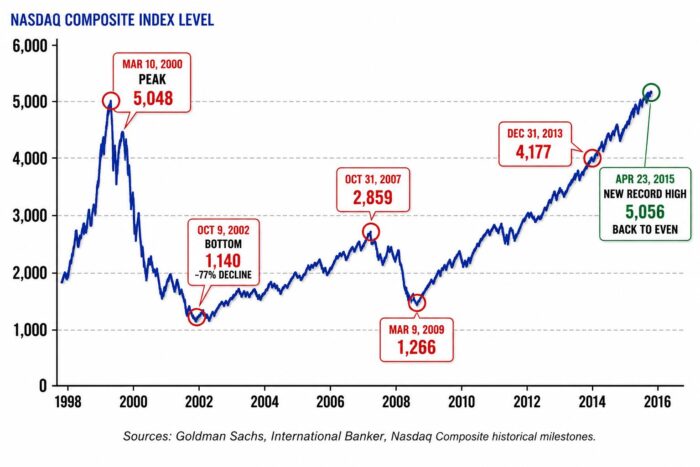
Nasdaq Composite Index Level

In March 2000, the dot-com bubble popped.

The companies were real… the technology was real and the internet turned out to be every bit as transformative as the believers said it would be…

But the revenues were not real… and that was enough.

It took 15 years for the market to fully recover.

A generation of investors who planned to retire in the early 2000s didn’t. They watched their portfolios collapse and went back to work.

Here’s the question worth sitting with today.

What actually makes AI different?

The technology is impressive. The potential is genuine. But when you follow the money — when you ask where the actual commercial revenue is coming from — the answer looks uncomfortably similar to the dot com era.

Microsoft has invested billions into OpenAI. OpenAI uses that money to buy computing power from Microsoft’s Azure platform. Microsoft books that as AI revenue.

The money circles back. The same capital, moving between two companies, being reported as proof that the AI boom is real.

In 2000, investors learned that “users” and “eyeballs” were not the same thing as revenue. The market had built trillion-dollar valuations on top of that confusion.

Right up until March 2000, the people buying believed the story. Build it and they will come. The valuations would be justified.

It never happened.

My colleague Jim Rickards believes we are in the AI version of that moment right now… and that by 26 August the AI Bubble will pop.

The SNOWBALL

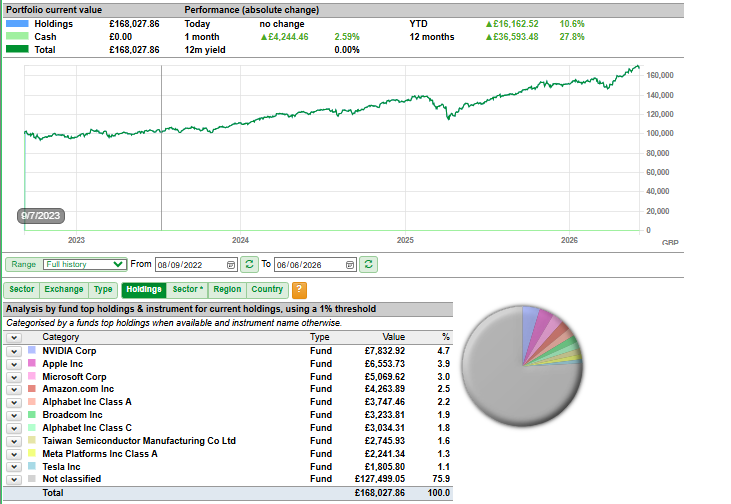
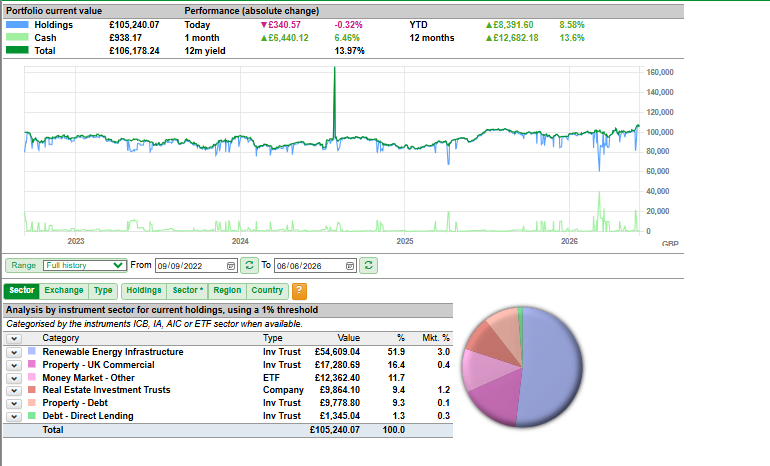
The SNOWBALL has a comparison share VWRP, the comparison being, you buy VWRP and forget about it until you enter drawdown, with the intention of using the 4% rule to fund your retirement.

The SNOWBALL

I don’t update this very often has it has little relevance to the plan as your Snowball should be different to the SNOWBALL has it reflects the years you have before you enter drawdown.

(Note the spike on the graph is a software glitch.)

The comparisons

VWRP £168,027

The SNOWBALL £106,178. There is around 1k of xd dividends but it makes no difference to the outcome.

The comparison that matters.

VWRP using the 4% rule would provided income of £6,721

The SNOWBALL current income is £12k.

This gap will continue to grow, especially has VWRP has had a period of out performance that is unlikely to be replicated.

The third option is to invest in VWRP with the intention of buying an annuity.

You have to surrender your capital but currently it would provide income of

£11,671.

The two know unknowns are what will your capital be when you enter drawdown and the annuity rate it could be………….

Canada Life figures show the 65-year-old with a £100,000 pension pot could buy an annuity linked to the retail price index (RPI) that would generate a starting annual income of £3,896. That’s up from £2,195 in the New Year following a 77% spike in rates this year.
Oct 22.

One huge gamble.

VWRP used as the example but there are very many other options to invest in.

Snapshot: ROC‑backed solar exposure

Snapshot: ROC‑backed solar exposure

VehicleROC solar exposureHow clear is it?Key evidence
NESF – NextEnergy Solar FundHighExplicitNamed UK sites with ROC banding (e.g. Barnby 5 MW, 1.2 ROC)
FSFL – Foresight Solar FundHighStrong but indirectTalks about UK “ROC‑backed solar portfolios” as valuation benchmarks; NAV sensitivity to ROC/FiT indexation
JLEN → FGEN – Foresight Environmental InfrastructureHigh (mixed tech)ExplicitSolar portfolio described as “older vintage assets with high value subsidy tariffs… Government‑backed incentives (ROC and FiT)”
TRIG – The Renewables Infrastructure GroupModerate / assumedImplied onlyUK solar parks with long‑term contracted, inflation‑linked revenues; ROC not named but very likely part of the mix for older UK solar

NESF – NextEnergy Solar Fund

  • Pure‑play solar, very ROC‑heavy.
  • 2024 annual report explicitly labels assets with ROC banding, e.g. Barnby, Nottinghamshire – 5.0 MW, 1.2 ROC.
  • Separate RNS on ROC/FiT indexation consultation confirms material exposure to both schemes.

Verdict: NESF is one of the cleanest ways to own a diversified book of UK ROC‑backed solar.

FSFL – Foresight Solar Fund

  • Large UK‑tilted solar portfolio; reports repeatedly reference ROC/FiT inflation indexation as a NAV driver.
  • 2023 results note that sales of large ROC‑backed UK solar portfolios are used as valuation benchmarks for FSFL’s own UK assets—strongly implying similar ROC‑backed characteristics.

Verdict: High probability that a big chunk of the UK book is ROC‑backed, even if each site’s banding isn’t spelled out in the headline text.

JLEN (now FGEN – Foresight Environmental Infrastructure)

  • FGEN’s solar page is very clear:
    • “Solar portfolio includes older vintage assets with high value subsidy tariffs.”
    • “Government‑backed incentives (ROC and FiT).”
  • Named projects (Amber, Branden, CSGH, Monksham, etc.) include explicit ROC accreditation levels (e.g. 2 ROCs, 1.6 ROCs, 1.4 ROCs).

Verdict: JLEN/FGEN absolutely owns ROC‑backed UK solar—though it’s a smaller sleeve within a broader environmental infra mix.

TRIG – The Renewables Infrastructure Group

  • TRIG runs a big, diversified portfolio (wind, solar, batteries) with ground‑mounted UK solar and “high proportion of contracted, inflation‑linked revenues.”
  • Given commissioning vintages and UK focus, it’s very likely that some UK solar parks are ROC‑backed, but public materials don’t explicitly label ROC banding the way NESF/FGEN do.

Verdict: Treat TRIG as ROC‑adjacent rather than a clean ROC solar play—great for diversified infra, less precise if you’re targeting ROC cashflows.

BSIF

The deal that woke up the solar sector

For all the latest breaking mid- and small-cap news.

 www.proactiveinvestors.co.uk

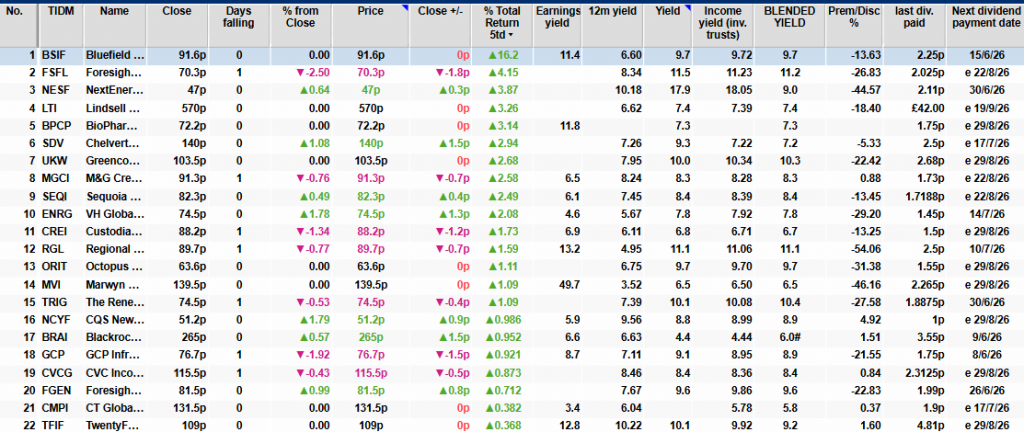
And finally, the agreed £548 million takeover of Bluefield Solar Income Fund by Drax Group has done something the sector has been waiting years for.

It has put a credible private market price tag on a listed renewable energy fund at a moment when the whole sector has been languishing at bargain-basement valuations.

The bid landed as funds like NextEnergy Solar and Foresight Solar were sitting at yawning discounts to net asset value, the legacy of rising interest rates since 2022 eroding the relative appeal of yield-generating infrastructure.

Both rose on the news, with Cavendish arguing the two funds, whose portfolios most closely resemble Bluefield’s in their concentration of ROC-backed UK solar assets, stood to benefit most from the valuation signal the deal provides.

Octopus Renewables Infrastructure Trust, Greencoat UK Wind and The Renewables Infrastructure Group also caught a lift, though all remain at substantial discounts, illustrating how much ground still needs to be recovered.

Perhaps the most encouraging element is Drax’s stated rationale: up to £2 billion of planned renewable investment by 2031, suggesting well-capitalised energy companies are willing to pay private market prices for assets the public market has persistently undervalued.

The SNOWBALL:KISS

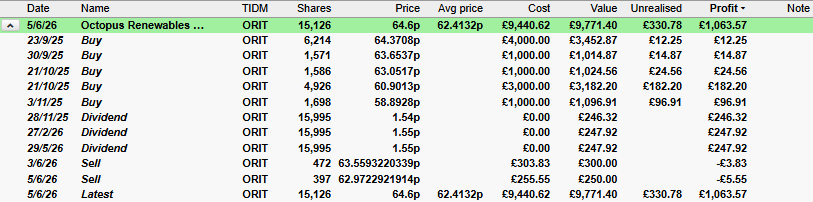
As you will note below, building a position here paid off, bought for the yield not for the price, if not, had the price risen, you could sell, book the profit and move on.

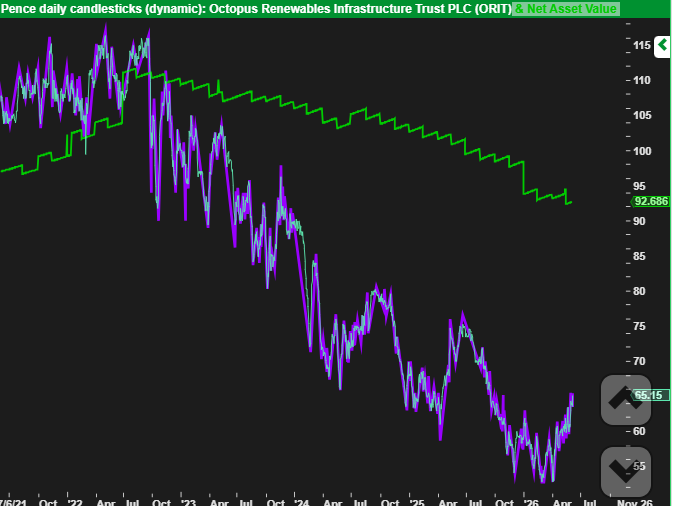
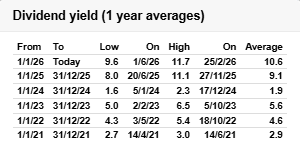
To understand the journey, you need to know the price history, the NAV, the dividend history and the latest price, easiest to follow in a chart.

The easiest ten percent to earn is the first ten percent and it’s also the easiest to lose.

The average buying price was 63p, the dividend 4.55p = 7.2%

The current expected dividends 6.2p current price, current price 65p = 9.6%

Discount to NAV 31%, so a strong hold, with the intention of taking any profits if they arrive.

Current profit £1,063, which you will see mainly from dividends earned and already has been re-invested, earning more dividends. If bad news hits the share the price could fall and take away all the profit and the dividends. Remember if you trade you will buy a clunker, how you deal with clunkers will determine how sucessful your are.

« Older posts Newer posts »

© 2026 Passive Income Live

Theme by Anders NorenUp ↑