SEIT again Sam, play it again Sam
FY2026 results analysis
The Oak Bloke
Jun 27
SEIT again Sam, play it again Sam – The Oak Bloke
Dear reader,
The same picture appeared appropriate. What Bomb? Just a little flag with the word BOOM. This is an interesting factoid from SEIT’s from the 2025 AR.

Back then, when SEIT’s share price was 50p-60p per share the investment hurdle was to achieve at least a 16.5% IRR, implying those investments were (at least) intended to delivered levels of return equivalent to 36% or more (at today’s 33.6p share price)
Meanwhile the FY26 results aren’t altogether pretty, where a 90.6p NAV in FY25 became 77.8p NAV in FY26. That was the headline, and detractors loudly chortled at news of a 12.8p per share reduction. That NAV movement is comparing 12 months. At the interim results the NAV was 87.6p a share to it’s actually a -10.2p result in the six months to March 2026, or a -8.6p result excluding the effect of dividends.
Co-incidentally, I actually forecast a -5.8p per share loss through Onyx plus -2.8p company expenses (-8.6p a share) in my last article on SEIT.
Although I believed Inflation would have a positive effect to offset that based on the FY25 sensitivity chart. That effect proved to be the case, but at +0.3p per share it was far less than I had expected. Far less than the sensitivity appeared to guide.
The actual EPS for FY26 was -8.1p per share made up of -6.1p of portfolio movements, +0.3p of macro changes, +1.1p of hedging gains and -0.8p of FX portfolio movements, -0.9p of expenses and -1.7p a share RCF interest.
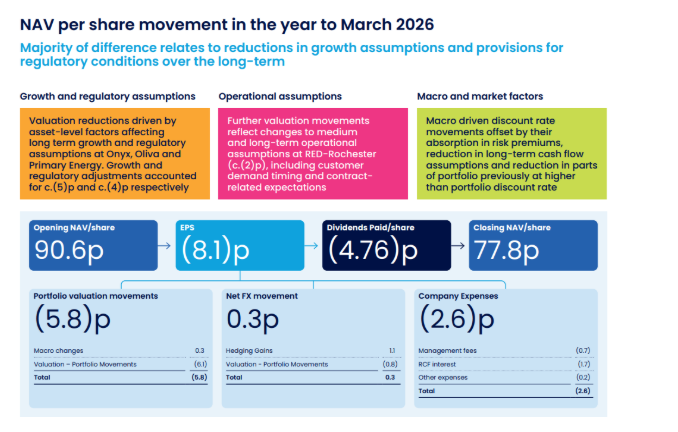
Where the -6.1p of portfolio movements is actually a -12.8p share portfolio loss offset by 4.8p of dividend and interest income for the year.
Note 3 gives details of details of some of these 12.8p a share losses, but it covers £61m of losses with £22.8m left unaccounted for. Onyx accounts for -4.15p and is no surprise – given the slow down in its growth.
But Oliva’s subsidies being stiffed by the Spanish government in 2026 and losing -2.3p a share valuation as a result is a surprise, while other write downs of nearly -6p a share are events which haven’t happened but SEIT are assuming they shall. So arguably the real loss for FY26 is just minus -2p – net of income.
That’s Net Income of 4.8p a share offset by known FV losses of -6.8p a share. Where potential ones of 6p have been assumed shall happen in the future, so let’s kitchen sink them.
In other words if Glencore do deploy their Li-Cycle site in 2026 or 2027, if the delays at Red Rochester by 2028 do not transpire, and if the Ohio Renewable Energy Certificates do not in fact expire in 2027 then SEIT has an easy 6p gain per share ahead of it.
On top of anticipated gains discussed below.
CASH
Of course there were negatives in the results. One I picked up on was the lower £84m investment cash inflow, down -£13m yoy. This included £40.2m capital returns from Onyx implying dividends and interest payments from holdings to TopCo were £43.8m in FY26.
This nearly marries with the operating cash flows of £45.6m (the £1.8m difference is the movement in the holdco interco balance I think). But given 1H26 was £31.4m that implies just £12.4m of operating cashflow in 2H26. That’s not great. WHY?
We are told due to re-investment and debt service. But project Level Debt barely changed in 2H26, so it wasn’t to make project-level debt principal paydowns, so it’s likely to be a timing issue for interest payments. The Project Debt levels appear to remain quite static but are muddied by the RCF being used to fund Onyx and Primary in prior periods, so I’m assuming Project Debt at Onyx particularly, in FY25 was included from the RCF.
ZOOD and Capshare add a further £29m project debt in FY26
A decent amount of £54.7m was re-invested in FY26, and although that figure appears much smaller than the invested amount of £173m in the prior year. However when you consider the large disposal proceeds in FY25, the amount is actually about the same net of disposals in both years.
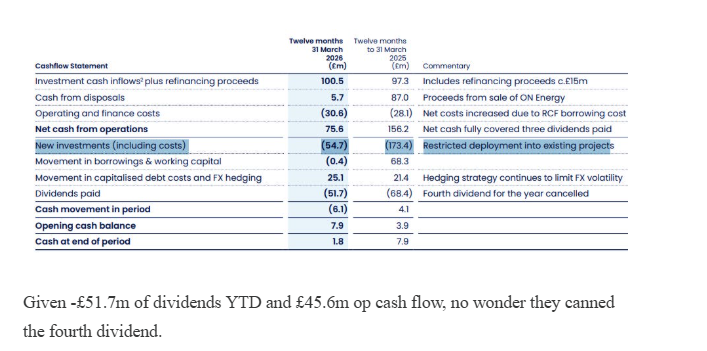
£100.5m includes £15m of refinancing and £40m of capital repayments from Onyx. That gets us back to and reconciles with £45.6mm of operating cash flow. You see the accounts are quite easy to understand once you get to know them.
Given -£51.7m of dividends YTD and £45.6m op cash flow, no wonder they canned the fourth dividend.
SEIT blamed “bad timing”.
Pull the other one muttered detractors.
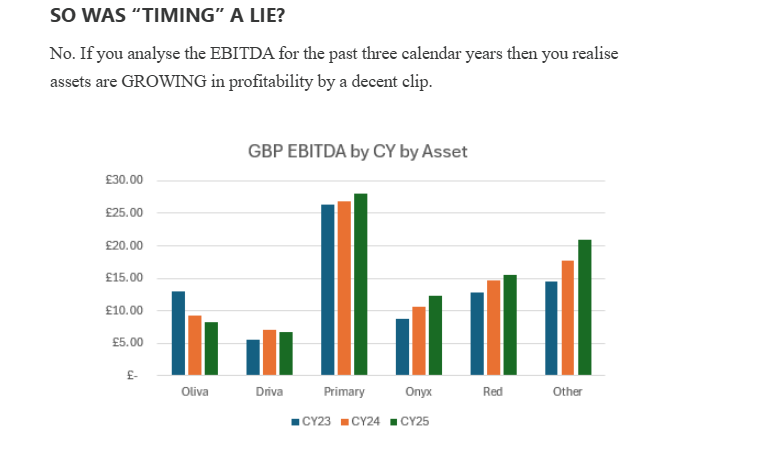
By about 8% per year.
Has ITDA changed?
Interest costs – yes. (I’m using the FY year end debt figures as a proxy for the calendar year so there’s a 3 month timing difference here)
So overall, no growing NET profits but a solid £50m income return per year (albeit an EBDA number) where you’re paying 7.5X for that net income. (ignoring FV gains and losses) and paying half of what you’d have paid a year ago.
Wait, what?
1 Red Rochester
EV/EBITDA was 20X so slightly below the 19.2X budgeted. It had new customers during the year and others expanding their energy use.
The outlook is centred on maintaining stable operational performance, embedding the benefits of the in-house management transition and on active customer engagement and execution of a few existing approved capital projects.
Growth is expected to be driven by incremental customer additions and expansions within Eastman Business Park. While several customer opportunities are advancing (including data centre prospects), uncertainty remains and outcomes will be dependent on customer timing, customer agreements, capital availability and broader market conditions.
The upgrade of air compressor systems at Kings Landing to reduce parasitic load and lower ongoing energy consumption at site will deliver “meaningful savings” in FY27 too.
2 Onyx
It continues amuse me that some claim SEIT would have “great difficulty” selling its assets at a decent price. Today’s headlines is that EDF has just sold $4.6bn of renewable assets to KKR.
Can Onyx and SEIT also sell energy assets during an AI Boom? I’m not even answering that.
$9.5m EBITDA for CY25. Big deal? That’s 20% below budget chortle detractors.
The hugely significant element of the FY26 disclosures was the operational element of the project equity. Just 35% of the total.
On the assumption that 100% of the project debt is operational (obviously if only 35% is then the future EBITDA is massively higher – but let’s assume not) then using the 2H26 EBITDA number you get to a run rate of $21.2m which would really be above the budget considering just the operational element of the project equity (of $128m).
We see steadily growing profits from Onyx period by period.
The CY25 target according to the FY2025 AR was 100 MW so 103 MW is above target in CY25. We see the pace slow in 2026 with 57 MW at notice to proceed (NTP) and 50 MW of new PPAs signed.
That’s the reason for the reduction in the NAV.
Focus on credit quality and optimising profit is prioritised over growth we are told in 2026. To quote a detractor who in the past invested in Ecofin and lost his money – and who mistakenly believes Onyx’s high-margin C&I are no better than the low-margin US solar parks he invested in.
The fact is in 2026 Onyx is turning down Walmart rather than get the sale at any price. And in any case a PPA IS a fixed price structure!
Onyx trebles its pace of project delivery in CY25:
Based on 209MW COD (being operational) as at 31/12/25 that implies 597MW total projects are underway (i.e. once all current projects are energised) so there remains 388MW of projects to follow – and then after that a further, slower growth from here.
A buyer could re-accelerate that rate of expansion if they wished.
Even the existing projects represent at least a tripling of EBITDA from here based on only achieving the same level of performance. The pace of activations tripled in CY25 vs CY24, 103MW energised vs 30MW in CY24.
114MW was operational as at 31/12/24 and generated 132.9 GWh in 2024 vs 145.1GWh in 2025. That means each MW generated 1,165 hours of MWh in 2024, on average, but that fell to 694 hours of MWh in 2025. A -35% reduction per MW. Why?
8% of the revenue model is asset management fees, with 5% from EPC (installation fees) and 2.5% from asset sales (buy outs of projects).
The other 84% of revenue comes from PPAs and energy credits.
So the reduction in generation hours must be due to underperformance of operational projects. When questioned SEIT explained revenue timings was a large factor, any many assets were energised late in the calendar year. That means the year end number will become the run rate number in 2026 and we can expect a large number. The weather is also blamed – and that’s far less easy to control however it also is driven by the quality of the asset management. If the panels are dusty then clean them quickly.
SEIT admit to continuing challenges with “site-specific issues” too. To tackle this Onyx introduced “GEM”, an acronym that reflects Onyx’s commitment to best-in-class quality. Short for “Great Expectations Met,” GEM guides how Onyx operates, shaping its processes, practices, and customer engagements to deliver reliable energy, rigorous asset care, exceptional service, and a culture of continuous improvement.
Onyx continues to embed a portfolio-wide quality and operational management framework. This includes enhanced construction quality controls, the use of tier one equipment with market standard warranties and standardised operating and maintenance procedures. Preferred contractors and OEM-approved repair processes are used across sites, with performance monitored through improved data and analytics tools.
What is certainly remarkable is the improvement to profitability per MWh of energy generated. $177.73 (which is 59,640 MWh in CY 2H25 and $10.6m of EBITDA profit)
EBITDA Profit per MWh at Onyx for the past two years
The $10.6m EBITDA profit growth in 2H26 for Onyx can’t help leaving you feeling more optimistic about Onyx…..
What will this grow to in FY27?
3 Primary
Despite Cleveland Cliffs producing more steel and American Steel being bought by Nippon Steel this did not translate into vastly more profits for Primary – yet. Nevertheless Primary exceeded budget by 3%. It reduced its debt by £8m from £121m to £113m in the year to 31/3/26.
With $2m upside of projects being commissioned in FY27 and its PCI contract renewed for a further five years there are reasons to feel positive. Installation of variable frequency drives and new fan motors to reduce continuous parasitic electrical load from induced draft fans on generation processes will improve profits by +$1.5m a year, while installation of a control valve on the steam turbine extraction line to reduce excess feedwater heating, freeing steam for additional electrical generation will add +$0.4m revenue a year.
As a negative the NAV was reduced by Ohio State REC credits which might not be extended past 2026. The reduction assumes they don’t. The reduction also assumes there are no alternative markets for the REC credits – outside Ohio.
Meanwhile Primary has actually applied for more REC credits (for Steam energy). Nothing is in the price for this so what was a NAV cut back could be a double bubble add back in FY27.
In any case until CY 2H25 Primary has increased in value over the past two years, but receives a -$25m negative downgrade in these latest results, alongside four of the top five assets:
Asset fair value gains and losses period by CY period (and in local currency)
4 Driva
Driva performed ahead of expectations (14% ahead of budget) despite higher customer churn – and was revalued upwards as seen above.
Driva manages a gas grid in Stockholm extending roughly 540km, backed by a 200-tonne storage terminal at Högdalen (boasting 100MW of regasification capacity) and a 40-tonne backup facility at Frihamnen.
Rather than distributing the contents of an LNG tanker Driva distributes 88% locally produced renewable biogas, primarily sourced from the city’s wastewater treatment facilities. Poop poop. This aligns directly with Stockholm’s regional strategy to hit carbon neutrality by 2040, and therefore is a key asset to the Swedish government. In FY26 it launched an energy-as-a-service arm achieving a number of wins during the year:
— Biogas‑as‑a‑Service (“BaaS”) project at Arvid Nordqvist in the first half of 2025, enabling biogas to be used in the roasting of coffee beans;
— ten Charger‑as‑a‑Service (“CaaS”) sites reaching operation, of which eight were associated with bus depots;
— one new Solar‑as‑a‑Service (“SaaS”) project achieving operations early in the year;
— 14 Heating‑as‑a‑Service (“HaaS”) projects becoming operational during the year.
5 Oliva
The hidden value is the Spanish electricity market. Bit jagged?
Quite why they didn’t do this years ago is beyond me but someone twigged that Oliva can deliver base-load electrical power and ancillary services began in July 2025. The upside to this strategy is dampened by its hedging strategy. Less risky that way.
The effect is obvious with profits more than tripling in 2H26, helped along by a better harvest of Olives too.
EBITDA Profits in Euro Millions
This is further reflected in its EBITDA per MWh of generation (NB we don’t know the heat/electricity split)
So leaving aside the exceptional CY23 result buoyed by the post Ukraine energy price surge in Europe Oliva is delivering a steady result where the CY25 hides a much stronger second half and outlook for CY2026.
We see a growing result in 2H26 to 31/3/26.
And that’s largely driven by simply getting better prices per MWh.
Valuation Thoughts:
The results are not a slam dunk but they never are. Victories are hard won and setbacks are always around the corner.
The -50% drop appears to be unjustified.
The cautious approach to kitchen sinking 6p of FV losses for events that haven’t even happened and might never happen is certainly one way to prepare for the worst. I thought the SEIT investment management team in their presentation of the FY26 results appeared to have the look of an embattled and frustrated group.
The FY26 results on the face of things allow people to say “told you so”. The headline is a -12.8p loss
Scratch beneath the surface and there’s more to it – in my opinion.
If you strip out the “noise” and focus on its PHYSICAL income/distributions, on today’s 35p share price SEIT consistently delivered a 12.5% yield net of fund expenses and adjustments. (4p per share vs a 35p share). Also those are post-leverage distributions, so net of project debt servicing and amortisation.
This is a Pence Per Share analysis where 5p a year less fund costs delivers 4p a year a 12.5% gross yield to today’s 35p share price
The top 5 assets appear to offer upside to their income capabilities in FY27.
Fund expenses have now been reduced, and RCF interest will reduce too. Post period a sale of Kyotherm assets has reduced the RCF by £45m to c.£190m, with another £40m of cash being held on the balance sheet.
Loss of income from Kyotherm was around 20% of EBITDA (£91m was pro-forma £72m) but EBITDA growth particularly from Onyx should at least partly offset this in FY27.
The RCF equates to about 17.5p per share so income eventually pays it down although the sale of any of the top 5 assets will speed that greatly.
Considering the NAV
Let’s not forget that while SEIT didn’t load the discount rate any higher 9.5% remains an eyewatering level to discount future income by in arriving at valuations. It’s not as though these are being valued at ~8% like NESF, TRIG, and Greencoat UKW.
That’s £100m’s wiped out the NAV simply by discounting everything severely.
Let’s also not forget there’s 6p per share of assumed losses built into that £740m NAV ….that’s about £60m of losses that have not even happened – yet.
SEIT assume £60m of losses for “might happen” stuff
Where the assets are largely achieving their targeted performance:
And where the amortising project debt is at undemanding interest rate and is largely fixed or hedged.
Let’s also consider history. Historically SEIT has disposed of assets at a premium or at a small discount. There’s an AI boom after all?
And EV/EBITDA multiples for Green Energy are heading up say Finerva…. meaning sales are potentially much higher than the past year or so.
And Energy prices including electricity prices are up everywhere not least in the USA.
HAIRCUT TIME?
As the chart above shows, there appears to be a large margin of safety, where asset sales into the realm of ‘alf price guv’nor would be catastrophic and drop the SEIT share price into the high 20p’s…. But anything short of that and there’s upside to 35p a share…. IMO.
AND THAT NAV RETURN ASSUMES NOTHING FOR INCOME WHICH IS 22% per annum or more – on paper – and £50m out of £380m market cap (12.5% yield) in practice.
Conclusion
Personally I was backing up the truck at 32p and I could not believe my luck. Has the actual results mirrored my “SEIT is half full”? Not precisely, but broadly, yes. No great profit warning. A lot of kitchen sinking and a punishing discount rate. My “official” position is this is part of the OB 25 for 25 ideas and I’m in for 42.6p.
It’s my view that there’s clear upside from here and this article sets out why. Will it require patience? Yes, but I think some pleasant surprises are lurking. I don’t believe the asset market is as sclerotic as in past years. Also remember SEIT are not selling a “partnership” into things like Onyx as they did last year – they are now selling a going concern…………………………
SEIT again Sam, play it again Sam – The Oak Bloke

SEIT sold from the SNOWBALL at a loss when the dividend was cut.

Leave a Reply