
There are two conflicting views of markets.
How Does the Stock Market React to Interest Rate Cuts?
Below, we show how the S&P 500 has performed after the first rate cut over the last five decades:
| Year of first rate cut | Three months | Six months | One year after |
|---|---|---|---|
| 1973 | -10.2% | -6.2% | -36.0% |
| 1974 | -14.7% | -15.3% | +7.5% |
| 1980 | +15.0% | +28.9% | +30.3% |
| 1981 | -11.0% | -7.9% | -17.8% |
| 1982 | -4.8% | +17.4% | +36.5% |
| 1984 | -1.2% | +7.2% | +10.5% |
| 1987 | +0.1% | +1.7% | +7.5% |
| 1989 | +7.4% | +7.5% | +11.9% |
| 1995 | +5.1% | +8.0% | +13.4% |
| 1998 | +17.2% | +26.5% | +27.3% |
| 2001 | -16.3% | -12.4% | -14.9% |
| 2007 | -4.4% | -11.8% | -27.2% |
| 2019 | +3.8% | +13.3% | +14.5% |
| Average | -1.1% | +4.4% | +4.9% |
Historically, the S&P 500 returns 4.9% on average one year after the first interest rate cut, seeing positive returns nearly 70% of the time.
In the three months following a rate cut, the market often dips, but typically rebounds by the six-month mark. This aligns with conventional wisdom that lower interest rates stimulate economic activity by reducing borrowing costs for businesses and consumers, which tends to benefit the stock market.
However, S&P 500 performance following rate cut cycles can vary significantly. For instance, U.S. equities saw double-digit declines after the first rate cuts in 1973, 1981, 2001, and 2007. On the other hand, the S&P 500 surged 36.5% one year after the 1982 rate cut cycle. In the most recent rate cut cycle, the S&P 500 jumped by 14.5% in the following year.
In this way, interest rate cuts don’t show the whole picture. Instead, positive earnings growth may offer a more reliable indicator of S&P 500 performance in the following year. When earnings growth is positive, the market averages 14% returns one year after. In contrast, when earnings decline during periods of falling interest rates, the S&P 500 increased by 7%, on average.
Veroni App

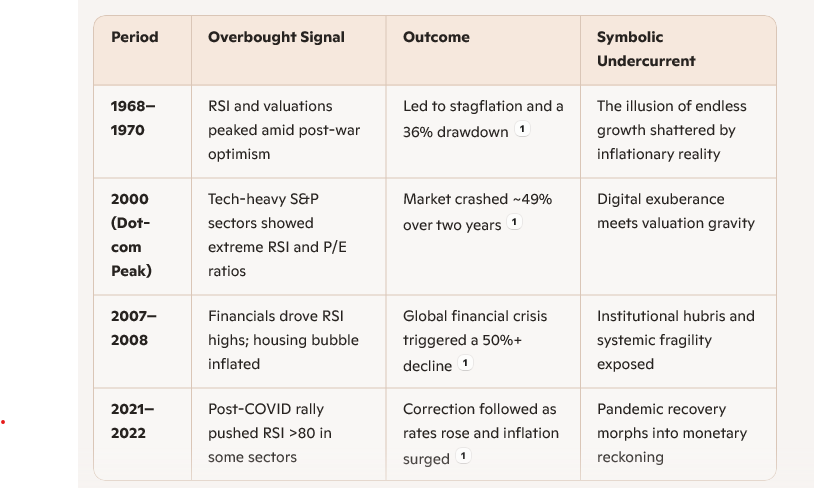
📈 Yes, the S&P 500 is showing signs of being overbought as of mid-September 2025.
Here’s what’s happening:
- 14-day RSI peaked at 76 in July, which is well above the typical overbought threshold of 70.
- Market breadth is narrowing—only a small group of large-cap stocks (especially the “Magnificent Seven”) are driving the rally, while broader participation has faded.
- Volatility risks are rising, with technical analysts warning of a potential correction due to systemic overvaluation and divergence from equal-weighted indices.
Even though the index is hovering near all-time highs, the underlying structure looks fragile. It’s a classic setup where enthusiasm can quickly flip to caution. If you’re tracking this for historical parallels or symbolic storytelling, it’s a textbook case of exuberance masking imbalance.
Narrowing Market Breadth and Rising Overbought Conditions in the S&P 500: A Warning Signal for Investors?
Henry RiversTuesday, Sep 9, 2025
– S&P 500’s recent gains show growing divergence from broader market breadth, with 80% of stocks above 50-day averages in May 2025 but narrowing participation by September.
– Overbought conditions intensified as 20% of S&P 500 stocks entered overbought territory, with RSI peaking at 76 and WealthUmbrella Margin Risk hitting extreme 13-level readings.
– Persistent divergence between index performance and equal-weighted indices/small-cap laggards signals structural fragility, historically preceding market corrections.
– Magnificent Seven dominance and systemic overvaluation create volatility risks, urging investors to adopt defensive strategies amid mixed economic signals and Fed policy uncertainty.
The S&P 500 has long been a barometer of U.S. equity health, but recent data suggests a growing disconnect between the index’s performance and the broader market. Investors are increasingly scrutinizing narrowing market breadth and systemic overbought conditions, which together may signal a heightened risk of a near-term correction.
Market Breadth: A Tale of Two Rallies
Market breadth, as measured by the Advance/Decline Line (AD Line), has been a mixed bag in 2025. In late 2024, the AD Line plummeted despite the S&P 500’s resilience, a classic bearish divergence that signalled weak participation and reliance on a narrow group of large-cap stocks, particularly the “Magnificent Seven” S&P 500 Forecast: Correction Signs & 2025 Buy Levels[2]. This trend persisted into early 2025, with high uncertainty over policy shifts like tariffs exacerbating the imbalance S&P 500 Forecast: Correction Signs & 2025 Buy Levels[2].
However, a more recent rebound in mid-2025 offered a glimmer of hope. By April–June 2025, the AD Line surged to a 2-year high, outpacing the S&P 500’s recovery and suggesting broader participation as stocks rebounded from oversold conditions S&P 500 Nears Record Highs: Key Market Drivers Explained[3]. By late May, 80% of S&P 500 stocks were trading above their 50-day moving averages, a robust sign of sector-wide strength US Stocks Watchlist – 5 September 2025[4]. Yet, this optimism has since dimmed. As of September 2025, the AD Line has flattened while the S&P 500 continues to climb, raising concerns about sustainability S&P 500 Forecast: Correction Signs & 2025 Buy Levels[2].
Overbought Conditions: A Volatility Time Bomb
The S&P 500’s recent rally has pushed it into overbought territory, with its 14-day RSI peaking at 76 in July 2025 US Stocks Watchlist – 5 September 2025[4]. While the index has since retreated slightly, technical analysts warn that the market remains vulnerable. The WealthUmbrella Margin Risk Indicator, a rare tool for gauging systemic overbought/oversold levels, hit an extreme reading of 13 in late 2025—a level historically associated with trend reversals Is the S&P 500 Overdue for a Correction? 2025 Forecast & …[1].
Compounding the risk is the fact that one in five S&P 500 stocks has entered overbought territory, with financials and industrials joining the tech sector in this precarious position S&P 500 Nears Record Highs: Key Market Drivers Explained[3]. This widespread overbought condition, combined with valuations at “nosebleed” levels, creates a volatile backdrop S&P 500 Nears Record Highs: Key Market Drivers Explained[3].
Divergence and the Path to a Correction
The most alarming signal is the persistent divergence between the S&P 500 and breadth indicators. While the index hit record highs in September 2025, the Equal-Weighted S&P 500, small-cap indices, and semiconductors lagged behind Is the S&P 500 Overdue for a Correction? 2025 Forecast & …[6]. This lack of confirmation from key sectors is statistically rare and historically precedes corrections S&P 500 Forecast: Correction Signs & 2025 Buy Levels[2].
Moreover, the AD Line’s recent bearish tendencies—despite a brief rally in Q2—suggest fragility. If the AD Line continues to decline while the S&P 500 rises, it could signal a loss of momentum Market Breadth: What it is, why it matters, common …[5]. Conversely, if the index experiences new lows while breadth metrics improve, it might hint at a reversal Is the S&P 500 Overdue for a Correction? 2025 Forecast & …[1].
Conclusion: Caution in a Narrowing Market
The S&P 500’s current trajectory is a double-edged sword. On one hand, the mid-2025 rally demonstrated broad-based strength, with 67.87% of stocks trading above their 50-day averages in September US Stocks Watchlist – 5 September 2025[4]. On the other, the reliance on a handful of mega-cap stocks and systemic overbought conditions paints a cautionary picture.
Investors should remain vigilant. While the market’s technical setup does not guarantee a correction, the combination of narrowing breadth, overbought momentum, and divergent sector performance warrants a defensive stance. As the Federal Reserve pauses monetary policy and economic signals remain mixed, the coming months will test whether this rally is a durable recovery or a prelude to a pullback.
Magnificent site. Plenty of useful info here. I am sending it to some friends ans also sharing in delicious. And certainly, thanks for your sweat!
I just couldn’t depart your web site prior to suggesting that I extremely enjoyed the standard info a person provide for your visitors? Is gonna be back often to check up on new posts
Thank you, I have been seeking for facts about this topic for ages and yours is the best I have found so far.
Everyone loves what you guys are up too. This kind of clever work and coverage! Keep up the great works guys I’ve you guys to my own blogroll.
I?ve read several good stuff here. Definitely worth bookmarking for revisiting. I surprise how much effort you put to create such a fantastic informative web site.
A person essentially help to make seriously articles I would state. This is the very first time I frequented your web page and thus far? I amazed with the research you made to create this particular publish extraordinary. Wonderful job!
You should participate in a contest for top-of-the-line blogs on the web. I’ll suggest this website!
whoah this blog is magnificent i love reading your articles. Keep up the good work! You know, many people are looking around for this information, you can help them greatly.
Hi! This is my first comment here so I just wanted to give a quick shout out and tell you I truly enjoy reading through your blog posts. Can you suggest any other blogs/websites/forums that cover the same topics? Thanks a lot!
Greetings from Idaho! I’m bored at work so I decided to browse your website on my iphone during lunch break. I really like the info you present here and can’t wait to take a look when I get home. I’m shocked at how fast your blog loaded on my mobile .. I’m not even using WIFI, just 3G .. Anyhow, very good blog!
Hey There. I found your weblog using msn. That is an extremely neatly written article. I?ll make sure to bookmark it and return to read extra of your useful information. Thank you for the post. I?ll definitely return.
Thanks for another excellent article. Where else could anybody get that type of info in such an ideal way of writing? I’ve a presentation next week, and I’m on the look for such info.
This article is a refreshing change! The author’s unique perspective and thoughtful analysis have made this a truly engrossing read. I’m appreciative for the effort she has put into producing such an educational and thought-provoking piece. Thank you, author, for sharing your knowledge and sparking meaningful discussions through your exceptional writing!
Wow, incredible weblog format! How lengthy have you been running a blog for? you made blogging glance easy. The total look of your web site is magnificent, let alone the content!
I just added this weblog to my rss reader, great stuff. Can’t get enough!
What?s Happening i am new to this, I stumbled upon this I’ve found It absolutely helpful and it has aided me out loads. I hope to contribute & aid other users like its aided me. Good job.
We are a bunch of volunteers and opening a new scheme in our community. Your web site provided us with helpful information to work on. You’ve performed an impressive job and our whole group will be thankful to you.
Hey There. I found your blog using msn. This is an extremely well written article. I will make sure to bookmark it and return to read more of your useful information. Thanks for the post. I will definitely comeback.
Excellent post but I was wanting to know if you could write a litte more on this subject? I’d be very thankful if you could elaborate a little bit more. Many thanks!