Second Largest Negative Signal Of 2026: Bubbles, Barrels, And Skew
Jul 26, 2026, 6:13 AM ETS&P 500 Index (SP500), SPX, DJI, NDX, SPY, DIA, QQQ, IVV, VOO, IWMAAPL, MSFT, AMZN, META, SKHY, GDXU, KORU, SOXL, MU, INTC, ZMET:CA, ZMIC:CA, ZINT:CA, ZMSF:CA, ZAAP:CA, MU:CA, MSFT:CA, META:CA, INTC:CA, AMZN:CA, AAPL:CA

JD Henning
Investing Group Leader
Summary
- Market timing is critical; current momentum gauges signal elevated risk and negative flows since the July 10th S&P 500 high.
- Semiconductor sector, including SOXL and MU, shows classic topping patterns with steep declines despite record earnings, raising valuation concerns.
- Oil price volatility and geopolitical events are driving inflation and increasing pressure on the Fed for a possible rate hike.
- Extreme S&P 500 PEG ratios and high leverage signal caution; proven value and momentum models, along with timing indicators, are essential for capital preservation.
- The Federal Reserve rate decision and guidance this week will be key as pressure rises to hike rates again and 751 stocks report earnings including Apple and Microsoft.
- This idea was discussed in more depth with members of my private investing community, Value & Momentum Breakouts.

Introduction
As “bandwagon” investors join any party, they create their own truth – for a while. ~ Warren Buffett
Timing matters, and it matters greatly. I have spent the last 35 years trading, researching, and constructing algorithms to identify and leverage the value across fundamental, technical, and behavioral finance models. Of the ten portfolio models designed for optimal portfolio mixes for members to beat the market at Value & Momentum Breakouts, eight come from enhancing well-tested anomaly research in published financial journals. All of the models continue to outperform the S&P 500 in live forward testing for nearly 10 years here on Seeking Alpha, and again this year.
The 2nd Negative Signal of the Year
Readers who follow my Momentum Gauge indicators know well that timing matters and protecting your capital is a valuable way to preserve time on your way to building wealth.
On the weekly S&P 500 gauges we have gone through 3 weeks of negative signals from the July 10th market high down a modest -2.41% so far. The three prior negative signals on the weekly chart back to February 2025 saw declines of:
- Feb 28 to Apr 25: S&P 500 declined -9.69%
- Nov 14 to Nov 21: S&P 500 declined -2.72%
- Jan 30 to Apr 2: S&P 500 declined -6.53%

Even prior to the signal, you can see the positive momentum has been declining for past 8 weeks in an early indicator that outflows from the market are increasing as investors become more cautious. For context, the two strongest positive signals occurred back in April 2025 when the tariff tantrum abated on news that many tariffs would be withdrawn and in April 2026 when it was announced Iran had agreed to a ceasefire. That ceasefire ended back on July 6th and the gauges subsequently turned negative again.
Bubbles, Barrels, And Skew
As we begin the third quarter of 2026 we have already seen some major patterns that are likely to continue the whipsaws across different sectors and investment portfolios. 751 stocks are reporting earnings next week including Apple (AAPL), Microsoft (MSFT), Amazon (AMZN), Meta Platforms (META), SK hynix (SKHY) representing over $14 trillion in market cap. Additionally the Federal Reserve meets on Wednesday for their last rate decision until September and pressure is mounting for another hike. This is likely to be a volatile week.
I. Bubbles
Sometimes bubbles leak and sometimes they pop. One of technical indicators of bubbles is that they eventually return to pre-hype price levels where nearly everyone finally agrees the massive gains were part of shorter term overpricing anomaly. One of the most popular charts in circulation shows some of the sensational market bubbles in history.
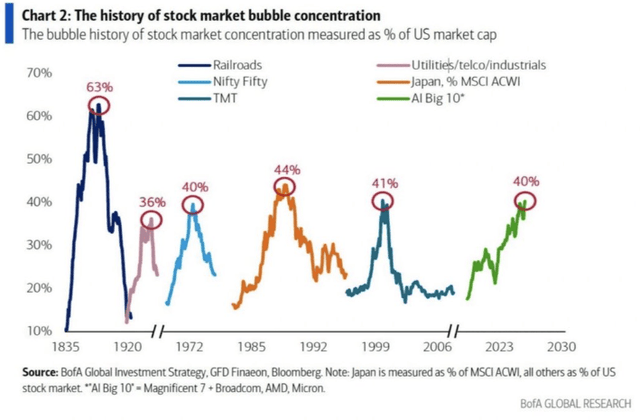
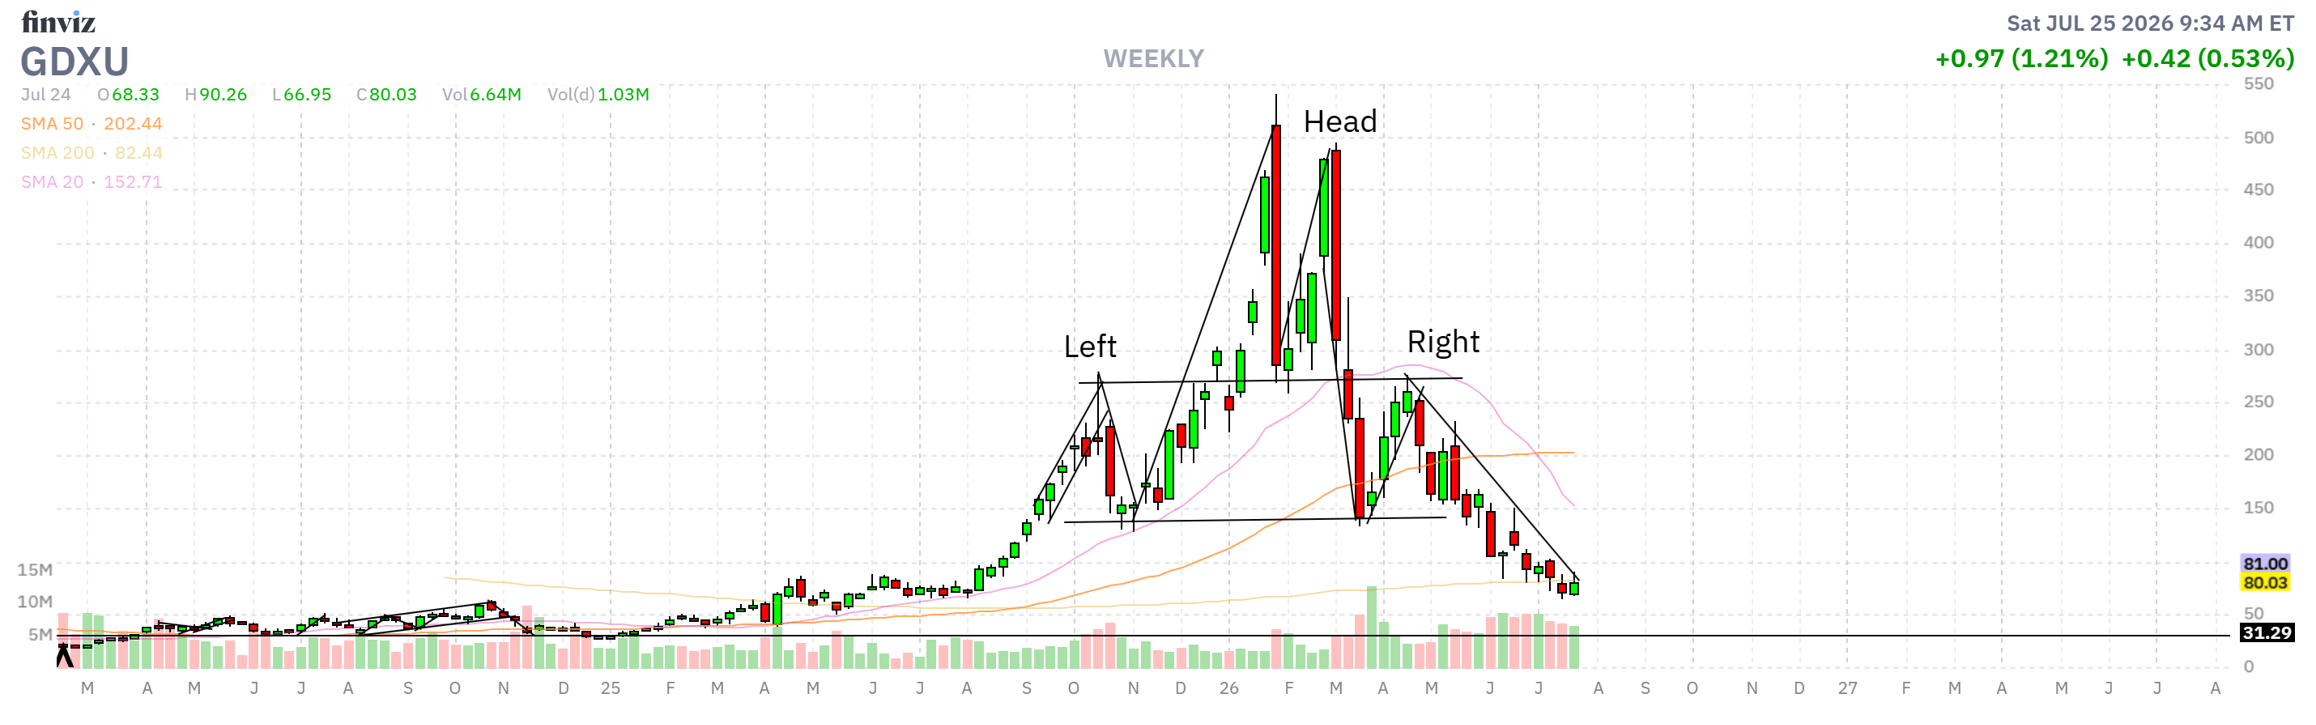
Just this year we have seen some incredibly large bubble moves. Take for example Gold as shown in the MicroSectors Gold Miners ETN (GDXU) weekly chart below. Back in January as Gold prices touched on all time highs above $5,500/oz, headlines announced “the end of fiat currencies” and a clarion call for “everyone to get into gold now!”
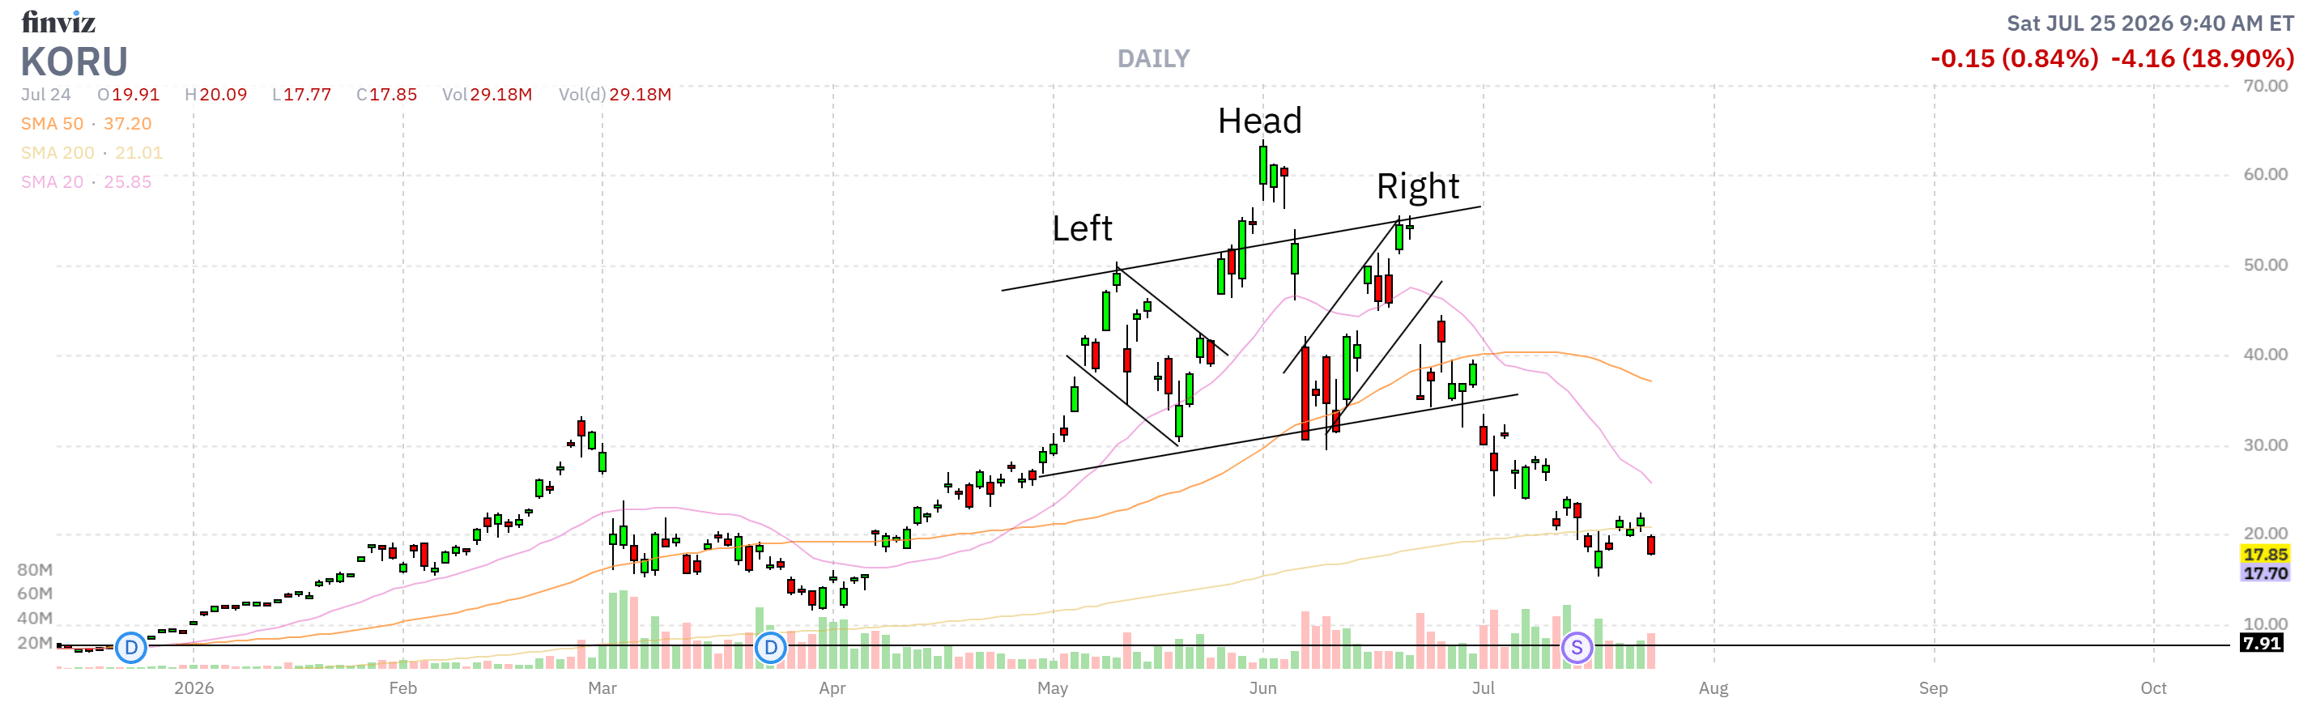
More recently we have seen this classic Head/Shoulder topping pattern emerge in the South Korean market represented by Direxion Daily MSCI South Korea Bull 3x ETF (KORU) with over 40% of its holdings in SK hynix (SKHY) and Samsung Electronics (SSNLF) stock. Tragically, many investors are down nearly -72.1% from the June 1st high.
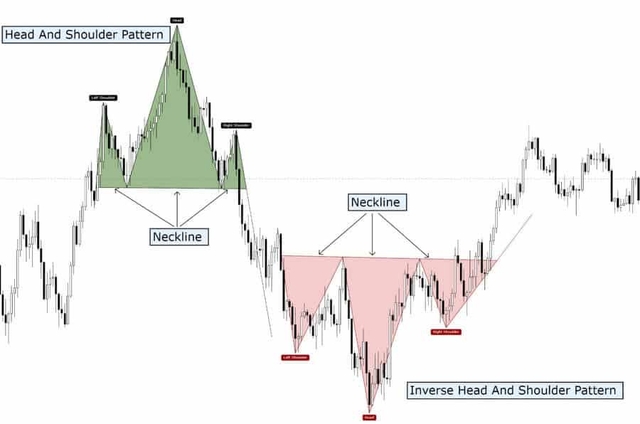
A illustrative primer on the classic technical pattern of Head and Shoulders is shown below for both bullish and bearish indicators.
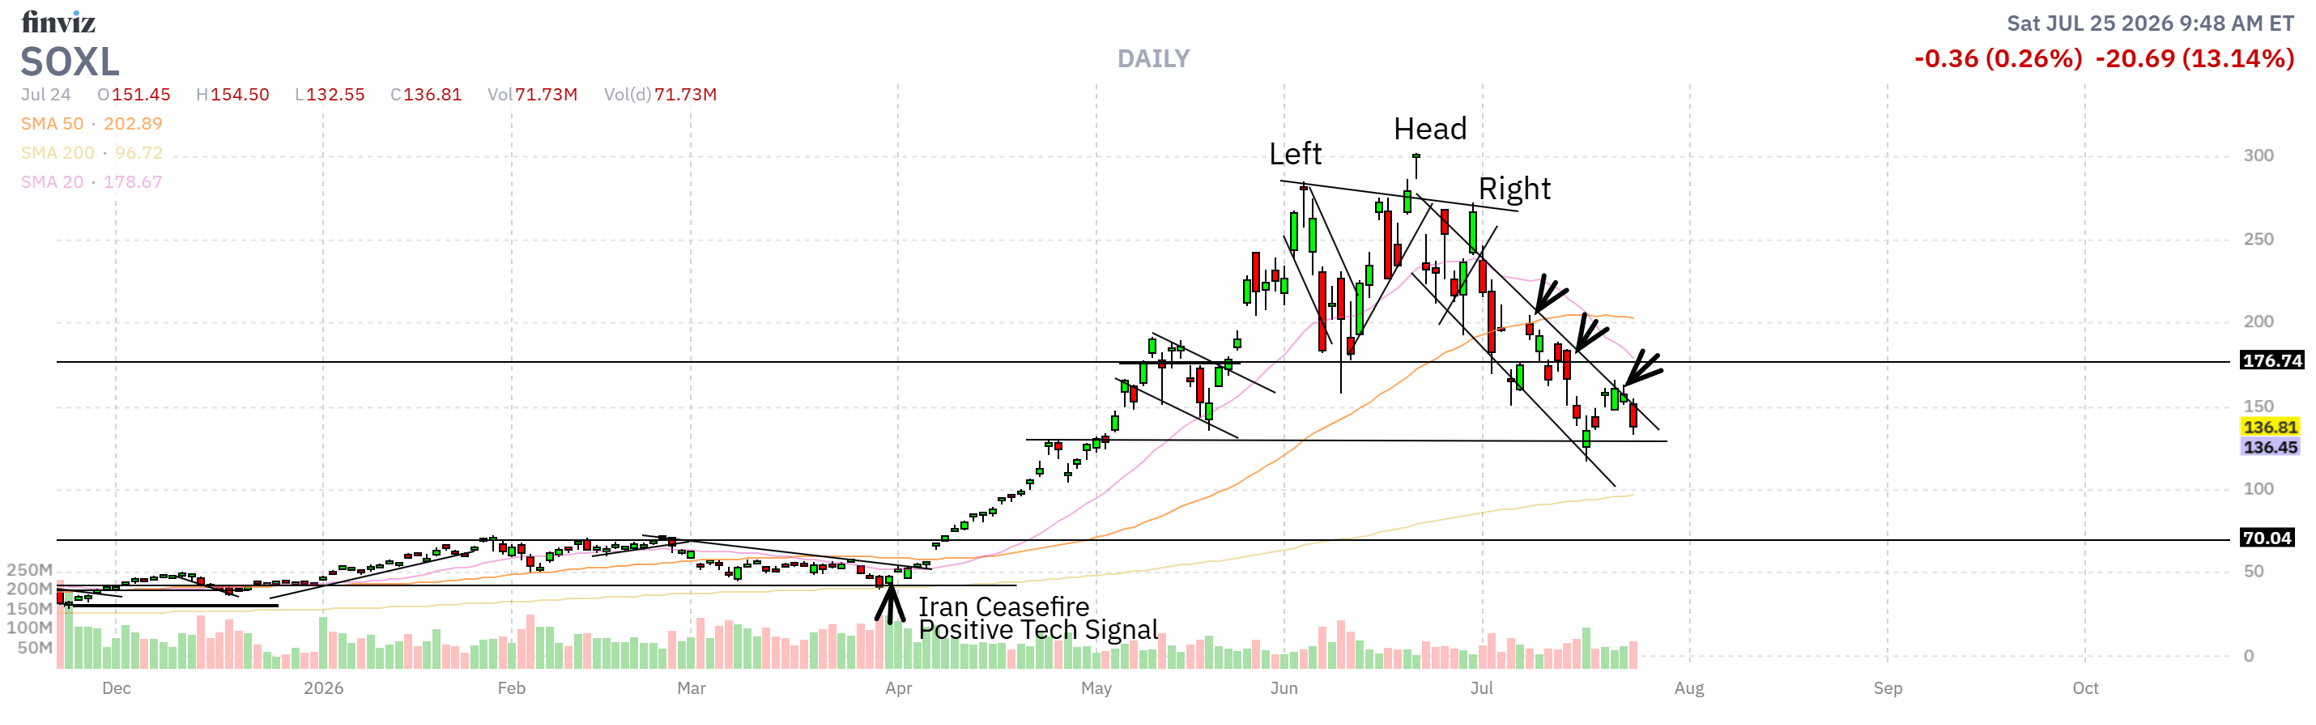
There are quite a few more topping signals of sectors this year like Silver, Cotton, Palladium to name a few. However the most consequential for the equity markets is arguably the Semiconductors segment. Direxion Daily Semiconductor Bull ETF (SOXL) shown below reflects over $12 trillion market cap in the semiconductor sector. This fund is down -54.7% from the June 22nd peak with risk of further declines as it approaches a key test of support at $130/share.
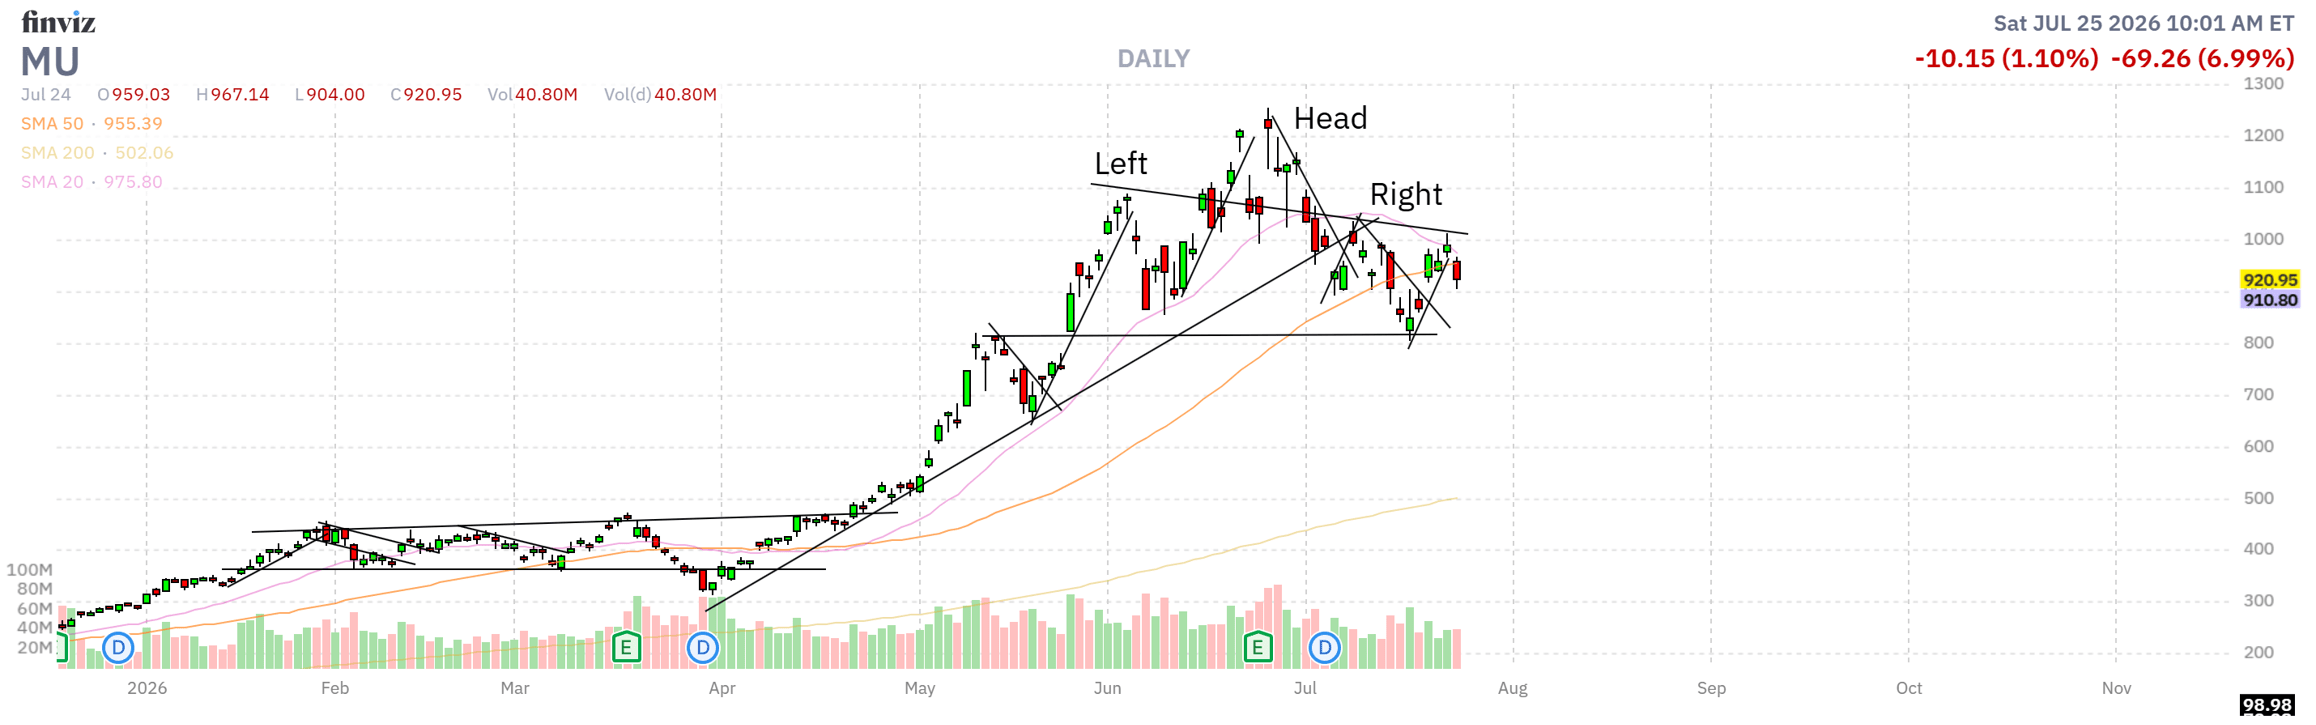
This pattern is especially evident within the Semiconductor sector looking at the Micron Technology (MU) chart up +222% YTD with record earnings and sales. How can a stock with such good earnings and sales growth be suffering such large declines? We will look at that in more detail in the “Skew” section of this article below.
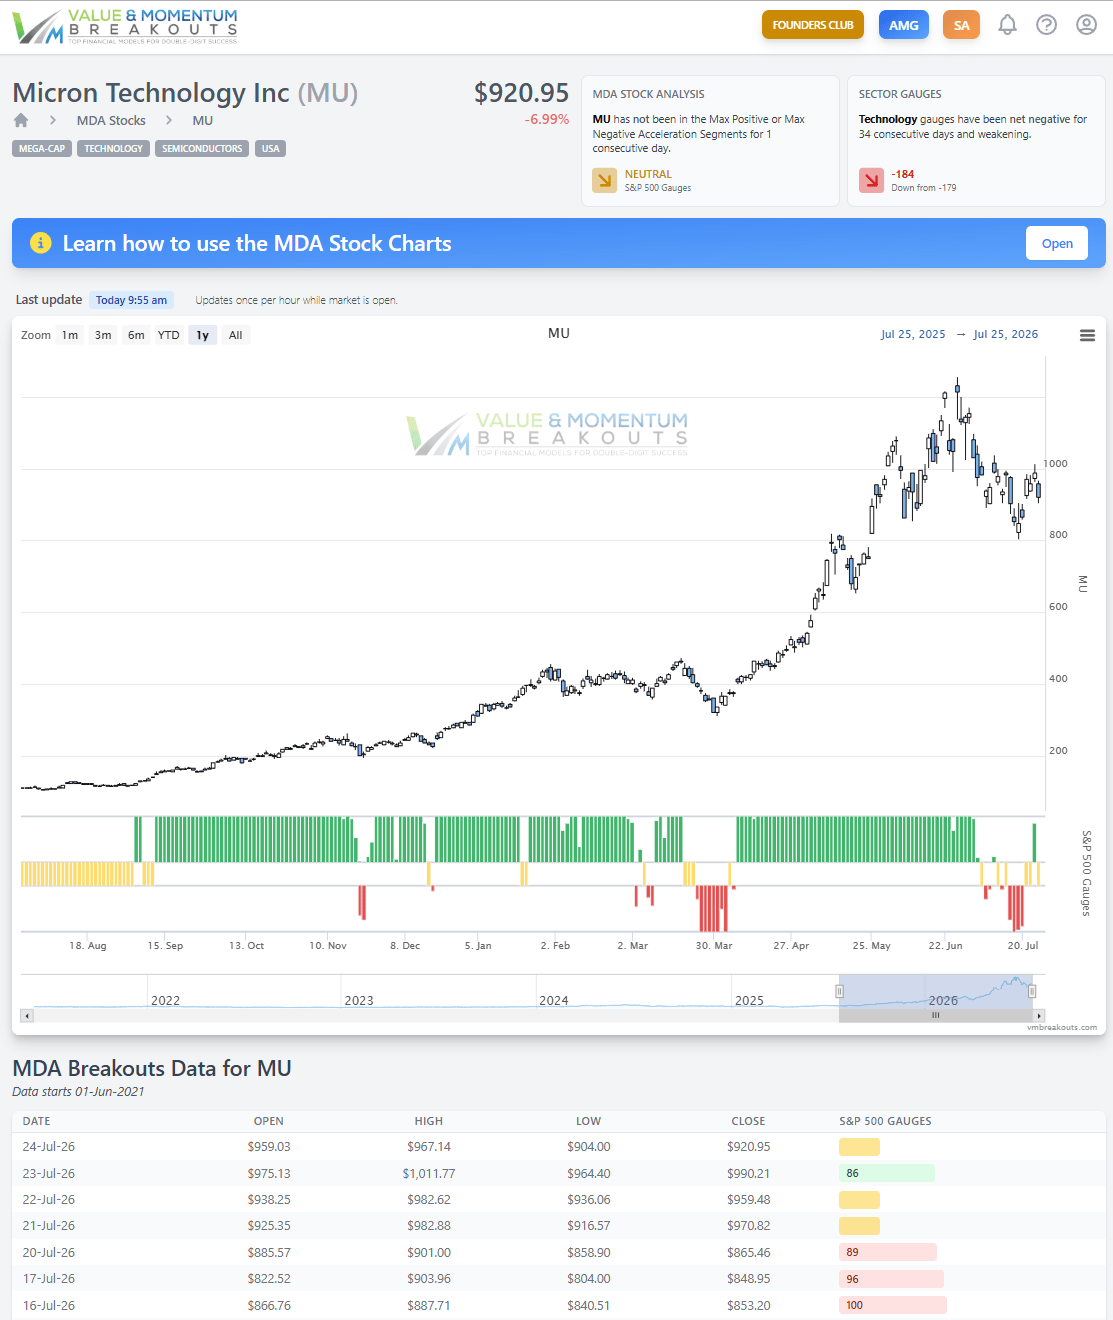
Using the multiple discriminant analysis MDA chart below of Micron, we are keeping a close eye on when key variables indicate it may be safe to return to this fantastic company in the days ahead.
Micron Technology daily MDA chart
II. Barrels
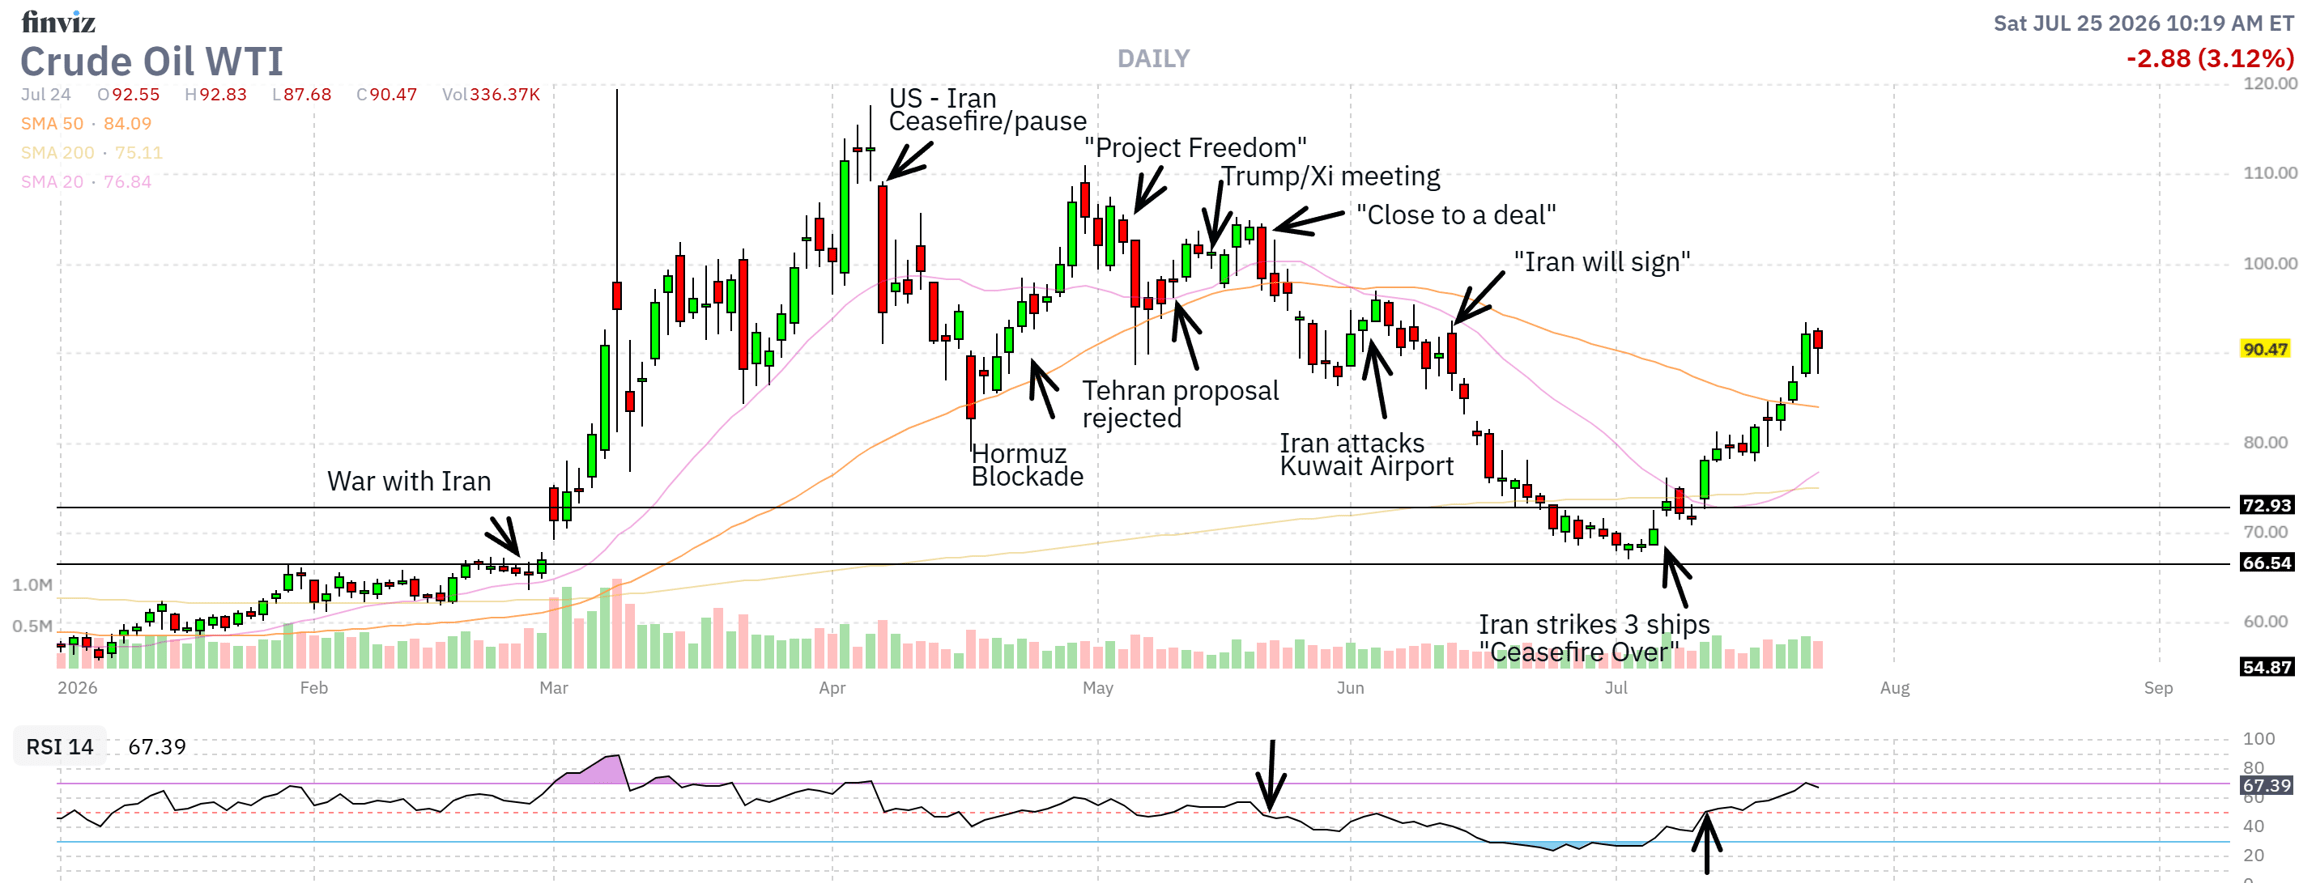
One of the most significant and unpredictable economic factors this year is the price of oil. Oil prices can drive significant short term inflation and why fuel costs are excluded from Core CPI focused on long term predictive measures. Nevertheless the rising inflation rates from February to May were largely a product of increasing delivery, travel and production costs related to oil prices.
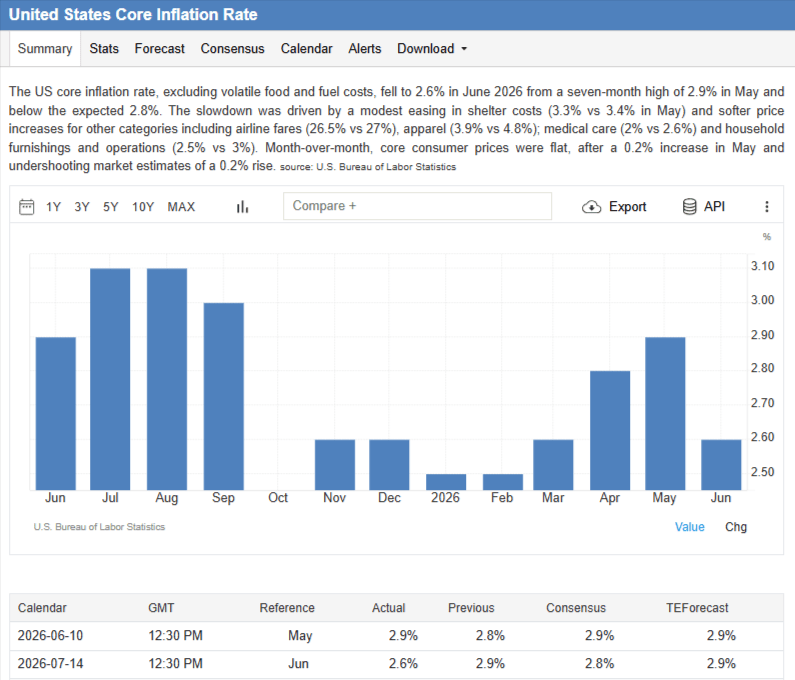
We have seen exceptionally strong stock market moves from the start of April when the US/Iran Ceasefire was announced. There have also been significant declines in inflation along with the recent decline in oil prices. However, since the termination of this fragile ceasefire on July 6th not only have oil prices rallied by +34% in July but we have seen approximately -7.2% declines in the Nasdaq in the same period.
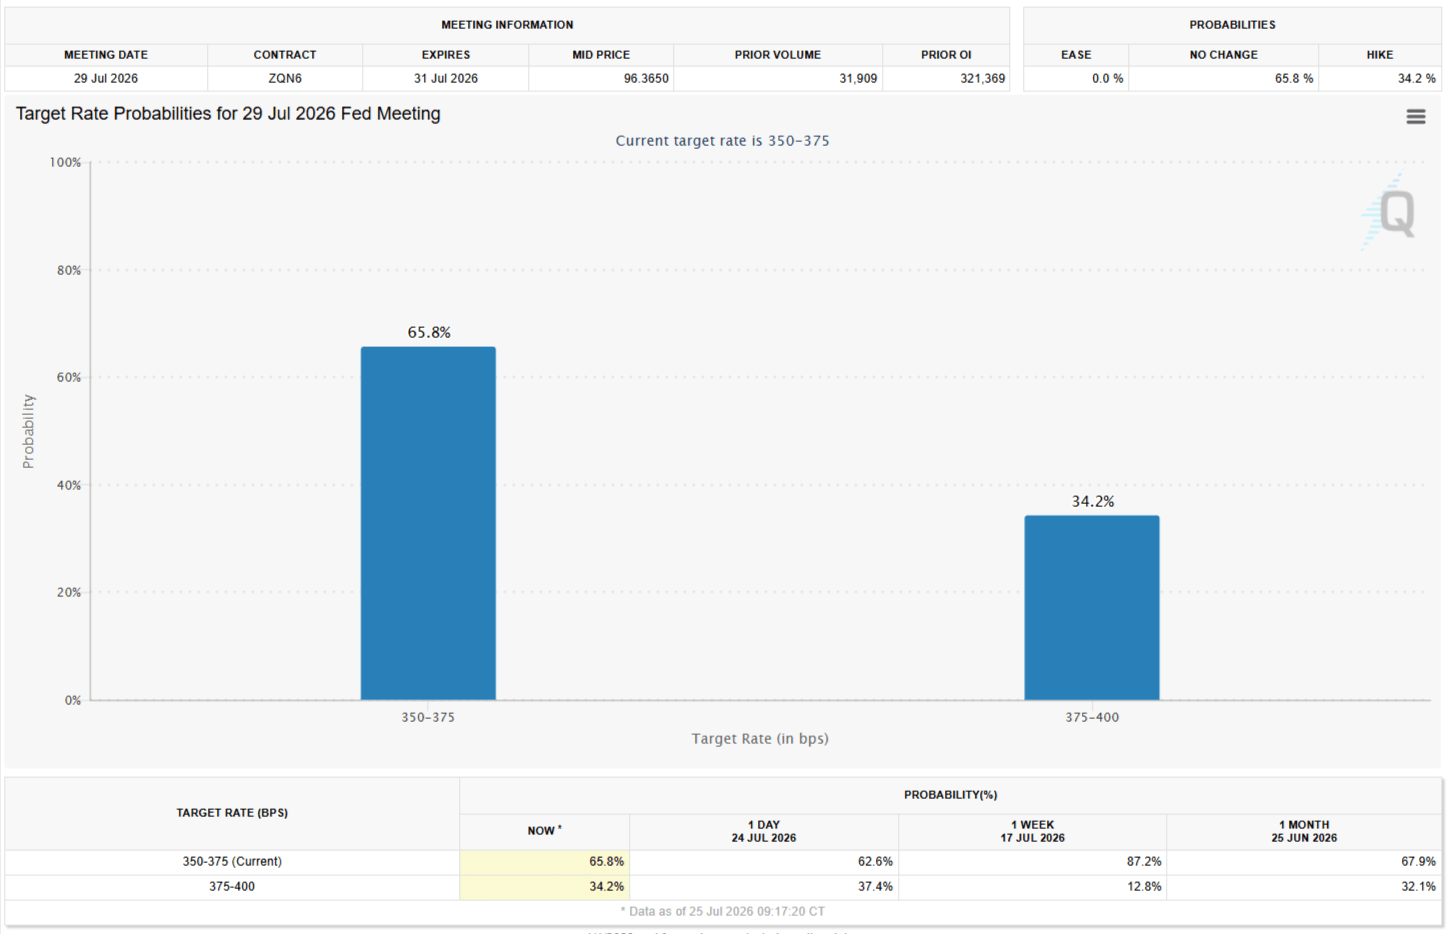
As inflationary concerns rise again in the short term, we are seeing additional pressures on the Fed to raise rates at their July 29th FOMC meeting. The odds of a rate hike have increased to 34.2% according to the CME Fedwatch tool.
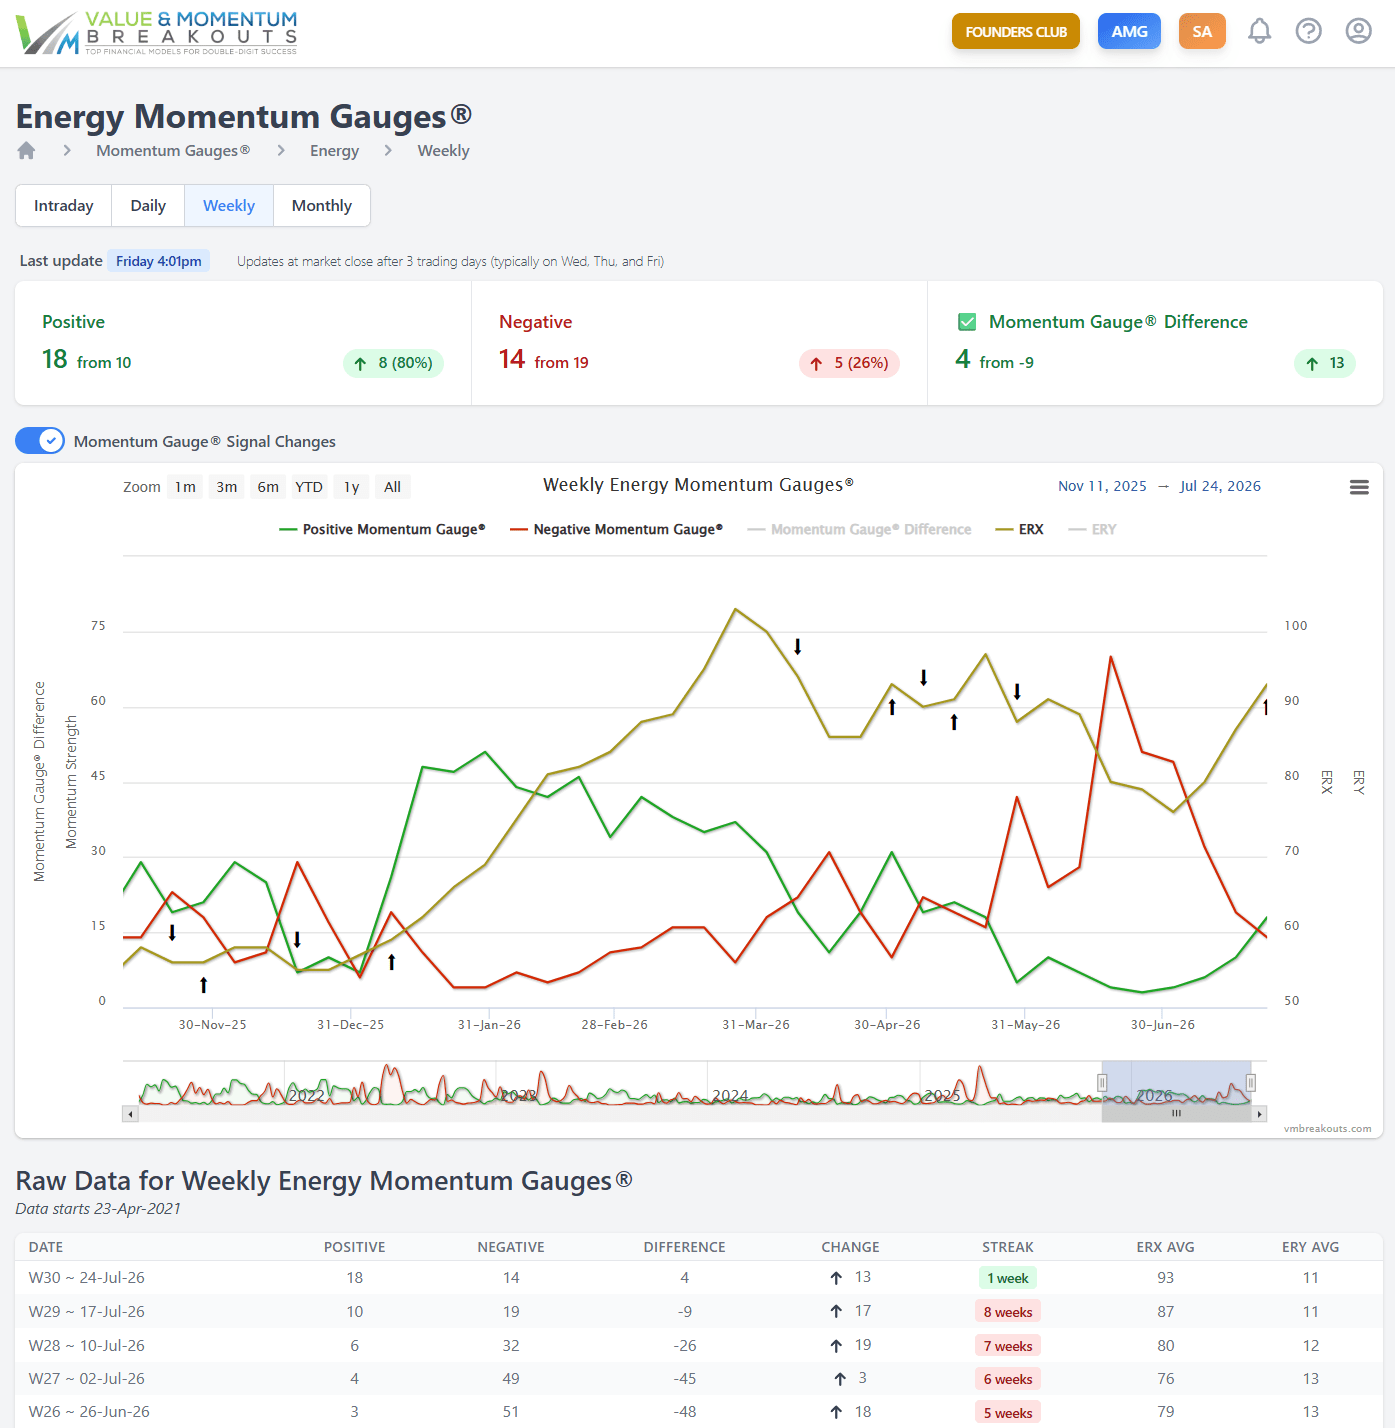
While the Energy sector gauges are positive with five weeks of rising positive MG values and declining negative momentum, we cannot be certain when another exogenous shock related to Iran will occur with escalating attacks or an abrupt ceasefire.
III. Skew
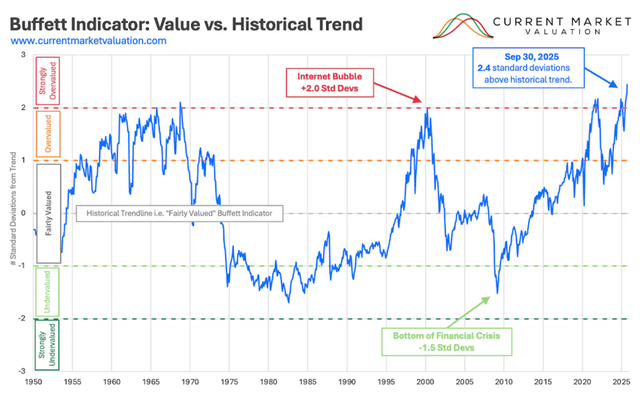
Lastly, as I wrote in my 2026 forecast article “Chasing Bubbles and Riding Value in Another Year Leading the S&P 500” the Buffett indicator was at the highest valuations in over 75 years and still increasing.
Fast forward another 6 months and we can see more clearly the extremes of the current skew as measured by the equal-weighted to market-cap-weighted stocks in the S&P 500. This represents the highest concentration into the fewest mega cap stocks in the index since 2004.
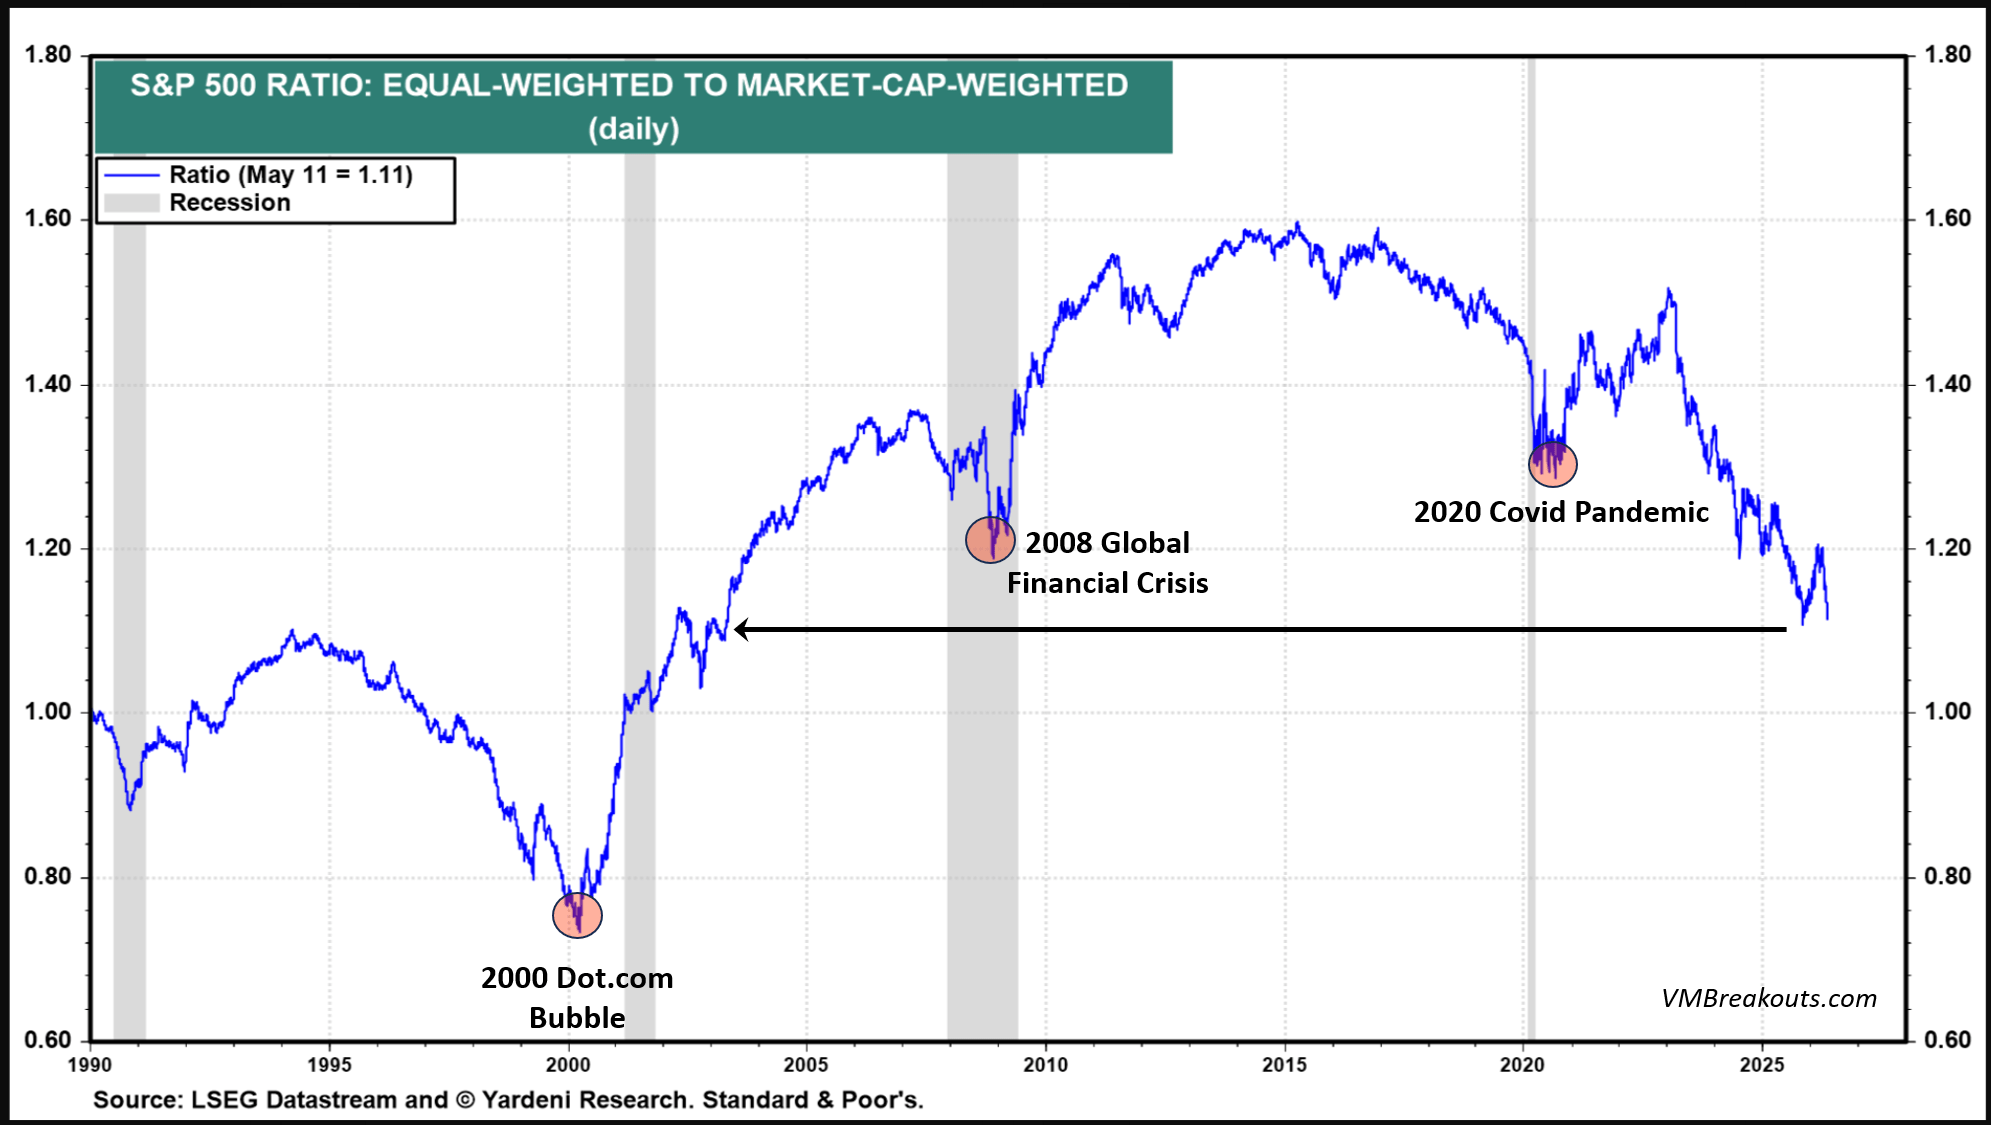
Ok we have seen these charts before, “but this time it’s different!” This time I’m told the record growth and the massive Intel Corp. (INTC) earnings beat deserve to be even higher in price than ever before.
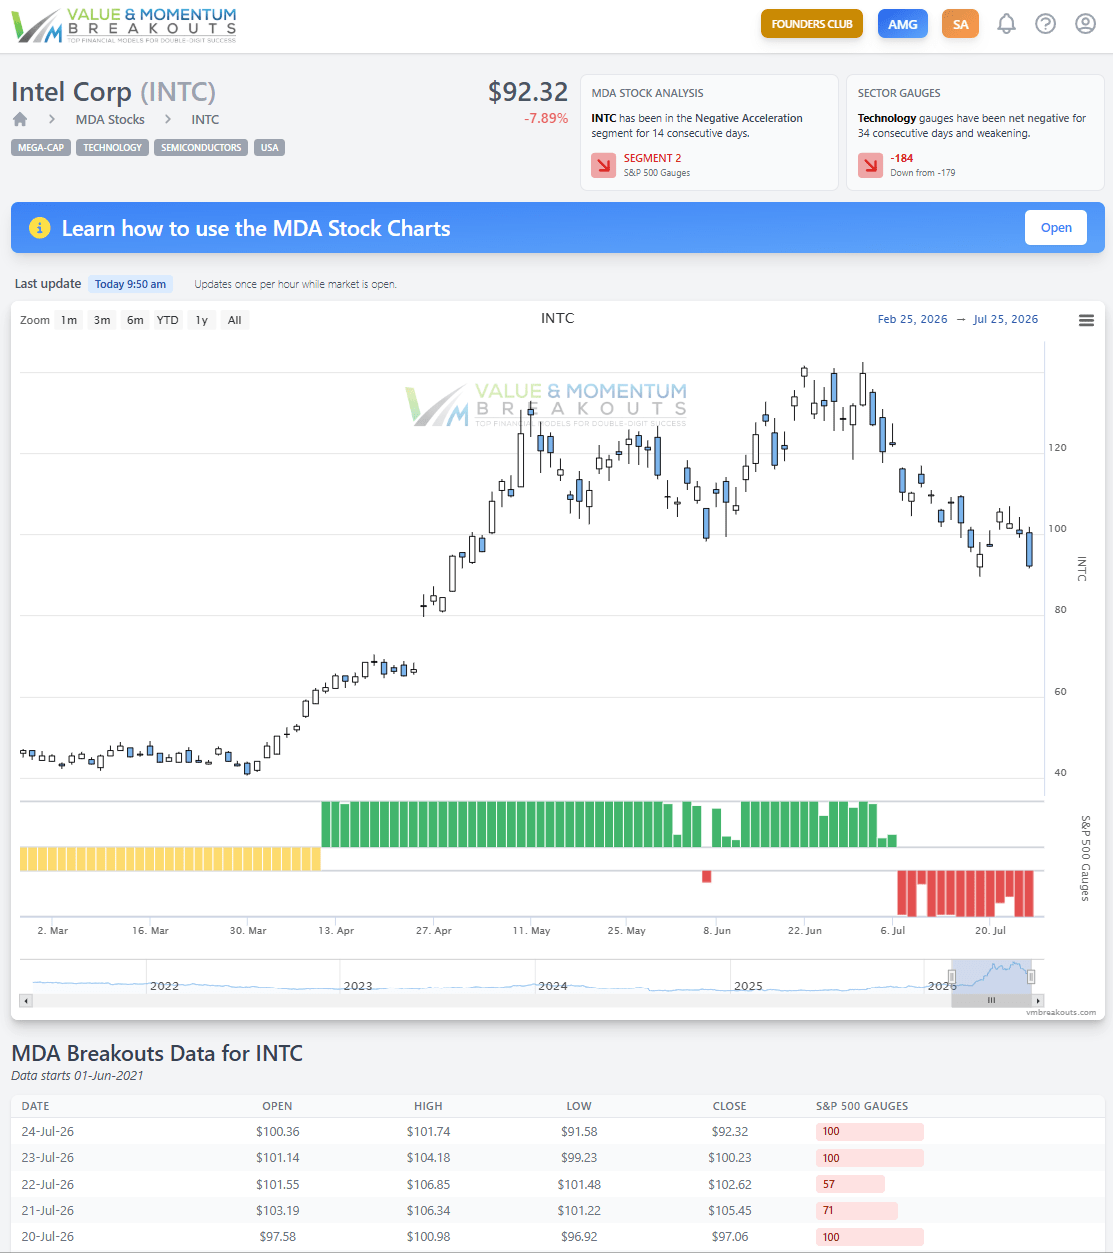
The challenge is not that these phenomenal semiconductor stocks fail to produce record earnings and sales every quarter. The basic concern underlying the current weakness is whether the current prices have gone too high too fast relative to the very best growth estimates.
To better explain what I mean let’s look at the S&P 500 Price to Long Term Earnings Growth ratio. The most recent weekly chart for July shows the most extreme S&P 500 PEG ratio in at least 30 years. So unlike 2020 in the middle of COVID, the prices being paid to own the S&P 500 are the most expensive in many decades relative to the best expected growth. Other charts suggest investors are also the most leveraged in the stock market that they have been in many years.
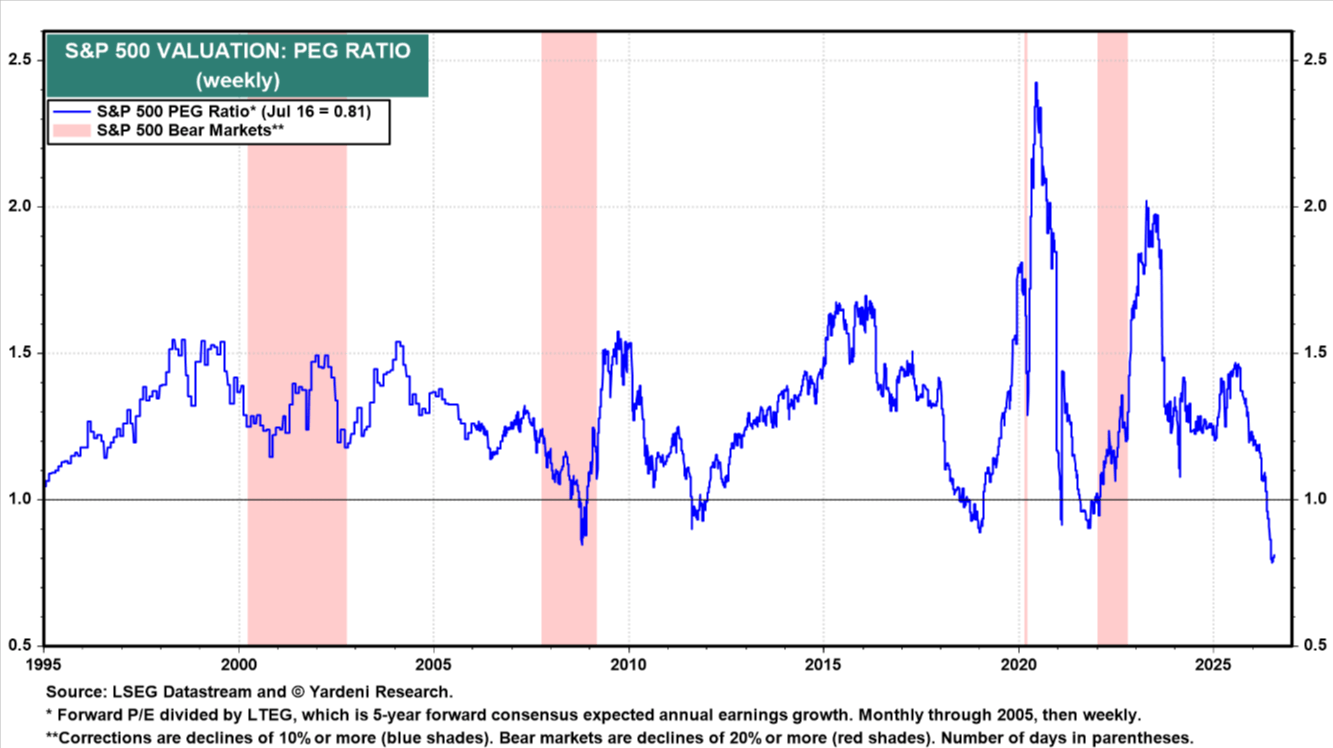
While it is easy to make a case that the semiconductor giants are delivering earnings results that almost no one has ever seen before, so too are the prices relative to incredible growth estimates. We will see how long they can continue to sustain at these levels even when delivering such positive long term outlooks.
So as we analyze Technology, the largest and most heavily weighted sector on the Major Indices (SPY) (QQQ), we are seeing clear trends in the momentum gauges. For the past 34 trading days from June 5th these sector gauges have been negative. They also reflect a volatile trend of rising negative momentum toward prior peaks at March and February market lows.

The best time to be in the market this year was clearly between April and June, according to the Technology gauges. While this is certainly no guarantee that the negative momentum will match or exceed prior market pullbacks the market risks are extremely elevated.
Conclusion
My main conclusion is to be careful chasing the AI exuberance. Consider some long term proven models from the financial literature that I have tested live on Seeking Alpha going on 10 years. Use timing indicators to minimize downturn losses and preserve capital as you build wealth.

Leave a Reply