I’ve bought 141 shares in AGNC, xd today for 1k, currently yielding 15%.
As this is high risk, the SNOWBALL will pair trade the position with another ‘share’ with a blended yield of 10%.
Investment Trust Dividends
I’ve bought 141 shares in AGNC, xd today for 1k, currently yielding 15%.
As this is high risk, the SNOWBALL will pair trade the position with another ‘share’ with a blended yield of 10%.

Fiona Craig
LSE:SUPR
29 September 2026
Supermarket Income REIT (LSE:SUPR) is entering its next phase of growth with a portfolio now established at over £2 billion, a strong financial performance and ambitions to more than double the scale of the business over the coming years.
The company delivered a 7.5% total accounting return for the year, while continued acquisition activity has helped expand earnings and strengthen the platform for future dividend growth.
Speaking to ADVFN’s Watch List, Rob Abraham, CEO of Supermarket Income REIT, highlighted the role of acquisitions and the company’s growing scale in driving performance.
Acquisitions driving earnings growth
According to Abraham, the company’s strong performance has been underpinned by an active approach to acquisitions and the development of a more efficient investment platform.
A key step has been the establishment of a joint venture with Blue Owl Capital, which has now been scaled to £855 million.
The structure has enabled Supermarket Income REIT to recycle capital and reinvest proceeds into further earnings-enhancing acquisitions, creating additional capacity for growth.
The objective is not simply to expand the property portfolio, but to build the earnings base needed to support sustainable dividend growth.
Supermarket Income REIT has also set a target of at least 2% annual dividend growth from FY2027, with the growing scale of the platform helping to support that ambition.
Abraham also pointed to the benefits of scale, with the company continuing to build an efficient operating platform and improve its cost ratio as the portfolio grows.
A £4bn opportunity
With the portfolio now over £2 billion, Supermarket Income REIT has set its sights considerably higher, targeting £4 billion and beyond.
The opportunity extends across the wider grocery property market, where the company believes its sector specialism gives it the ability to identify and underwrite opportunities across a broad range of assets.
That includes traditional large-format supermarkets, which remain an important part of the strategy, alongside smaller-format and convenience stores.
The company is also looking further along the grocery supply chain, including grocery logistics properties and distribution warehouses that support store networks.
There is also potential to expand the strategy into European markets.
Maintaining quality as the portfolio grows
Importantly, the strategy is not simply about increasing the size of the portfolio.
Supermarket Income REIT intends to maintain a strong quality profile as it scales, using a combination of lease length, tenant quality and investment-grade characteristics when assessing opportunities.
Abraham outlined a target portfolio structure of approximately:
This provides a clear framework for how the company intends to grow while maintaining the defensive characteristics of its existing portfolio.
The focus remains on properties operated by leading grocery businesses, with Supermarket Income REIT targeting some of the most important and mission-critical assets within their networks.
Building on a strong platform
With a £2 billion portfolio already established, an £855 million joint venture vehicle and a clear ambition to reach £4 billion and beyond, Supermarket Income REIT is positioning itself for another stage of expansion.
The combination of acquisition-led earnings growth, increasing scale and a focus on long-duration, inflation-linked grocery income provides the foundation for the company’s next phase.
For investors following the UK real estate sector, Supermarket Income REIT’s progress will be closely linked to its ability to continue deploying capital into attractive grocery property opportunities while maintaining the quality and resilience of its income base.
As Rob Abraham explains, the strategy is ultimately about using scale to grow earnings, support dividends and build a larger portfolio while retaining the attractive fundamentals that have defined Supermarket Income REIT to date.
For more information visit Supermarket Income REIT
This article was written by the editorial team at InvestorsHub/ADVFN

Michael Foster, Investment Strategist
Updated: September 28, 2026
Today I want to talk about something we don’t touch on very often in these columns: an obscure (yet highly profitable) situation called a “tender offer.”
I know the name sounds a bit stiff. But if one comes along when you hold a closed-end fund (CEF)—particularly a CEF you bought when it was particularly oversold—wow.
You can find yourself sitting on a fast gain as well as a high dividend payout (as I write this, the average CEF yields around 9%).
As we’ll see in the case of one CEF below, a tender offer can take a fund purchased at an 11.5% discount and let the shareholder cash in a chunk of their holding at nearly full value.
Before I get into a tender offer one group of investors is getting a shot at now, let’s break down this happy turn of events, and look at the simple way you can boost your odds of benefiting from one yourself.
We’ll do that by first putting one of the main features of CEFs on the table: the fact that these funds generally have a fixed number of shares throughout their lives. That’s why CEFs are “closed.” ETFs, by contrast, are “open,” since they can issue as many new shares as the market will buy.
The main effect of this is that CEFs often trade at different levels in relation to their net asset value (NAV, or the value of their underlying portfolios), and often at a discount.
Which brings us to the Virtus Dividend, Interest & Premium Strategy Fund (NFJ), a CEF at the center of a recent (and quite rich) tender offer.
NFJ’s shares trade at a 5.4% discount to NAV as I write this. This means we can buy the stocks this fund holds—including Alphabet (GOOGL), Advanced Micro Devices (AMD), the Charles Schwab Corp. (SCHW) and Eli Lilly & Co. (LLY)—for 5.4% less than if we’d bought those shares on the market.
Lately, that discount has been narrowing:
NFJ’s Discount Approaches Par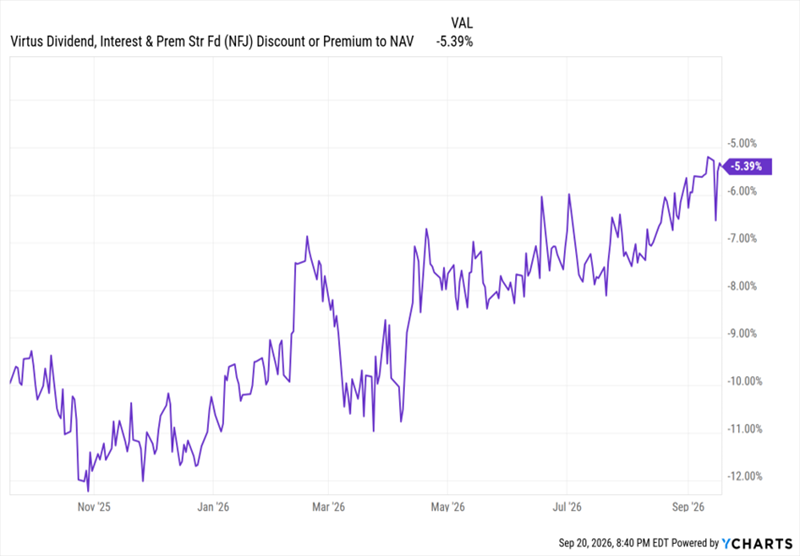
As you can see, NFJ has traded at a much wider discount in the past year, and in fact its average discount over the last decade is 11.5%.
Right now, NFJ yields 8%, which is normal for this fund. And if you buy when it’s at a wide discount and then sell at a smaller discount (or premium), you also set yourself up for gains. This is the magic of CEF investing. And a tender offer, in essence, supercharges it.
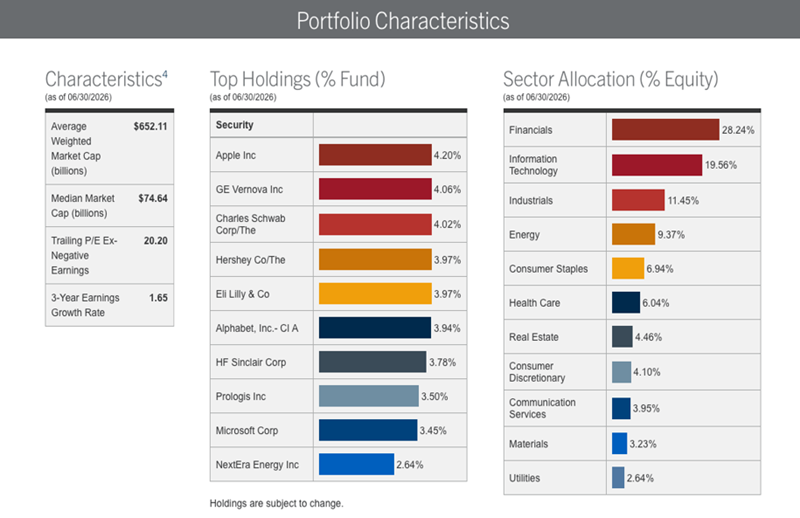
Source: Virtus Funds
NFJ, as you can see above, mostly holds large-cap stocks across sectors, making it a decent replacement for an S&P 500 index fund. That is, except for a critical detail: that 8% income stream. Most index funds pay around 1%. We’re obviously not retiring on that.
There’s a catch, though: NFJ has underperformed the S&P 500 in the long run:
NFJ: A Strong Fund, But Only for Short Periods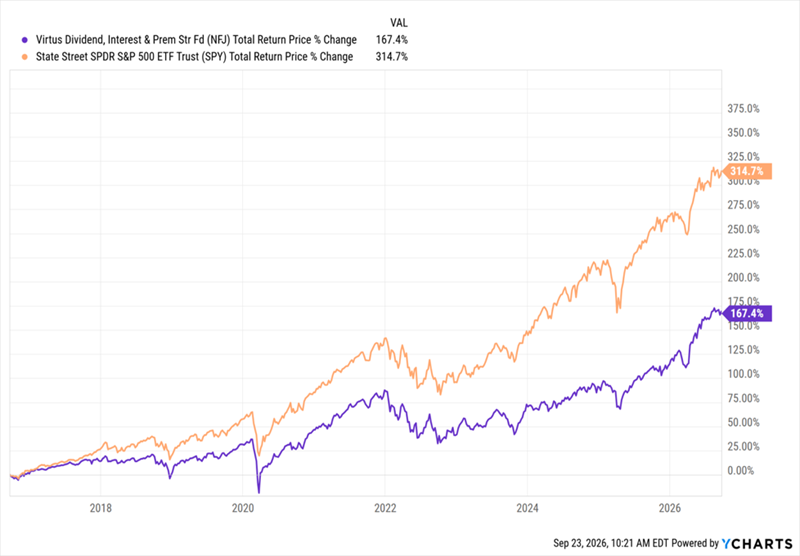
With this in mind, the best strategy is to hold NFJ for short periods and collect income while profiting from changes in the discount. CEF managers (including those at NFJ) are aware of this—and they’ll do what they can to ensure discounts don’t stay too wide for too long.
If they fail to narrow those markdowns, they open the door for activist investors to come in, buy up shares and force a vote that could remove those managers.
How NFJ’s Tender Offer Works
This was the situation for NFJ, which is why management announced a tender offer. This offer is the result of an agreement with activist investor Saba Capital Management.
Under NFJ’s offer, which opened on September 1, 2026, the fund aims to buy back up to 25% of its outstanding shares at 99% of its NAV at the close of trading on October 5 (the offer’s expiration date). If investors holding more than 25% of NFJ’s shares outstanding tender their holdings, management will buy them on a pro rata basis.
If you bought at a wider discount than that at which the fund is buying (again, just 1% below NAV)—and with a 10-year average discount of 11.5%, most long-term holders did—you get to cash in at close to full value. Essentially, the average buyer over the last decade picked up the fund for 88.5 cents on the dollar and can now tender at 99 cents.
Note that you have to elect to tender through your broker.
I think you’ll agree that this is a nice upside kicker. And of course it comes alongside any other gains you booked from the fund, as well as the dividends collected (noting, of course, that the payout has risen about 36% in the last five years, with a special dividend issued, too).
(That also, of course, means that if you buy near the current discount, you’ll get a smaller return from the tender offer than those who bought earlier, at bigger discounts, would.)
So where does that leave us? I like to think of tender offers the same way we would a takeover in a regular stock. They unlock value, but we can’t, of course, invest only with the hope of attracting one. The best thing to do is buy cheap, which puts us in a better position to profit if and when one comes along.

Thursday 1 October
Custodian Property Income REIT PLC ex-dividend date
F&C Investment Trust PLC ex-dividend date
Henderson Smaller Cos Investment Trust PLC ex-dividend date
Invesco Asia Dragon Trust PLC ex-dividend date
International Trust PLC ex-dividend date
Murray International Trust PLC ex-dividend date
North American Income Trust PLC ex-dividend date
Pantheon Infrastructure ex-dividend date
Polar Capital Global Financials Trust PLC ex-dividend date
RIT Capital Partners PLC ex-dividend date
RM Infrastructure Income ex-dividend date
Schroder Income Growth Fund PLC ex-dividend date
Schroder Japan Trust PLC ex-dividend date
Value & Indexed Property Income Trust PLC ex-dividend date
Murray International Trust PLC ex-dividend date

I have bought an opening position in PCT. (see earlier post)
28 Shares for £200.The purchases will make very little difference to the SNOWBALL until a meaningful amount is invested.


ORIT remains on track to pay its target dividend.
Alan Ray
Updated 25 Sep 2026
Disclosure – Non-Independent Marketing Communication
This is a non-independent marketing communication commissioned by Octopus Renewables Infrastructure (ORIT). The report has not been prepared in accordance with legal requirements designed to promote the independence of investment research and is not subject to any prohibition on the dealing ahead of the dissemination of investment research.
From an Octopus Renewables Infrastructure (ORIT) specific perspective, this was a difficult first half, with a technical reassessment of the onshore wind portfolio leading to a significant reduction in NAV. However, what we can now say is that the valuation is rooted in actual technical data from the specific assets in question, with ORIT’s more mature solar assets and offshore wind assets already valued this way, and with just some of its more recently commissioned solar assets, which are performing in line with expectations, relying on pre-construction forecasts for their valuation. While no disposals were made in H1, the team reports that, while the listed renewables infrastructure trusts remain at wide discounts, in the wider world of renewables it sees an improvement in sentiment and there is demand for good-quality assets, albeit transactions are taking longer and are subject to rigorous scrutiny. The team has various sales processes underway and expects the next asset sales to complete in late 2026 or early 2027.
From a big-picture perspective, 2026 is unfolding as an important year for renewables. Whereas electricity demand in the UK and elsewhere has remained relatively constant for some time, all of the signs are that the electrification of the global economy is picking up pace, and there can be few investors who aren’t aware of the enormous challenge that the growth in datacentres will place on electricity grids. Yes, it’s true that investment is going into other forms of power generation, such as nuclear and even fusion, and these tend to attract headlines. But these remain enormously expensive, time-consuming to build or technically unproven, or combine all three characteristics. Renewables, combined with battery storage, by contrast, are proven technologies with large installed bases across many grids that are, even without subsidy, relatively cost-effective and quick to build. Yes, there are challenges, such as the need to upgrade power grids, the global demand for various common and uncommon metals and materials, and risks to supply chains, but those still need to be seen in the context of proven technology, where the engineering challenges are all well understood.
An understandable investor frustration with the listed sector is that 2026 also saw power price spikes caused by the unstable, difficult-to-predict crisis in the Persian Gulf, which continues to haunt energy markets. ORIT’s strategy of fixing the majority of its revenues (86% are fixed over the next two years to 30 June 2028) means it has limited exposure to short-term power-price spikes, but this is a function of one of its core propositions: a stable, growing dividend. It’s notable that although overall power generation was broadly on budget, revenue and EBITDA were slightly ahead as a result of incremental management actions. As a result, dividend cover has increased, and thus ORIT has delivered on one of its central objectives.
So, without downplaying that this has been a tough first half, ORIT now has a portfolio diversified across multiple European jurisdictions and operates a range of technologies that are all well understood from an operational and construction point of view, with relatively predictable economics. This is against a backdrop where electricity demand is starting to ramp up as the AI-datacentre build-out continues at pace. If that demand scenario plays out, then ORIT’s discount of 30% and yield of 10% could prove to be a very attractive entry point.
Primary Health Properties PLC
(“PHP” or the “Company”)
Notice of Interim Dividend
The Company announces that the fourth quarterly interim dividend in 2026 of 1.825 pence per ordinary share of a nominal value of 12.5 pence each (“Dividend”) will be paid as 0.725 pence by way of a Property Income Distribution (“PID”) and the remainder as an ordinary dividend of 1.100 pence (“Non-PID”) on Friday, 20 November 2026 (“Dividend Payment Date”) to shareholders on the register on 16 October 2026 (“Record Date”).

It’s your duty to check the latest dividend announcements for shares in your Snowball.
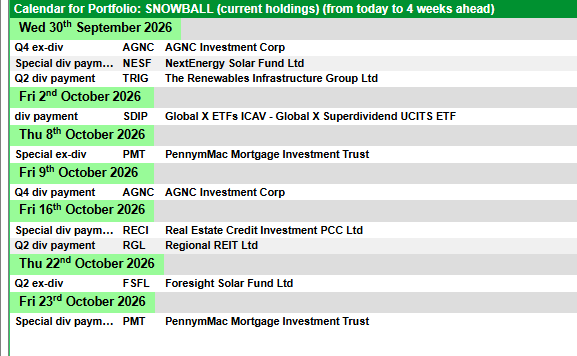
Several dividends for re-investment, 2b added to cash of £798.77


I’m going to add to the SNOWBALL a TR share, that is a share that doesn’t pay a dividend. I’m going to drip feed one hundred pounds of dividends into the share but only investing £200 because of costs. Hopefully the share price will fall as the SNOWBALL builds a position and one day the share will be sold and re-invested into a dividend paying share. Because the income is coming from earned dividends, the risk is lowered and it will make very little difference to the total income for the SNOWBALL.

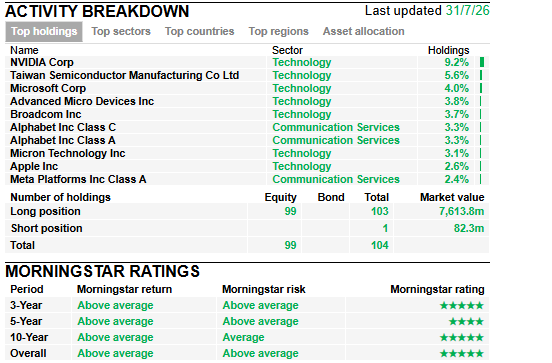
High risk, so the plan is to drip feed a small amount of income into the share bi- monthly.


Brett Owens, Chief Investment Strategist
Updated: September 23, 2026
“If winning isn’t supposed to matter, then why are they introducing a playoff system?”
I shook my head in disbelief as I whispered this unfolding “riddle” to my coaching buddy in the chair next to me. We were at the YMCA fall basketball meeting, sweating it out in the preschool room. (Where was the air conditioning on this sultry September evening?)
The YMCA regional manager, notorious for talking for an hour about the exact same thing to kick off every season, had something new. And to be honest, the “ruling” made no sense to me.
Playoffs? We’re talkin’ about…playoffs?
At the Y?
What a silly rule! We, as coaches, are supposed to play everyone equally. Our job is to develop players. Winning a game on a random Saturday afternoon in September shouldn’t come at the expense of poor Little Joey not being able to get off the end of the bench because his too-serious coach is in “win now” mode.
Alas, the room voted. The masses overruled my objections and implemented our playoff system.
Yet another “rule” that I will refuse to recognize. I don’t care if we make the playoffs. Just as I don’t care what the “middle rating agency” says about a particular bond.
Yes, Bondland can be like the YMCA! It runs by rules that may not make sense. Vanilla investors, like delusional weekend coaches, can be tempted into following them, however. It’s why the masses think it’s impossible to retire on dividends! They stop their shopping at investment-grade bond ETFs, like the iShares Core U.S. Aggregate Bond ETF (AGG) and the Vanguard Total Bond Market ETF (BND). They collect 4% or so and call it “good enough.”
Four percent is $40,000 on a million bucks. Not good enough!
These poverty-payout chasers play by the house rules in Bondland. But they don’t have to. It’s more profitable to swim away from the whales.
Which are massive animals. Global pension assets topped $68 trillion at the end of 2025. US insurance companies, meanwhile, held $5.7 trillion worth of bonds. That’s some whales!
For funds tracking the Bloomberg Aggregate, the rulebook is explicit: The index drops a bond when two of its three ratings fall below investment grade. The funds that track the Aggregate index sell the disgraced holding at their next month-end rebalance.
But the selling is often a knee-jerk reaction. Take the case of Celanese (CE), a chemical company that has been boosting debt levels to grow. Rating agencies don’t like borrowing, growth plans or not!
Celanese’s bonds started at 6.55%. S&P downgraded them first, then Moody’s piled on. The Moody’s downgrade is what knocked them below investment grade and out of the Aggregate index.
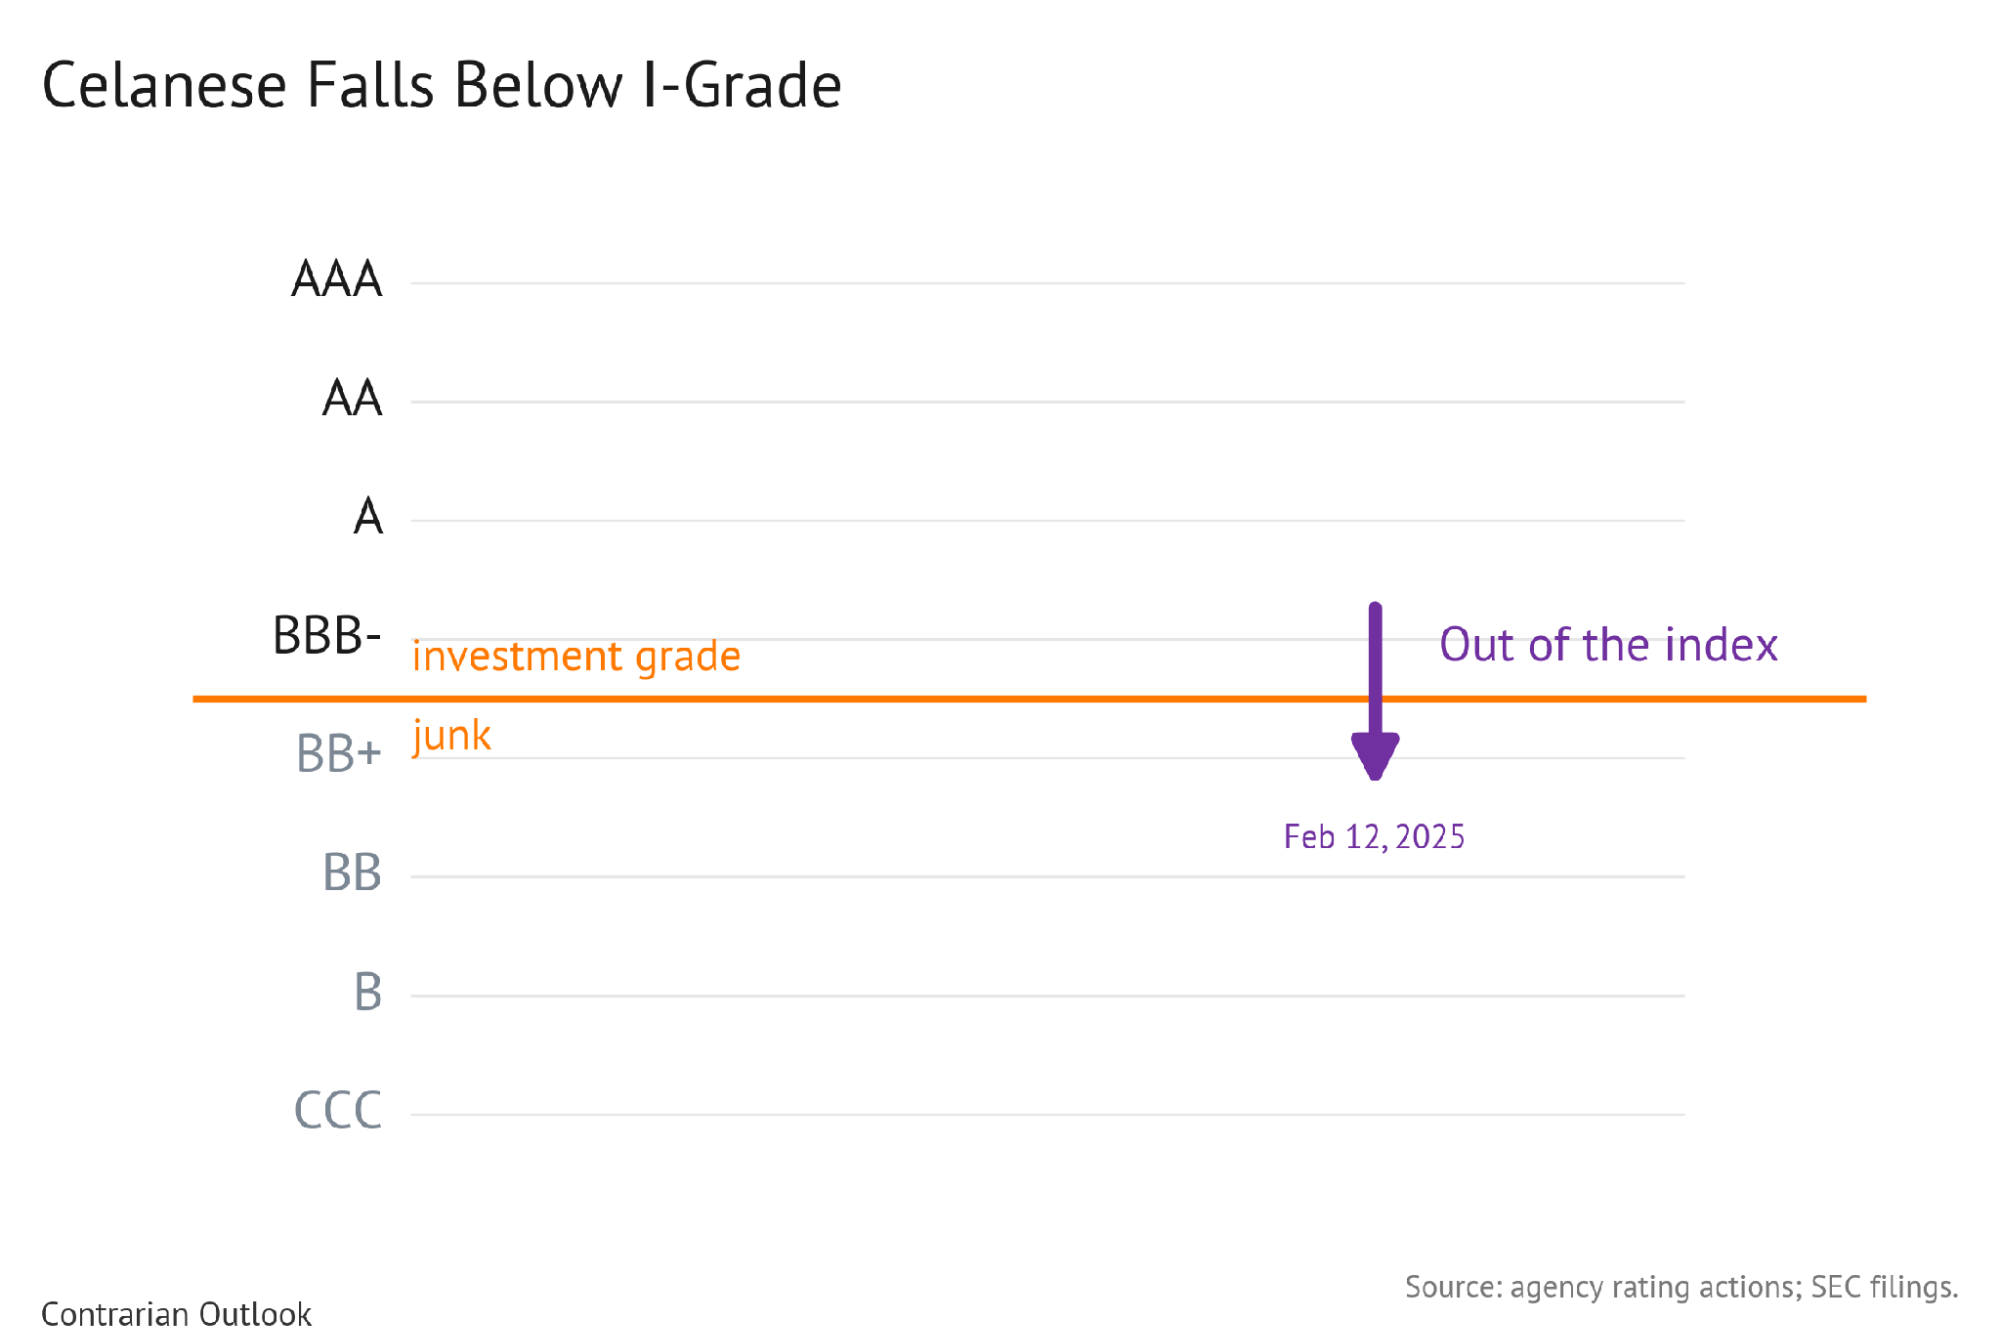
Now, the notes carry a “step-up clause,” which means every S&P or Moody’s cut raises the coupon by a quarter point. Four cuts later, the bonds that started at 6.55% will pay a full point more, 7.55%, starting this November. And here’s the part the whales missed: The price didn’t budge on the boot. It went up. The only real dip came eight weeks later, in the April 2025 selloff, when everything fell:
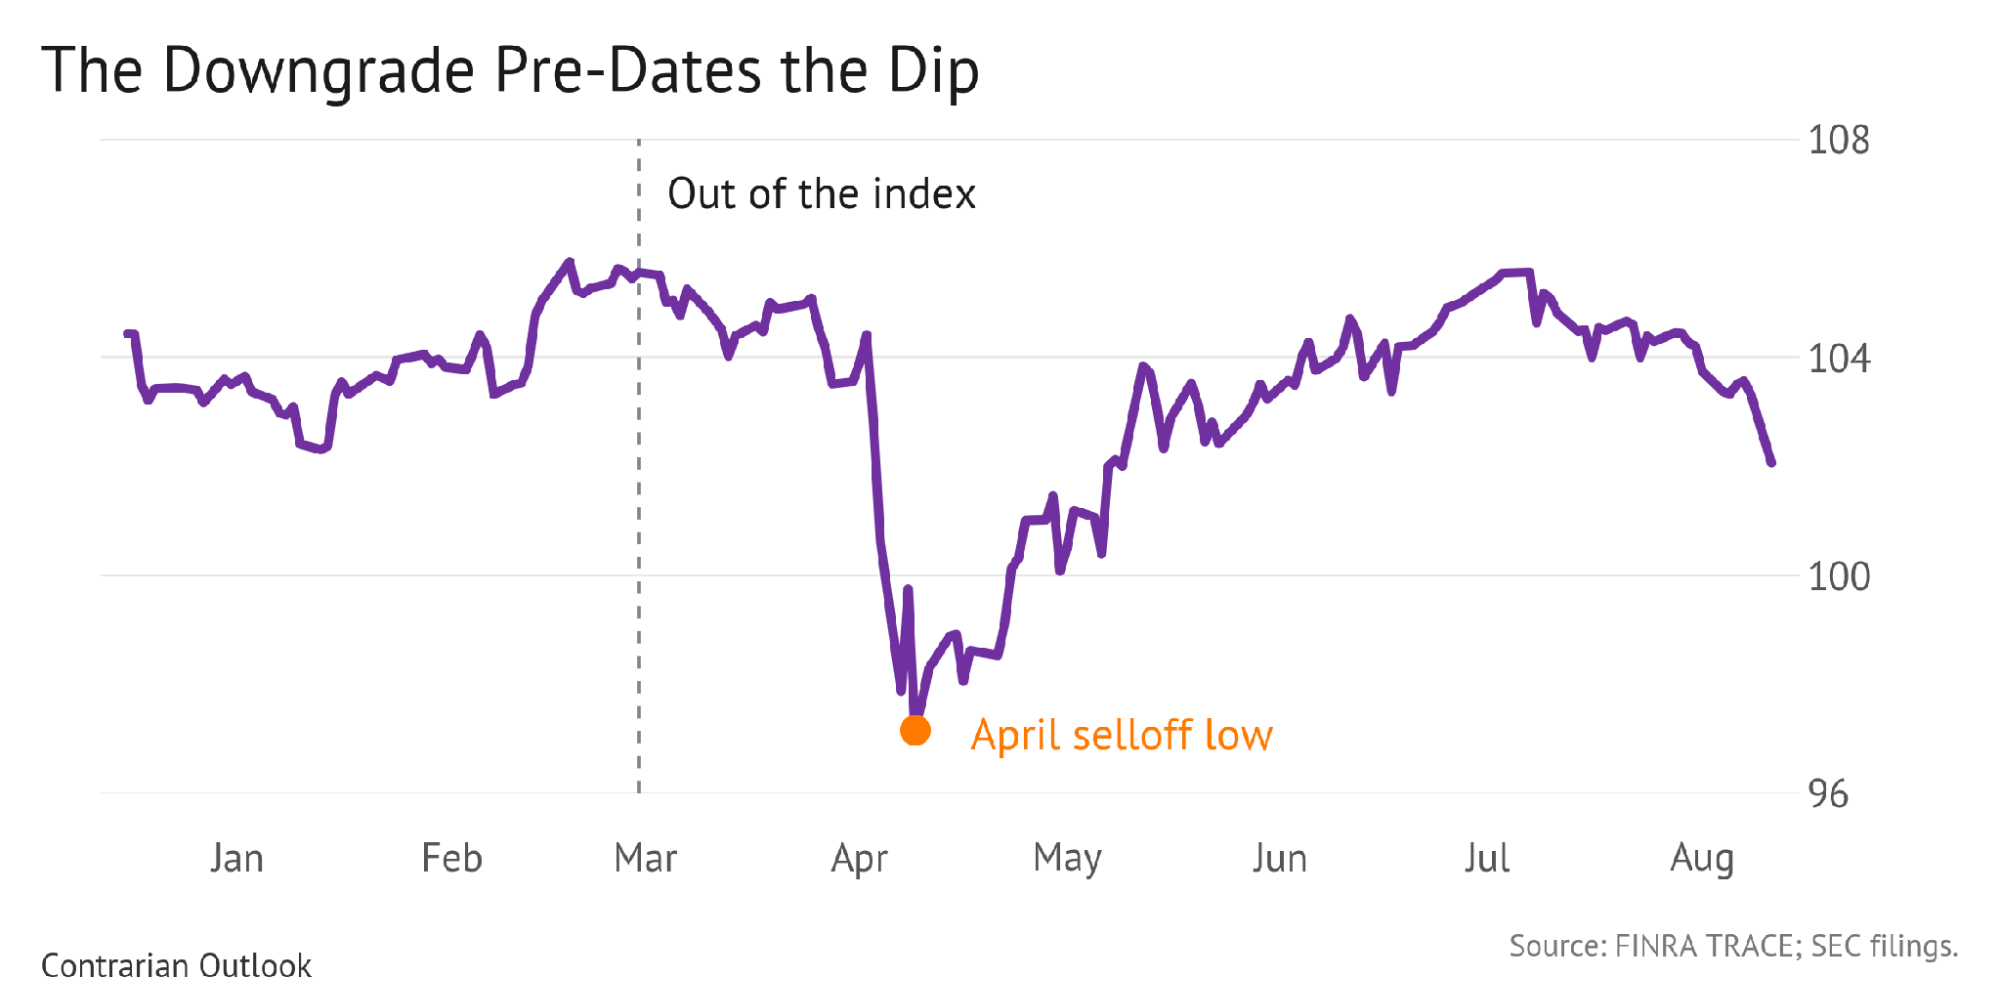
So the bond’s coupon moved up, its price held, and the April dip was the market’s, not the downgrade’s. How did Celanese respond? “I’ll show you” by reducing its net debt nearly 20% from $13.2 billion to $10.6 billion. The company made its payments just fine, rewarding those who bought the dip.
Bonds downgraded from investment grade to junk are called fallen angels. It’s become a popular bond buying strategy to buy them all. But be careful—they don’t all recover!
And honestly, do we want to—can we?—underwrite every chemical company and automaker? Analyze individual balance sheets and cash flows? Nah…we’ll hire the bond pros to make those calls!
This is the lucrative yield game that the pros at PIMCO play. The famous bond shop is the former home of the Bond King, Bill Gross, and current home of his successor, Dan “The Beast” Ivascyn. Ivascyn runs a series of closed-end funds through which we can buy downgraded and unloved bonds, handpicked by the Beast and his team.
My top bond CEF to buy right now is PIMCO Dynamic Income Opportunities Fund (PDO). Its mandate puts no cap on below-investment-grade bonds—only on the very lowest grades. No self-defeating rules here!
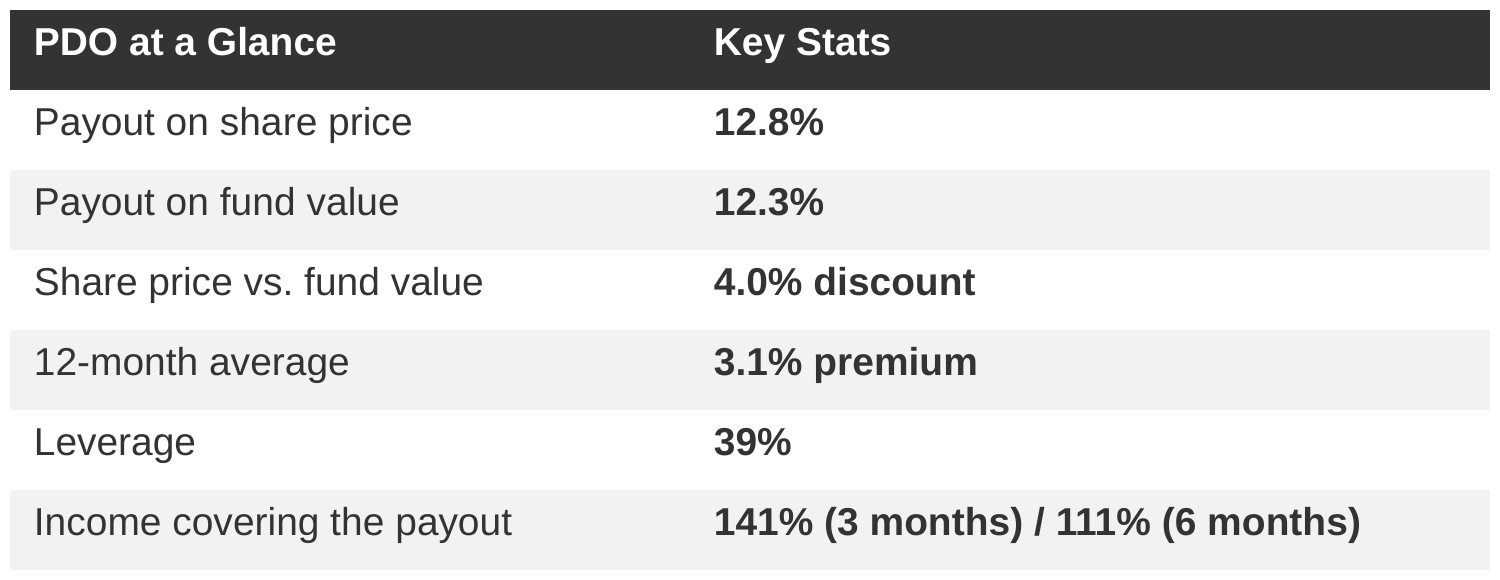
PDO uses 39% leverage as I write. Leverage can be risky in the wrong hands, but PDO’s recent payout coverage is strong: It earned $1.41 in income per $1 paid out over the last three months, and $1.11 over the last six, by PIMCO’s own estimates. That’s a lot of headroom.
As I write, the fund trades at a 4% discount to net asset value (the value of its bonds, net of borrowings), which means we can buy it for 96 cents on the dollar. This is compelling for a blue-blood bond fund like PDO, which traded at a 3.1% average premium over the past year, selling for $1.03 on the dollar. Today, 96 cents. Nice.
Why is a deal like this available?
First, the pension and insurance whales have many trillions to invest and rules that keep them out of the things PDO can own. We, as individuals, don’t have the trillion-dollar problem or the rulebook—and neither does Dan Ivascyn at PIMCO. That’s our collective edge. And remember, we can hire Ivascyn today for 96 cents on the dollar.
Second, rate worries. Over the last five years, PDO’s returns have averaged a lackluster 3.1% per year on the fund’s net asset value. The reason for the soft price is that interest rates rose from nearly zero to 5% in a hurry. Today, the damage is largely done and already priced in.
Ivascyn is a perennial winner at a game the whales don’t play. He’s the guru we want coaching up our fixed-income portfolio.

© 2026 Passive Income Live
Theme by Anders Noren — Up ↑