Temple Bar – Ageing well
Ageing well

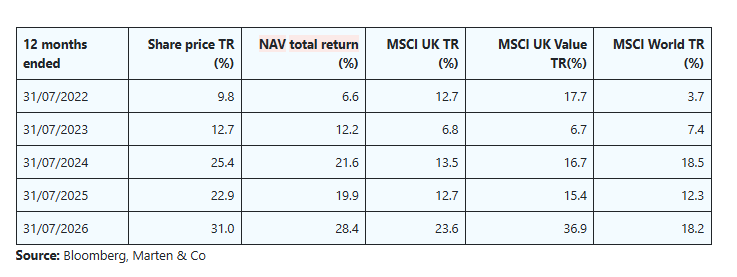
Temple Bar (TMPL) turned 100 earlier this year but shows no signs of slowing down. Its one-, three-, and five-year returns are at or near the top end of its peer group, the dividend continues to climb, and the managers continue to swim against the tide, finding interesting and attractively valued stocks in a UK equity market that is itself cheap relative to peers.
The composition of TMPL’s portfolio is always evolving. The managers are taking profits from financials, adding formerly highly-rated consumer staples stocks, and assessing opportunities in IT services. This cycle of portfolio renewal provides the foundation for future outperformance. Long may it continue.
UK equity income and capital growth
TMPL aims to provide growth in income and capital to achieve a long-term total return greater than its benchmark (the FTSE All-Share Index), through investment primarily in UK securities. The company’s policy is to invest in a broad spread of securities, with the majority typically selected from the FTSE 350 Index.

Source: Bloomberg, Marten & Co
Fund profile – classic value investing
You can access the trust’s website at: templebarinvestments.co.uk
TMPL aims to provide growth in income and capital to achieve a long-term total return greater than its benchmark (the FTSE All-Share Index), through investment primarily in UK securities. The company’s policy is to invest in a broad spread of securities with most holdings typically drawn from the FTSE 350. We have substituted the MSCI UK Index for the FTSE All-Share in this note.
TMPL’s AIFM is Frostrow Capital LLP, and it has delegated responsibility for portfolio management to RWC Asset Management LLC (Redwheel). Redwheel has been managing the trust since 1 November 2020. The lead managers are Nick Purves and Ian Lance (see page 16).
Looking for a disconnect between share prices and underling intrinsic value
Their investment approach is based on the principle that investors tend to overreact to news, becoming overly bullish or overly pessimistic about the prospects for companies and markets. This creates a disconnect between the intrinsic value of a company and its share price, which long-term, value-driven investors can take advantage of as sentiment swings back in their favour.
Avoiding value traps by favouring good quality companies
Care needs to be taken to avoid “value traps” – businesses which look cheap but are in structural decline. Instead, the managers target undervalued but good-quality companies (those with strong cash flows and robust balance sheets). These businesses are better able to withstand cyclical downturns and recover from short-term, company-specific issues. The approach recognises that aspects of ESG can have a profound impact on a company’s long-term success.
TMPL has given the managers the flexibility to invest up to 30% of the portfolio in overseas stocks. The chair noted in his most recent statement that the board and manager monitor the size of the investment universe, particularly as the UK market shrinks through takeovers and a lack of issuance. The board is monitoring the situation with a view, if necessary, to asking shareholders to increase that 30% limit.
Recent data published by Peel Hunt and E&Y highlighted that there were 28 proposed takeovers of UK companies with a total value of £59.7bn over H1 2026, which compares to seven listings raising £577m. However, for the moment, the managers believe that they have a large enough opportunity set within the UK to meet the objective.
Value works – just look at the past 100 years
100 years old on 24 June 2026
On 24 June 2026, TMPL was 100 years old. That means it has survived the Wall Street Crash, the second World War (and many others since), 70s inflation, 80s recession, the tech boom and bust, the 2008 financial crisis, and COVID and its aftermath. The trust has not always had a value focus – at launch it was “The Cable, Telephone and General Trust” – but whilst it did not adopt its current name until 1977, it already had a UK equity income focus by then. TMPL’s focus on dividend yield makes it a value investor.
At this year’s AGM and in a separate video on the subject, Redwheel took the opportunity to look at the long-term case for value investing.
Over almost a century, value outperformed in every decade bar one
Figure 1 is taken from the video and shows the annual returns of US equities, based on holding stocks that look cheaper than market averages on a book to price basis (the inverse of price to book, which is perhaps the more normal way of looking at this) and shorting the more expensive ones, over the 92 calendar years to the end of 2022. This value approach does not outperform every year, but it is a winning strategy over every decade bar the 2010s, when governments and central banks manipulated interest rates to unsustainably low levels.
Figure 1: Out/underperformance of US value by year
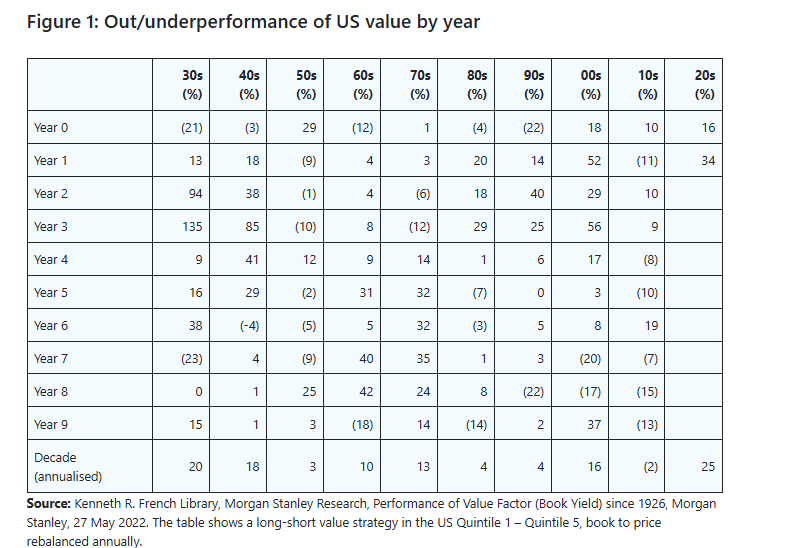
Source: Kenneth R. French Library, Morgan Stanley Research, Performance of Value Factor (Book Yield) since 1926, Morgan Stanley, 27 May 2022. The table shows a long-short value strategy in the US Quintile 1 – Quintile 5, book to price rebalanced annually.
Figure 2: Long-run cumulative performance from low- and high-yielding stocks in the UK, 1900-2025

Figure 2 – which is based on the performance of UK value stocks, this time selected on the basis of their dividend yield – reinforces this message. The scale on the y-axis is logarithmic; consistently investing in high-yielding stocks and reinvesting your dividends meant that would have made 21x the return of a portfolio focused on low-yielding stocks over that 125-year period.
Compelling UK valuation opportunity
As Figure 3 shows, UK equities had a good run over 2025, but progress has stalled since the outbreak of war between the US, Israel, and Iran. Fears about the impact of higher energy costs on inflation compounded concerns about the fiscal profligacy of the Labour government, putting upward pressure on UK borrowing costs – as illustrated by UK 10-year gilt yields in Figure 4.
Figure 3: MSCI UK

Figure 4: UK 10-year gilt yields

The revolving door at 10 Downing Street may have had some impact on sentiment towards the UK market. However, economically things have been better than some expected. UK GDP growth was 0.6% in Q1 2026 and roughly flat over April and May. UK base rates are unchanged this year. UK inflation, as measured by CPI, came in at 2.6% for the 12 months to the end of June 2026, lower than some had forecasted.
Oil prices surged in March before easing over the next few months as both sides adopted a more conciliatory tone. That weighed on TMPL’s energy stocks, but the managers had taken some profits when share prices spiked following the outbreak of the Iran war.
More recently, renewed hostilities have pushed on oil and gas prices higher again, with stockpiles dwindling, the situation may now be more serious. EU gas prices are hitting new three-year highs, for example.
UK equities remain cheap on a range of valuation multiples
Nevertheless, UK equities remain cheap on a range of valuation multiples when compared to peers, as Figure 5 shows.
Figure 5: Valuation multiples across various markets
| P/E (current)(x) | P/E (FY26)(x) | P/E (FY 27) (x) | Price/book (FY26) (x) | EV/EBITDA (FY26) (%) | Dividend yield (FY26) (%) | |
|---|---|---|---|---|---|---|
| MSCI UK | 15.11 | 13.45 | 12.84 | 2.30 | 8.41 | 3.93 |
| MSCI Europe ex UK | 18.37 | 16.96 | 15.42 | 2.41 | 11.59 | 2.94 |
| MSCI AC Asia ex Japan | 19.04 | 12.13 | 9.62 | 2.17 | 9.30 | 2.16 |
| MSCI Japan | 19.79 | 17.56 | 15.60 | 1.87 | 9.10 | 2.12 |
| MSCI USA | 25.87 | 21.59 | 18.87 | 5.13 | 15.37 | 1.14 |
Source: Bloomberg as at 31 July 2026
It is often claimed that the reason that UK equities look cheap is the relative absence of stocks in highly-rated sectors such as information technology. However, as Figure 6 shows, UK stocks are cheaper than global averages in almost every sector.
Figure 6: P/E (FY 26) ratios for UK versus global stocks

A wave of bids for UK companies underscores this sense that UK equities are undervalued. In 2026 we have seen takeover offers for Schroders, easyJet, Rotork, Tate & Lyle, UK Power Networks, Beazley, Intertek, Senior, Mitie, and SEGRO.
Portfolio
At the end of June 2026, there were 40 holdings in TMPL’s portfolio. The average yield on the portfolio at the end of June was 4.1%, which compares to 3.1% for its benchmark. The average current year P/E ratio on the portfolio was 9.7x, which compares to 12.7x for the index and the figures for price/book were 1.2x and 2.0x, respectively.
TMPL’s geographic and sector exposures are driven by the managers’ stock selection decisions and market movements.
Figure 7: TMPL geographic distribution as at 30 June 2026

Figure 8: TMPL change in geographic distribution since 30 November 2025

Since we last published, using data as at 30 November 2025, the portfolio has had more exposure to the US and consumer staples, and less exposure to cash and materials.
Figure 9: TMPL sector distribution as at 30 June 2026

Figure 10: TMPL change in sector distribution since 30 November 2025

Top 10 holdings
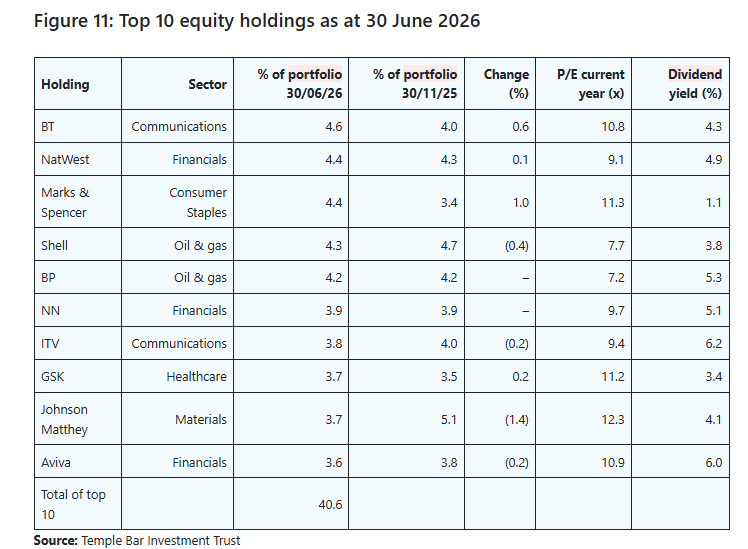
Since we last published using data as at 30 November 2025, Barclays and Smith & Nephew have both dropped out of the list of the 10 largest holdings, to be replaced by Marks & Spencer and GSK.
Leave a Reply