Dirt-Cheap Dividends of Up to 9.7%? In This Market?
Brett Owens, Chief Investment Strategist Updated: October 10, 2025
Closed-end funds (CEFs) are the last bargains left on the board. CEFs are often confused with mutual funds and ETFs, but they are different because they often trade at discounts to their net asset values (NAVs).
For contrarians like us looking for deals, this is key.
CEF trading is relatively thin. This created inefficiencies, such as select CEFs trading for as cheap as 95 or even 90 cents on the dollar.
Plus, some of them dish big dividends—like these five.
Eaton Vance Tax-Advantaged Dividend Income Fund (EVT) Distribution Rate: 8.1%
Let’s start with the Eaton Vance Tax-Advantaged Dividend Income Fund (EVT)—a CEF that buys not just common stocks, but also preferred stocks, that distribute qualified dividends. Qualified dividends are taxed at the more favorable long-term capital gains tax rates; non-qualified dividends, like those paid by most real estate investment trusts (REITs), face less favorable short-term capital gains rates.
EVT’s four managers currently hold an 80/20 blend of common and preferred stocks, with the traditional equity “sleeve” made up of about 80 predominantly large-cap stocks. Names like JPMorgan Chase (JPM), Abbott Laboratories (ABT) and NextEra Energy (NEE) would be right at home in a bog-standard dividend fund.
But while that fund would likely pay 2% or so, EVT delivers 4x that number, at 8% currently. (And it’s a monthly dividend payer, no less.)
Part of that high yield we can chalk up to leverage—management borrows additional funds to invest even more money in their picks, which amplifies yields and gains if we’re fortunate, and amplifies losses if we’re not. Leverage currently sits at about 20% of assets.
But the other part of it is the nature of those distributions. When Eaton Vance’s fund sends out a monthly distribution, dividend income is only a (small) portion of that. The rest is capital gains, usually of the long-term variety. It’s a “managed” distribution, too—the typical dividend fund’s income will vary from one period to the next, but EVT’s monthly payout hasn’t changed since April 2024, when the CEF raised its distribution by about 11%.
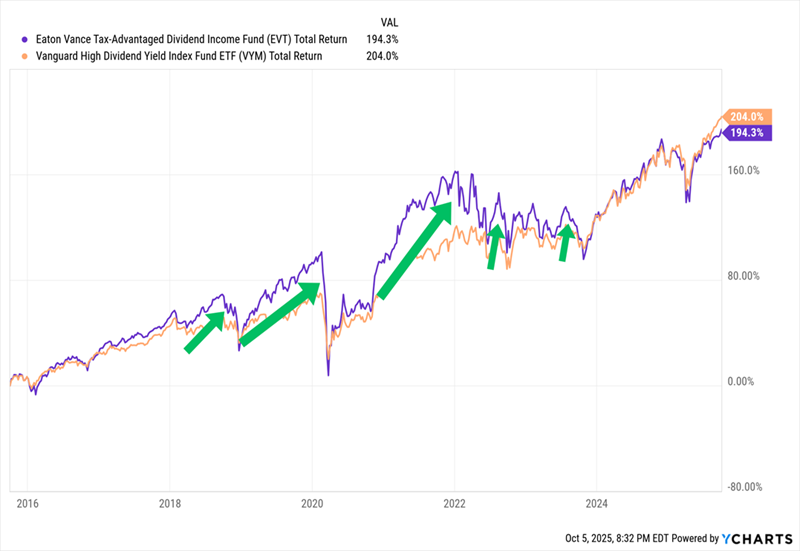
The strategy doesn’t give us much of an edge over basic dividend funds, however—at least not longer-term.
EVT’s Leveraged Nature Is Good for Quicker Bouts of Outperformance
Right now, valuation is on EVT’s side, as the fund trades at a roughly 8% discount to NAV that’s wider than its longer-term 5% average.
Options strategies are popular in CEFLand. Sometimes they’re complementary to the primary strategy, but sometimes they’re the whole point.
The latter is the case with the Eaton Vance Tax-Managed Buy-Write Opportunities (ETV). It holds a portfolio of 150, mostly large-cap stocks like Nvidia (NVDA), Microsoft (MSFT) and Apple (AAPL), then sells covered calls on a few major market indexes like the S&P 500 and Nasdaq Composite to generate income, which it distributes to its shareholders monthly.
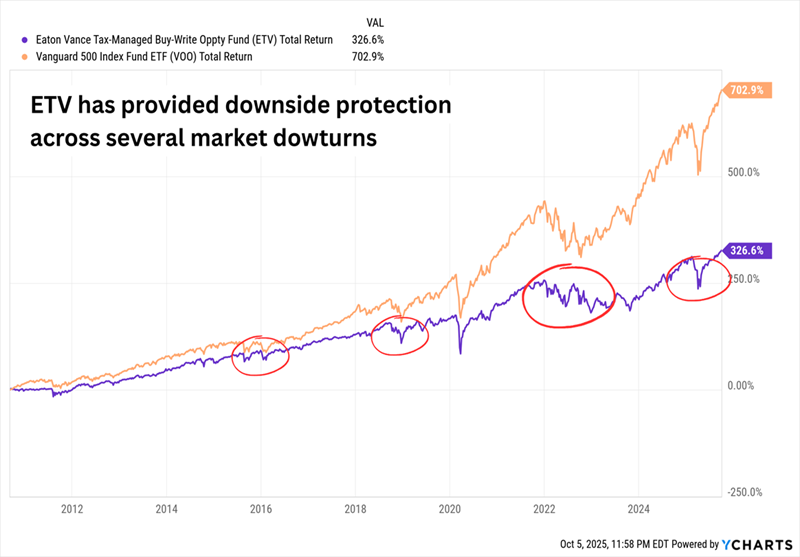
Funds that sell covered calls—especially those where the strategy revolves around it—are designed to limit downside and provide income.
Covered Calls Cap Our Upside—But Limit Our Downside Too
On that front, actively managed covered-call strategies like ETV are better than comparable plain-vanilla index ETFs.
Better still? We can sometimes buy that protection on the cheap; while ETV tends to trade on par with its NAV, we can buy the fund and its monthly distributions at 94 cents on the dollar.
BlackRock Enhanced Global Dividend Trust (BOE) Distribution Rate: 8.4%
BlackRock Enhanced Global Dividend Trust (BOE) is like a mix of ETV and EVT, with global exposure (read: U.S. and international stocks) mixed in.
Management has built a roughly 50-stock portfolio that’s currently split 65/35 across U.S. and international stocks, but that blend can and will change over time. When I’ve looked at this fund in past years, I’ve seen it hold as much as half of assets in international stocks, which is higher than the typical global fund.
But like ETV and EVT, everything revolves around blue chips. It holds U.S. mega-caps like Microsoft and Broadcom (AVGO), but also developed-market names like AstraZeneca (AZN) and even emerging-market giants like Taiwan Semiconductor (TSM) and Alibaba (BABA).
International stocks might pay more than domestics, but BOE still yields roughly 3x more than most global ETFs. It’s not leverage, which is vanishingly thin, but a covered call strategy—one that helps fund a monthly distribution north of 8%.
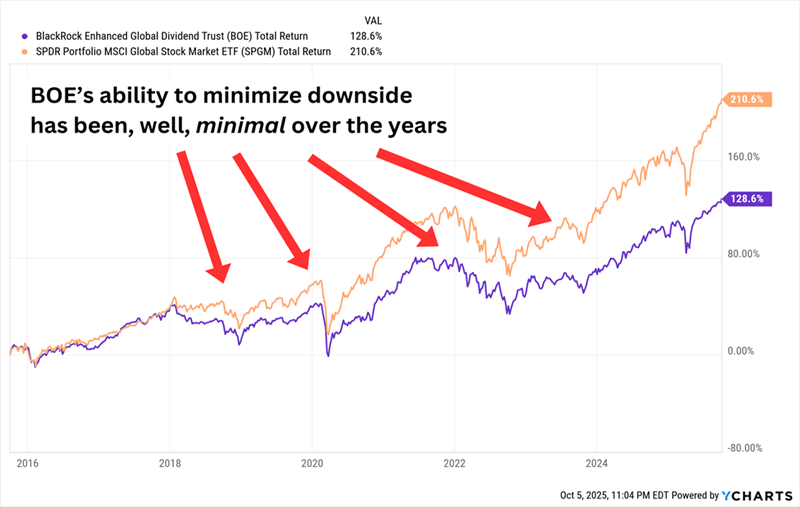
We’re not expecting to outperform a basic index over time, but we do expect less volatility and smaller drawdowns.
On That Front, BOE Is OK, But Hardly Great
An 8.7% discount to NAV would seem to give us an edge right now, but it’s a shallower markdown than its longer-term 11% average.
BlackRock Resources & Commodities Strategy Trust (BCX) Distribution Rate: 8.1%
Many sector ETFs and mutual funds are usually faithful to one slice of the market. We buy technology funds for technology stocks, and bank funds for bank stocks.
But CEFs like the BlackRock Resources & Commodities Strategy Trust (BCX) aren’t afraid to “cross the streams.”
BCX primarily invests in stocks “issued by commodity or natural resources companies,” meaning that the portfolio straddles the energy and materials sectors. The management team has assembled a tight portfolio of just 45 companies including integrated energy majors like Shell (SHEL) and Exxon Mobil (XOM), but also metals and minerals specialists like Wheaton Precious Metals (WPM) and Freeport McMoRan (FCX). The fund also may invest in derivatives, and it also sells covered calls to enhance its dividend yield.
The result?
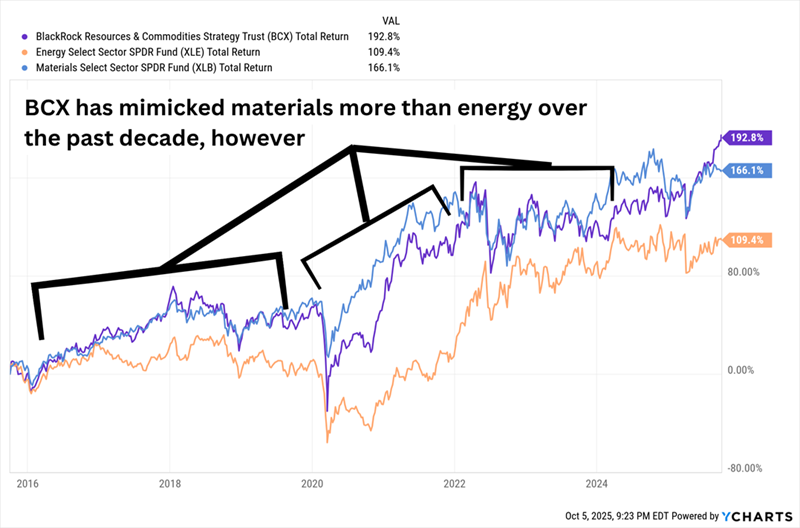
Sometimes, BCX Gives Us the Best of Both Worlds
It’s not always that way. Longer-term, BCX has struggled to capture some of the biggest moves in metals, at least in part because of its covered-call strategy.
Like with many CEFs, the best chance for success is buying while the fund is cheap. We can currently buy BlackRock’s fund for a 6% discount, but it’s not really a deal compared to its long-term average discount of 10%.
ClearBridge Energy Midstream Opportunity Fund (EMO) Distribution Rate: 9.7%
We get a more targeted energy play (and the highest yield of the bunch, at nearly 10%) from the ClearBridge Energy Midstream Opportunity Fund (EMO).
Co-Managers Peter Vanderlee and Patrick McElroy own just 20 companies. But it’s a who’s who of midstream companies (firms that operate pipelines, storage, terminals and other energy assets), including regular stocks such as Targa Resources (TRGP) and ONEOK (OKE), as well as master limited partnerships (MLPs) such as Energy Transfer LP (ET) and Enterprise Products Partners LP (EPD).
Unlike with the other CEFs mentioned above, EMO’s holdings do a lot of the talking as it pertains to the monthly distribution. MLPs are among some of the highest-yielding securities in the stock market. But the fund still pays more than most MLP ETFs thanks to high leverage of nearly 30%.
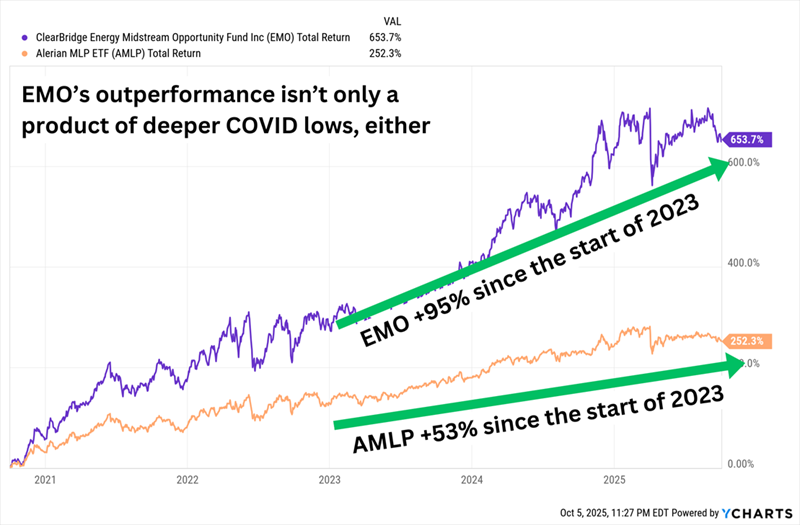
EMO trails its benchmark, the Alerian MLP Index—represented in the chart below by the Alerian MLP ETF (AMLP)—by 30 percentage points since inception in 2011. But since 2023 EMO has nearly doubled the return of AMLP, thanks to its aggressive leverage.
EMO Outperforms in an Energy Bull Market
EMO has the deepest discount on this list—we currently can buy shares at 91 cents on the dollar. But thanks to its hot performance, it’s actually expensive in historical terms, trading well above its longer-term 15% average discount.
A Fully Paid Retirement on Just $500,000?!
Some of these CEFs aren’t as cheap as we might like, but they have two vital components we need if we plan to retire on income checks alone: 1.) yields of 8%+, and 2.) monthly distributions.
A $500,000 nest egg could earn $40,000—depending on where you live, that could be enough for a fully paid retirement on its own.
You could generate a $60,000 annual dividend “salary” from a $750,000 nest egg.
And if you have managed to stow away a cool million bucks to work with, the 8% Monthly Payer Portfolio could pay you an equally cool $80,000 in dividend income every year.
But what makes this portfolio really sing is the monthly frequency of dividends. That means we’re getting paid every bit as frequently as we’re paying the bills.
No complex accounting from one month to the next. No dividend “ladders.” Just money in our accounts every 30 days or so.
It’s like getting a regular salary—without the job!
Is 4.7% the new magic number for sustainable pension withdrawals?
Our 150th episode tackles the dilemma retirees face over how much money to take out of their pensions, while trying to ensure their lifetime savings last as long as they do.
Our latest episode – our 150th – tackles the dilemma retirees face over how much money to take out of their pensions, while trying to ensure their lifetime savings last as long as they do. The famous strategy is the 4% rule, which has recently been renamed the 4.7% rule. To explain all you need to know about this rule, including why it has its critics, Kyle is joined by interactive investor’s personal finance editor Craig Rickman. The duo also run through some tactics on how to approach investing pensions in retirement.
For those who would like to see a video version of the podcast, you can now watch us on YouTube. Or if you would prefer to listen, you can do so in all the usual places.
Kyle Caldwell, funds and investment education editor at interactive investor: Hello, and welcome to On The Money, a weekly show that aims to help you make the most out of your savings and investments.
In this episode, we’re going to be covering how retirees can approach taking money out of their pensions while ensuring that their pension pots last as long as they do.
The strategy that’s become very famous is the 4% rule, which may now be rebranded the 4.7% rule, which we’ll talk about in this podcast.
The theory is that if you start off with 4%, or maybe now 4.7%, you take that out at the start retirement and then increase withdrawals each year in line with inflation. Then your investments can, in theory, stay the course for 30 years, and those withdrawals continue irrespective of how stock markets behave.
Joining me to discuss this topic is friend of the podcast, Craig Rickman, personal finance editor at interactive investor.
Kyle Caldwell: You’ve been on the podcast quite a few times. What’s different this time?
Craig Rickman: I can’t think of anything. Is that a new jumper you’re wearing?
Kyle Caldwell: It is a new jumper, but we’re also now filming the podcast. Each episode from now on, there’ll be a video version on YouTube. That’s in response to feedback we’ve had. Some listeners got in touch to say that they would like to see a video version. So, we’re going to accommodate that going forward.
But what’s not changing is that you’ll still be able to listen to us on your preferred podcast app or through www.ii.co.uk. The podcast will still be published every Thursday, and the topics that we cover will still be related to investments and pensions, as they have been for 150 episodes. Each episode gets under the bonnet of a particular topic or theme, and we discuss it for around 20 to 25 minutes.
Ultimately, we’re here to serve listeners. We’re trying to help investors make more informed investment decisions and to hopefully learn a thing or two from our podcast.
So, Craig, let’s now get on to this episode’s topic. So, the 4% rule, or maybe now it’s the 4.7% rule. Let’s take a step back. Could you explain where this rule came from and what it’s based on?
Craig Rickman: It was devised by a US financial planner, Bill Bengen, in 1994. He calculated that if you were to withdraw 4% of your portfolio every year, adjusted annually by inflation, your money should last at least 30 years, [which for] most people would span their retirement, I guess, unless you retire particularly early, or you live for a particularly long time.
So, this was based on a portfolio comprising 50% equities and 50% bonds, a balanced portfolio, I guess, leaning more towards the cautious side. It was modelled on market performance over 30-year rolling periods from 1926.
And, like you say, since then, it’s become a widely used rule for retirees and for financial planners.
Kyle Caldwell: It’s a worst-case scenario, isn’t it? The 4% rule, or maybe it’s now 4.7%, which we’ll come on to. It assumes that you take capital out of the pension in terms of the total returns rather than it being based on, say, a natural income approach?
Craig Rickman: That’s right. Yeah, it’s deemed a safe withdrawal rate. I think that’s something that it’s also known as. So, yeah, looking at a total return approach, and it doesn’t take account of adjusting withdrawals in light of changing market conditions.
Kyle Caldwell: I’ve seen comparisons made over the years between this rule and the potential retains you can get from annuities. For me, though, there’s risks that you’re comparing apples with pears. Could you go into a bit more detail about why that’s the case, Craig?
Craig Rickman: I can, yeah. So, often when comparisons are made between the 4% rule and annuities, it’s based on a level annuity. So, if you buy an annuity, which is a guaranteed income for life, essentially, you swap your pension savings for that feature.
You’ve got various options that you can choose. So, you can choose just to have an annuity, the income paid for just your life. You can have the money passed to a spouse. If you were to die, you can choose guaranteed periods. You can choose to have it uprated every year. But each feature that you build on, reduces the amount of annuity rate that’s payable.
The danger with comparing the 4% rule with a level annuity is that it doesn’t take account for the fact that the 4% rule has increasing income every year. So, it’s designed to increase in line with inflation. So, that’s the apples and pears element.
If you were to buy a level annuity right now, let’s say you’re 65 years old, you could probably get somewhere not far away from 8% a year. If you wanted an escalating annuity, so one that keeps pace with inflation, that income would drop down, initially, to be just over 5%. So, there’s quite a big difference there.
But there are other obviously other problems with comparing annuities with the 4% rule. With the 4% rule, you’re keeping your money invested, so you still have flexibility over withdrawals. There is the possibility of leaving a legacy for someone. Obviously, if that money passes to someone other than a spouse or civil partner and you pass away after April 2027, there could be some inheritance tax to pay.
But still, there is the facility to do that, and you get more flexibility with drawdown.
So, although you can kind of understand that comparisons are made, and the comparisons will always be made, but when you’re looking at income drawdown annuities, you do have to be a bit careful about how you do it.
Kyle Caldwell: For me, with annuities, the thing to bear in mind is that it’s an irreversible decision. Once you take out an annuity, you can’t change your mind.
The fact is that as you get older, you do tend to get better rates with annuities. So, I think it’s just weighing everything up, and potentially mixing and matching works for some people, but also waiting that bit longer as well to get that extra level of income.
Craig Rickman: Yeah. An approach that some people take is to use drawdown in the early stages and then move to an annuity as they get older. But I guess the good thing with it is that you get to choose the way that you want to do it.
Kyle Caldwell: Let’s now get to the 4% rule and whether it’s being rebranded as ‘the 4.7% rule’. The reason why is because the author of the research, William Bengen, has written a new book. It’s called A Richer Retirement: supercharging the 4% rule to spend more and enjoy more.
So, essentially, Bengen has carried out new research, and upped the number of asset classes he based his research on from two to seven. In a nutshell, he says that if you have a more diversified portfolio, you can do a lot better, and you can start off with 4.7%.
I’ve seen that he said the average that someone could start off with is more like 7%, but at 7%, it’s a 50:50 chance whether your retirement pot will last 30 years.
What are your thoughts, Craig, on Bengen’s updated research?
Craig Rickman: One of the interesting things is that in 2021, Morningstar did their own examination of the 4% rule and they actually reduced it. They pared it back to 3.3%. It illustrates that any kind of fixed withdrawal rate in retirement should only ever serve as a guide.
Clearly, Bengen’s update, it was 30 years [when] he did the original analysis and his update, as you say, is based on a wider spread of assets. So that’s one element.
I guess the other thing is other aspects like economic conditions and the outlook for markets for inflation, those things can change as well.
So, I think my view is that it’s a starting point for most people. But it’s really important to not only personalise your withdrawals in drawdown, but also review them regularly, to fit with the things that you want to achieve as an individual, plus taking into account what’s going on economically as well.
Kyle Caldwell: You’ve just mentioned, Craig, a couple of potential flaws in the 4% rule. It does have its critics, and you’ve just mentioned one criticism is that no one knows what investment returns or the inflation rates will be in the future.
Other commentators have pointed out that one thing to bear in mind for UK savers and investors is that the research is based on the performance of the US stock market and US bonds. Over the very long term, the US stock market has done better than the UK stock market, so that might actually flatter the level of safe withdrawal rate that Bengen has come up with.
It also doesn’t take into account fees, which is the only thing that investors can control at the outset, and it also assumes 30 years of withdrawals. Of course, some people live longer than that and have longer periods in retirement than 30 years.
And as you touched on, Craig, it’s not personalised.
Craig Rickman: Yeah. One of the other things it doesn’t take into account is tax. And we know that managing tax bills in retirement is really important. You know, the saga that’s been going on around tax-free cash illustrates the value that investors put on that element.
So, managing tax bills in retirement is really important, but the Bengen rule doesn’t take account of that. So, if you’re making withdrawals from income drawdown other than the the tax-free element, then that is added to your income tax bill and taxed at whatever rates or whatever tax band, whether it’s 20%, 40%, or 45%, that it falls into.
However, if you’re taking income from an ISA, then you get to keep the lot. So, there’s that consideration as well. But going back to the personalisation element, that’s the thing for everyone.
Everyone who is in retirement has their own set of unique circumstances, and that goes back to the points earlier around annuities and drawdown, and the decisions that people make and how they arrive at them. But it’s about finding out the right thing for you.
For some people, drawing 4% every year, uprated annually by inflation, might be the right thing to do. But for others, they might want to take a bit more, might want to take a bit less. It depends on your personal circumstances, attitude to risk, capacity to bear losses, and maybe other income sources as well. So, there’s quite a lot to consider when choosing what rate of income you want to draw from your investment portfolio.
Kyle Caldwell: As I mentioned at the start of the podcast, the theory is that you continue to take a level of income that goes up with inflation, starting off with 4% or 4.7% now, irrespective of how your investments perform.
However, you don’t have to follow that to the letter. You could, in theory, make adjustments. You could take more in good years, take less in bad years. But, Craig, in a former life, you were a financial adviser. How difficult is that for someone to do in practical terms?
Craig Rickman: It depends how reliant you are on that portion of income. If you’re heavily reliant on that income in retirement, so let’s say you get the state pension and you use the rest in drawdown and you need a certain amount every year to live the lifestyle that you want, then it’s going to be very difficult to take a lower withdrawal rate. That’s because then you have to consider what you’re going to give up during those years. What aren’t you going to be able to do?
It might be slightly easier for those who have more guaranteed income sources. So, let’s say they’ve got some defined benefit pension, maybe they bought an annuity with a portion of their pension pot, then the facility to have that flexibility to adjust withdrawals, that might be more of an option to them.
So, again, it falls back to your personal circumstances. But, yeah, for some people it’s just not that simple, is it? It’s not as simple as just saying, ‘Well, I’m just going to take less’.
Kyle Caldwell: Although we don’t know how investments will perform in the future, I think it’s fair to say that 4.7% a year, it’s not too onerous a challenge. It’s not saying it’s got to be 10%. I mean, that would be a very, very hard thing to pull off.
But even after fees, the long-term average return of UK shares based on 100 years of historical data, which Barclays publish, I think it’s about 5.5% a year in real terms, UK shares return. So, for me, it is challenging, but I don’t think it’s a really difficult challenge to achieve.
Craig Rickman: No. As many people have been saying for years, 4% is cautious, it’s not overly aggressive in any sense of the word when it comes to drawing a retirement income.
With 4.7%, if we take into account Bengen’s updated rule, it’s a bit more aggressive. It means that your investments will have to perform a bit better than they would have done otherwise. But still, exactly like you say, we’re not [suggesting] that you need these sort of outsized returns to make your money last. So, it still seems palatable.
Kyle Caldwell: In terms of what people are actually doing [when it comes to] how much they have withdrawn from their pensions, what does the data tell us, Craig?
Craig Rickman: Well, I’ve got some numbers here. This is from the Financial Conduct Authority’s most recent retirement income data, and this looks at regular withdrawal rates based on pot size during the 2024-25 tax years, so the previous tax year.
So, let’s have a look at what people have been doing with pots that are £250,000 or more. So, the two most popular groups of withdrawal rates, number one is taking between 2% and 3.99% a year. The second-most popular is less than 2% a year.
Might as well cover the third. So, the third-most popular is between 4% and 5.99% a year. So, you can see some correlation with the Bengen rule, perhaps.
These figures don’t tell the full story because they only look at individual pot sizes and not at what individuals are doing as a whole. So, it’s possible that someone could have some smaller pension pots as well that they’re taking bigger withdrawals from, and so it could be distorting the figures because it’s only looking at individual pots.
But it certainly gives us some clues on what people are doing, and by and large, people with bigger pots are tending to be reasonably cautious with their withdrawals.
Kyle Caldwell: It also reflects the very start of retirements. People don’t want to get off to a bad start. Bengen’s research does indeed show that the first decade is very important. If you retire into a bear market, for example, so, say, your investments fall by 20%, then you’re going to need a 25% gain to get back to where you were. It’s pound-cost averaging in reverse. It’s called pound-cost ravaging.
Could you explain that a bit more, Craig?
Because if you get off to a bad start, and that could involve markets performing poorly or your withdrawals are overly aggressive, that can have an enormous impact on ultimately how long your money lasts.
One of the key risks, as you mentioned, is pound-cost ravaging, and that’s most acute in the early years of retirement. Essentially, if you continue to take withdrawals from equities during periods where markets are falling, that can affect how long your money can last.
So, if we look at a very simple example. Let’s say you had a pot of £250,000 and you’re drawing 4% a year, which is £10,000. There’s a market slump, and the value of that drops to £200,000, and you still continue to take £10,000. Now your rate of withdrawal, even though in monetary terms, it’s the same, has jumped up to 5% a year. And the bigger percentage that you’re taking out of your pension, the harder it has to work to last as long as you do.
So, yeah, it’s really, really important to think about how to manage your pension withdrawals, and this goes back to that personalisation thing, how to make it specific for you, and also take account of what’s going on economically as well.
Kyle Caldwell: So, essentially, Craig, if your investments plummet, but you then decide, actually, I’ll take less, I’ll withdraw less, then you’re giving your investments greater opportunity to recover their poise over time?
Craig Rickman: That’s right. Yeah. The other option is to pause withdrawals from shares completely.
Kyle Caldwell: In terms of how you set up a portfolio, there are certain types of funds that fit the defensive description. One of those is money market funds. So, these offer a cash-like return. They invest in very low-risk bonds that have very short-term lifespans. At the moment, the yields that you can get off money market funds are around 4%.
These funds will typically yield whatever the Bank of England base rate is, give or take.
Other defensive options include wealth preservation trusts. I’ve spoken a lot about these over the years, including on the podcast. So, there’s a small number of investment trusts that invest in a very cautious manner. They have a lot of defensive armoury. They’ll invest in low-risk bonds, and have some exposure to gold. They’ll have around a third in shares, so that’s not much compared to the typical portfolio.
If you look at the historic performance of all three, when stock markets have plummeted, they’ve held up very well in terms of their overall total retains. They’ve managed to protect capital and they’ve done their job as defenders in a well-diversified portfolio.
You’ll find other cautious funds in the Mixed Investment 0-35% Shares Sector and in the Mixed Investment 20-60% Shares Sector. So, those are the sorts of investments, as well as bonds, that should be considered as a defensive part of a portfolio.
I’ve mentioned money market funds, Craig, which are a cash-like type of investments, but cash can also be utilised as part of a diversified portfolio as well.
I’ve seen you write about this cash pot trick. Could you talk us through this? My understanding is that you put a certain level of income in cash that you can then dip into when stock markets have a lean period.
Craig Rickman: Yeah. Sure. So, like I was saying earlier, if stock markets have fallen, your portfolio has fallen in value, and one way [to deal with it is] to reduce the amount of income you take, or you could just pause withdrawals completely to give your pot the best chance of recovering quickly.
One way to do this is to have a cash buffer. It can be within your pension, but it could be outside as well. The idea is to keep roughly two to three years’ expenditure in cash, so that should a market slump arrive, you can pause withdrawals from the equity portion of your retirement portfolio, dip into your cash, and that should offer some protection.
And, again, give your money a better chance of recovering quickly because you’re not drawing money out. That should give you a better chance of your retirement portfolio recovering more quickly because you’re not drawing money out when stock prices are low. So, it can be an effective way to do things.
One thing to remember when keeping a cash pot is that if you deplete it for any reason, remember to top it back up again, so that you’re protected should further market falls arrive in the future.
Kyle Caldwell: The other strategy that I often see cited is the natural yield approach. This is where you have a portfolio that’s predominantly focused on income-producing investments, so whatever the underlying income generated from the portfolio is, whatever that is each year, that’s the amount that you take. Because if you do this, then you’re not harming the capital growth of the portfolio.
Craig Rickman:In an ideal world, that’s what people would use if [they] could because what most people are looking for is a way to generate a regular income in retirement and preserve their capital.
One of the problems with the natural yield approach is the lack of certainty of income. So, if the companies that you’re investing in, or the investment trusts, are paying good dividends now, there’s no guarantee that those yields will continue. I mean, you hope so, but you don’t know.
But still, it might be suitable for those who aren’t relying on that portion of their income. So, to go back to what we were saying earlier around people with different circumstances. Unless you are heavily reliant on that income, then that can be a good approach.
Kyle Caldwell: In terms of trying to generate a consistent level of income growth at retirement, obviously there’s no guarantee, but I think the investment trust structure is better suited rather than open-ended funds.
This is because with investment trusts, they can squirrel 15% of income generated each year away – that’s income generated from the underlying investments. Then, if stock markets have a rocky patch, and there’s less dividend income being produced, then investment trusts can dip into those reserves and maintain or increase their dividend payouts during lean periods.
So, they’re called investment trust ‘dividend heroes’, and 20 have increased their dividends for more than 20 years, and 10 have increased their dividends for more than 50 years.
Of course, there’s no guarantee that these dividend streaks will continue, but because of the structure, there’s more chance of them continuing than with an open-ended fund.
With an open-ended fund, all the income that’s generated each year is returned to investors – they can’t hold anything back. So, if there’s less income coming in, then they’ll be paying less income over time.
The final point I wanted to make, Craig, is something that I spoke about earlier about how you can have a defensive buffer in the portfolio in terms of targeting certain types of funds or investment trusts that invest in a defensive manner, but there’s also a danger of being a bit too cautious, of being a bit too defensive.
Because, at the end of the day, you want your retirement pot to last. You want it to grow. It could be a 30-year or more time horizon. So, it’s very important that you also have enough exposure to growth-producing assets as well.
Craig Rickman: Yeah. The first thing to say around that is attitude to risk is very much a personal thing, and it will depend on how much risk you are comfortable taking and also the levels of losses that you have the capacity to bear.
But the other side to that is, if you’re looking to take an income in retirement and you want that income to be increasing every year with inflation, using something like the Bengen rule, whether it’s 4% or 4.7%, then you’re going to need your portfolio to grow.
Growth is going to be really important. So, it’s having a combination of your money growing, that you can then take rising income from.
So, yeah, 50% equities would be sort of the middle to the more cautious side of things. There are many people out there who will be comfortable with taking more risk than that.
So, yeah, again, it’s a personal thing, but it’s really important that your retirement portfolio is geared up to grow.
I was on two flat whites a day – which was setting me back as much as £8 – that’s £250 a month. It was only when my sister did the maths for me that I decided to call it quits and turn to instant full-time. A 90g refill pack of Nescafé Gold costs me just £3 and lasts three weeks if we’re sticking to my two-a-day habit. That’s just £51 on coffee a year, versus the £3,000 I could spend in cafés. In numbers terms, it’s a no-brainer then: my instant coffee habit saves me the equivalent of two months’ rent or a couple of weeks in Bali every year.
According to Deloitte’s study, 55 per cent of UK instant drinkers blame price hikes for ditching coffee shops – and with prices for a cup now hitting the £5 or even £6.50 mark in some parts of the country, it’s no surprise.
And instant has come a long way – banish all thoughts of cheap, burnt-tasting rubbish. Ocado, which sells more than 100 brands of instant coffee, says searches for instant are up 14 per cent, with a boom in luxury brands aiming to give the espresso machines and Aeropresses a run for their money.
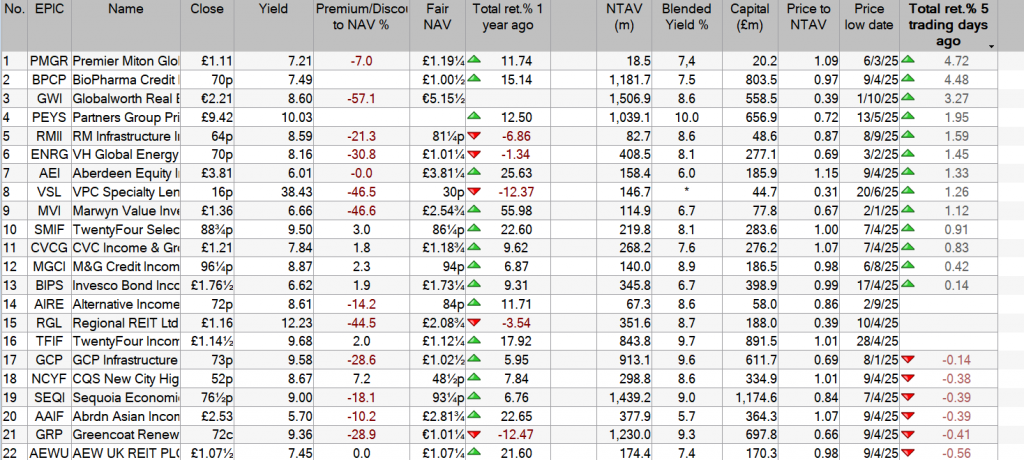
TwentyFour Select Monthly Income Fund Limited announces target beating Full Year dividend
TwentyFour Select Monthly Income Fund Limited (“SMIF” or “the Company”), the listed, closed-ended investment company that invests in a diversified portfolio of credit securities, has today announced a final dividend for the year ended 30 September 2025 of 1.302076pence per Ordinary Share, taking the total for the year to 7.302076pence per Ordinary Share, payable as follows:
Ex Dividend Date 16 October 2025
Record Date 17 October 2025
Payment Date 31 October 2025
Dividend per Share 1.302076 pence per Ordinary Share (Sterling)
Commenting on the Company’s dividend performance, Ashley Paxton, Chair of SMIF, said: “The Directors are delighted to announce a final balancing dividend of 1.302076 penceper Ordinary Share, taking the total dividends proposed for the year to 30 September 2025 to 7.302076 penceper Ordinary Share.
“The Company has beaten its target dividend every year since launch eleven years ago. It is also the third consecutive year where proposed dividends have exceeded 7.3 pence per share. This is reflective of ongoing attractive yields generally available in the market, and is testament to the expertise and active management of TwentyFour Asset Management LLP (`TwentyFour’).
“As well as its strong performance, the Company continues to trade at a premium and has grown significantly over the course of the year. Due to the availability of accretive assets for purchase, and because of shareholder demand, the Company was able to issue over 54 million new Ordinary Shares during the year, at a premium of 2% (prior to issue costs) to the NAV at issue date.
George Curtis, Portfolio Manager, TwentyFour, said: “SMIF’s portfolio is well-positioned to navigate continued market uncertainty and to take advantage of the spread tightening and attractive yields on offer. We continue to be overweight financials and Asset-Backed Securities in Europe and the UK with a bias towards shorter-term maturities, affording us flexibility in the portfolio.
“With the new issue market being very active again after the usual summer slow down, there are ample investment opportunities to take advantage of.”
FTSE 100 vs S&P 500: which offers me better value right now?
Jon Smith puts on his thinking cap when deciding whether it’s better to allocate funds to the UK or the US via the S&P 500.
Published 8 October
When investing, your capital is at risk. The value of your investments can go down as well as up and you may get back less than you put in.
Both the main FTSE index and the S&P 500 have hit fresh record highs within the past few weeks. This presents UK investors with an interesting dilemma. With new cash to put to work, does it make more sense to stick to the UK stock market, or is it worth buying AI high-flyers listed across the pond? Here’s where my head is at right now.
The case for the FTSE 100
The most obvious reason to root for the FTSE 100 is on the basis of the price-to-earnings (P/E) ratio. It’s currently at 17.7, versus 31.3 for the US stock market. Therefore, even though both indexes are near record levels, I’d argue the FTSE 100 could rally further. This is because the ratio is less stretched than in the US. Not only that, but there’s a large difference in the average P/E ratios.
Another factor is the dividend yield. The average yield of the FTSE 100 is over double the S&P 500. So let’s say that we do get a correction in global stocks before the end of the year. If an investor has a good portion of UK holdings, the income payments from dividends can help to cushion any potential unrealised losses from the share price movements. This might not seem like a big deal, but it can certainly be a helpful element when thinking about where the real value is.
Don’t forget the S&P 500
Despite the value appeal of the FTSE 100, there are reasons to like the US. The S&P 500 offers exposure to the global leaders in AI, tech, and healthcare, areas that have generated sustained compounding returns in recent years. Investors simply can’t replicate this in the UK.
The US economy has proven far more resilient than the UK’s, with lower recession risk and higher productivity growth. That’s another appeal to diversify a portfolio away from the UK.
Overall, I think the UK is better value right now, but investors can look to build a portfolio with some exposure to both, getting almost the best of both worlds.
When investing, your capital is at risk. The value of your investments can go down as well as up and you may get back less than you put in.
If an investor has £10k of idle savings and wants to put that money to work, dividend shares are one way to aim for a second income. The idea is that certain companies pay a slice of profits to shareholders each year and, over time, they can deliver a steady flow of cash.
Of course, not all companies are equal, so the right shares must be chosen and the risks weighed. When I hunt for dividend shares, I take time to consider the type of products or services that the company offers and whether they will still be relevant in 10 years time.
Beyond that, it’s important to assess the short-term viability of a company’s balance sheet, debt situation and cash flow.
Let’s take a look at what £10k invested in dividends could potential achieve.
How lucrative can it be?
Suppose £10,000’s invested for 20 years and the total return (price appreciation plus dividends reinvested) averages 8% a year. Over that time period, the pot would reach a point that an 8% dividend yield would equate to an annual income worth nearly £4,000.
Sure, it’s not house-buying money — but it’s a decent chunk of spare cash each year for holidays or retirement savings. Keeping in mind though, that dividends are never guaranteed and share prices can fall, so the total return could vary.
That’s why diversification matters — spreading money over several stocks rather than putting it all in one.
Aiming high — is an 8% return realistic?
An 8% average return’s ambitious but not beyond reach. Many dividend stocks yield 6% or 7%. With moderate growth added, total return might land in the 8%-9% zone.
One firm an investor might check out is Rio Tinto (LSE: RIO), the FTSE 100 mining heavyweight. Historically, it has offered yields of around 6% to 7% in good periods, though it recently trimmed its interim dividend so now its current yield’s closer to 5.7%
Over the past decade, the mining giant’s total return has been roughly 227% — that’s about 12.9% annualised. Yet that figure hides the bumps: mining is cyclical, and Rio’s earnings swing with commodity prices. As mentioned, weak iron-ore prices and rising tariffs hit profits and prompted a dividend cut.
Other risks include the heavily regulated mining industry, past reputational controversies, and currency fluctuations. Since most of its operations are global, exchange rates can erode dividend value in GBP terms.
Weighing risk vs return
While a stock like Rio offers an intriguing mix of yield and growth, investors must weigh up risks and spread exposure. Putting £10k into dividend shares isn’t a magic trick. But it can form a credible route toward a regular second income. When compounded over decades with shares offering both yield and growth, an 8% return’s within the realm of possibility.
Still, dividends are never certain, and sectors like mining carry extra volatility. An investor should always think about balance, diversify across companies and industries, and monitor the financial and regulatory environment.
This approach offers a pathway — not a promise — to turning spare savings into a meaningful second income.