Passive Income Live

Investment Trust Dividends

Page 158 of 453

Across the pond. Bear

Equity markets could make investors nothing in the next 10 years, warn managers

19 September 2025

Downing’s Simon Evan-Cook and Orbis’ Alec Cutler explain why investors should be wary of a downturn.

By Patrick Sanders

Reporter, Trustnet

Equity markets have posted stellar returns over the past decade but extreme valuations and historical precedent indicate that this could be about to reverse, according to managers.

Alec Cutler, FE fundinfo Alpha Manager of the Orbis Global Balanced and Orbis Global Cautious Standard funds, said this is a concern that many investors have ignored.

“People seem to think that equities are guaranteed a positive return. They aren’t. They could absolutely make zero in the next 10 years,” he said.

It seems “realistic” that equity markets deliver nothing or even lose money, thanks to the dominance of US stocks, which make up roughly 70% of the MSCI World index.

Since 2011, the S&P 500 has delivered a “spectacular” average yearly return of 14%, but this is based on unsustainable expectations, according to Cutler.

“To produce 14% again, you need valuations to go from already extreme 24x [price-to-] earnings to almost 40x earnings. You need corporate earnings, profit margins and valuations, which are near record highs, to increase further,” Cutler concluded.

The far more likely outcome is that the US equity market corrects and drags the rest of the global market down with it, he said. The average annual return of the S&P 500 is around 7%, so to return to that level, equity markets would post an average return of zero for “at least the next 10 years”.

This may sound absurd, he noted, but it has happened before. The chart below shows the average expected return on equities over 10 years, from different market valuations.
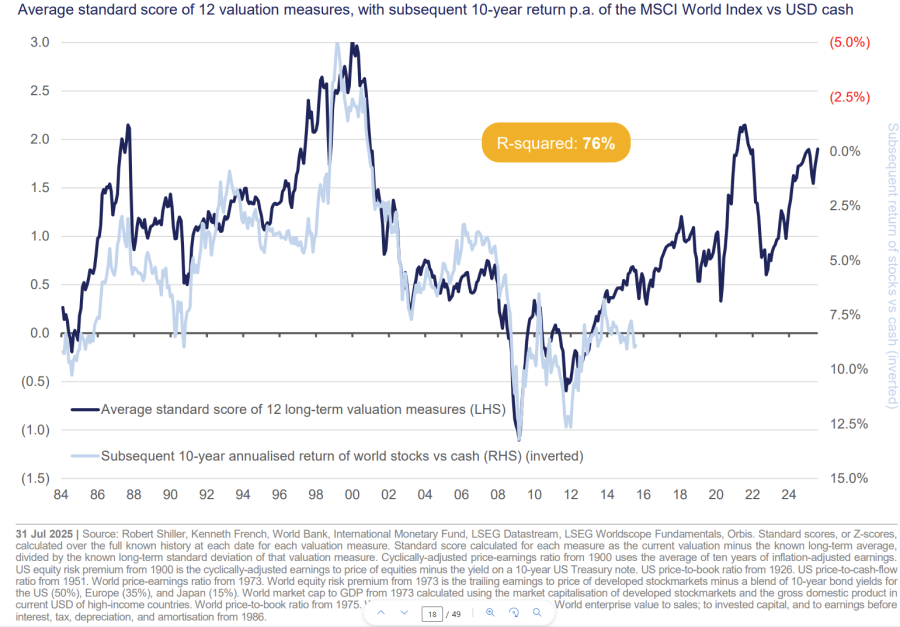
Source: Orbis Investments

“If you look back in history as far as you can get, whenever we’ve been at this level of valuation, markets returned zero over the next 10 years,” the Orbis manager explained.

On top of this, the US government’s “financial mismanagement” in relation to escalating debt levels and investors pulling out of American markets (both bonds and equities) could lead to a weaker dollar. This in turn could fuel further capital exodus from the country, sparking a US downturn.

“I would not be shocked if you get a 0% return from the global equity market from here,” he concluded.

Simon Evan-Cook, fund of funds manager at VT Downing Fox, agreed that this is a realistic concern. “There’s no God-given right that equity markets will go up every year, let alone to go up for another 15 years in a row,” he said.

While the past decade has been “mostly sunshine and rainbows” for global equities, strong performance is causing investors to develop “worrying” assumptions.

For example, many investors have concluded that active funds are no longer needed due to their underperformance compared to a surging global equity tracker.

“I completely understand why some people are asking themselves if they need an active fund, given that any attempt to do anything different has underperformed,” the Downing Fox manager said.

However, he warned that these assumptions were also around in the 1990s and backfired on investors as, in the following decade, the average global equity tracker “made you nothing”, Evan-Cook explained.

Performance of funds post 2000
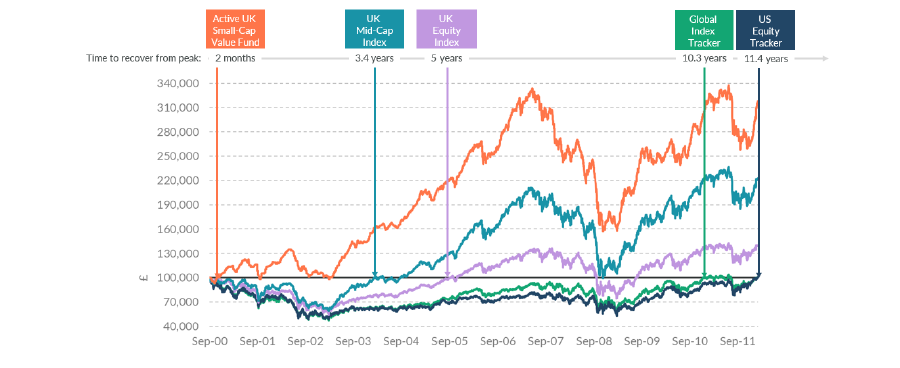
Source: Downing Fox. Total return in sterling

The tech bubble collapse in 2000 was due to the high concentration of US equities, which had outperformed and become overvalued. When they corrected, they represented 50% of the global market and so dragged most portfolios down.

As Evan-Cook noted, while current valuations are not at the 1999 peak, they are approaching it. And global markets have become even more dominated by the US than they were 25 years ago.

If North America stocks re-rate, the resulting crash might look closer to the Nifty 50 downturn in the 70s, he suggested.

Long-term valuations of US Equities
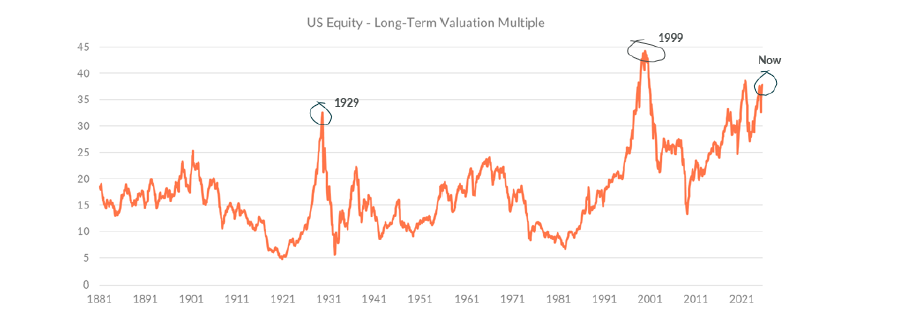
Source: Downing Fox. CAPE Ratio, January 1881 to August 2025.

“Hence why it’s not outrageous to suggest that something as apparently reliable as a global tracker could go a long time without making money,” he said.

Not even the most popular stocks on the market would be immune. For example, in 2000, some investors thought Amazon would thrive due to the emergence of the internet, while others thought it was overvalued and heading for a fall. “Both investors would have been absolutely correct,” Evan-Cook noted.

Amazon shed almost 92% of its value between 2000 and 2005, but those that sold missed the rebound, he explained. This could happen again to some of the biggest stocks in the index, “despite how transformative things like artificial intelligence are”.

“Broadly, equity markets do go up over time”, Evan-Cook said “, but they can spend long periods of time that matter to investors going sideways or down. That’s a real risk right now.”

However, he said this is mostly a risk for global equity trackers and US mega-caps, with the outlook outside of US blue-chips being much more positive, as seen in the chart below.

Expected 10-year returns of equity markets
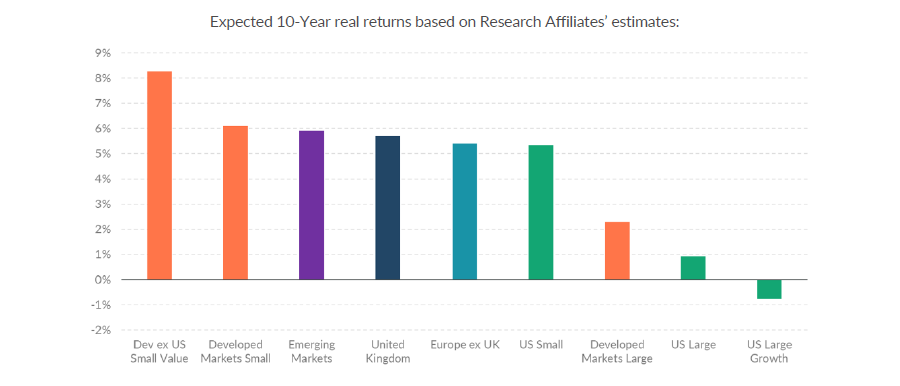
Source: Downing Fox. Research Affiliates.

Across the pond.

The chart that proves you should stay invested in the US

08 October 2025

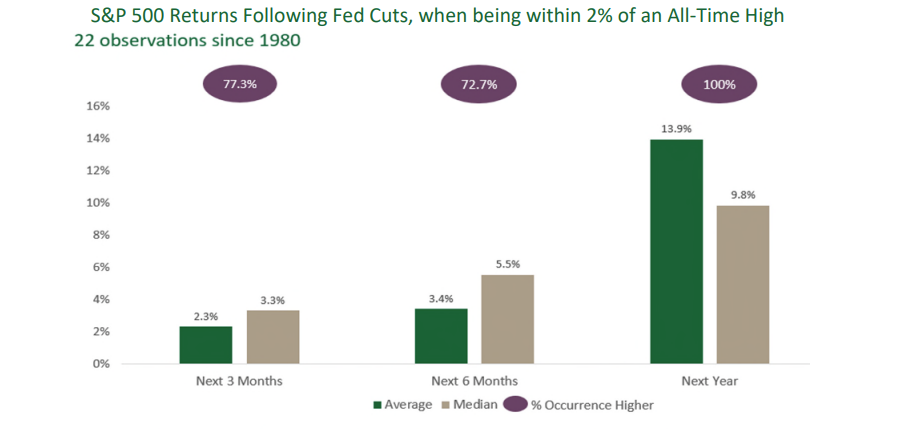
The S&P 500 has always produced positive returns when rates were cut during all-time high valuations.

By Patrick Sanders

Reporter, Trustnet

Every time the Federal Reserve has cut interest rates with markets nearing an all-time high, the S&P 500 produced a positive return over the next year.

In over 40 years of market research, that has been true in 100% of cases, with the return averaging 14%, according to research by Carson Investment Research.

As the US has finally entered a rate-cutting environment, retreating would be the wrong move, according to Gerrit Smit, FE fundinfo Alpha Manager of the Stonehage Fleming Global Best Ideas fund, who said “investors should remain invested”.

Source: Stonehage Fleming. Carson Investment Research.

So far, investors have not been following Smit’s advice. The recent Calastone Fund Flows index found £146m pulled from North American funds in the third quarter of 2025, despite the S&P 500 rallying back to form.

Experts are also worried about heightened valuations and expectations that seem to parallel earlier bubbles, with some arguing that the US equity market could return zero in the next few years.

For Smit, however, current conditions in the US seem broadly constructive, meaning that the S&P 500 could be on course for another positive return.

Growth in the US is stronger than expected, with US GDP figures for the second quarter having recently been revised upwards, he noted. While the US is a very consumption-dependent economy, the consumer is in a “decent” position, which could contribute to further outperformance.

“It’s not that corporations and households in America are stretched. Their balance sheets are in a decent position and they could spend if they wanted to – they are just choosing not to,” the manager explained.

Additionally, significant amounts of capital expenditure are still being poured into the US economy, particularly from the artificial intelligence (AI) hyper-scalers and mega-caps.

“Total capital expenditure is already on a high base and accelerating – that’s more money going into the economy, which is clearly supportive for US equities,” Smit said.

He also argued that many investors and analysts have become “far too conservative, despite broadly supportive fundamentals”. Investors, particularly those with long time horizons, were burned by the global financial crisis, where they were too optimistic, and the market’s “appetite for disappointment” has shrunk alongside it.

However, Smit argued they are underestimating the potential for the strongest stocks in the US market to surprise on the upside and continue to deliver strong returns. He pointed to the second quarter of 2025, where many companies beat already-lofty expectations despite concerns over tariffs.

Companies are just far stronger than they used to be, he noted, with strong balance sheets, positive free cash flow and limited debt that makes comparison to the dot-com bubble not entirely accurate.

“Take a company like Microsoft or Alphabet. Despite all the capex they’re putting into AI, they still have positive free cash flow, so they don’t really need to worry about debt. That wasn’t really the case in 2001 and 2002,” the Alpha Manager said.

As a result, he has pushed the North American equity allocation within his portfolio to around 79.4%, a 15% overweight compared to the MSCI ACWI.

However, while remaining broadly constructive on US equities, he warned investors not to put all of their eggs in one basket.

Some companies just do not have the free cash flow and strong fundamentals of companies such as Alphabet, with Smit highlighting some of the cloud services businesses as having to “spend fortunes on Nvidia and Broadcom” chips to compete.

Additionally, with currencies such as the Sterling and Euro all performing well, it would pay for investors to diversify their equity exposure to avoid being trapped in one currency and take advantage of some rallying markets elsewhere, he explained.

“I haven’t got any reservations about US exceptionalism. But what I do think is true is that many investors are overinvested in the US and it may pay to start thinking about diversification,” Smit concluded.

Market comment

The Telegraph

Investors make record retreat from shares as AI crash fears rise

Story by Chris Price, Alex Singleton

Investors pulled a record amount of money from company shares in the third quarter - Jason Alden/Bloomberg

Investors pulled a record amount of money from company shares in the third quarter – Jason Alden/Bloomberg

Investors pulled record amounts of cash out of equity funds during the third quarter amid concerns that an AI-fuelled boom in share prices could be poised for an abrupt halt.

Investors ran scared of “sky-high stock markets”, according to the data company’s latest Fund Flow Index.

The FTSE 100 and the S&P 500 ended last week at fresh record highs despite the turmoil caused this year by Donald Trump’s tariff campaign.

Excitement about the prospects of AI have driven markets higher, particularly in the US. On Monday, ChatGPT maker OpenAI announced a chip supply deal with AMD, sending the latter’s shares up 24pc.

Edward Glyn, head of global markets at Calastone, said it was “really unusual to see markets reaching record highs while investors are moving decisively for the exits across such a broad range of funds”.

He said: “There is a structural bias towards inflows over time as people save for their future so a prolonged period of net selling is noteworthy.”

Funds focused on the UK fared even worse, shedding £692m.

The beneficiaries were bond and money market funds, which gained £895m as investors sought out their perceived safety.

Mr Glyn added: “UK funds continue to shed capital, but selling has been more muted in the last four months in the context of a general pull-back from equities.

“Doubtless, seeing the UK market reach record levels while still not looking expensive has given some sellers pause for thought.

“But the doom loop of negative commentary on the UK economy with its dire fiscal position, soaring credit spreads, lack of growth and impending tax rises may now be winning out. Outflows are on the rise again.”

Europe defied the trend and attracted modest net buying despite the recent turmoil surrounding France’s government.

However, Sébastien Lecornu stepped down on Monday morning just 27 days after his appointment, sending the French stock market lower and its cost of borrowing higher

October Reputation for Market Turbulence ?

Why October Has a Reputation for Market Turbulence — and What the Data Really Says

Story by David Unyime Nkanta

Stock Market Risk ©Needpix.com

Stock Market Risk ©Needpix.com© IBTimes

Every October, traders brace for turmoil. From Wall Street’s 1929 collapse to Black Monday 1987, the month has long been branded the ‘jinx’ of global markets.

Yet, modern data paints a more nuanced picture: while volatility spikes in October, it doesn’t necessarily spell disaster. Instead, the month’s dark legend reveals as much about investor psychology as it does about market mechanics.Get An LV= Annuity Quote - Free & Simple Calculator - Estimate Your Annuity Income

call to action icon

A Legacy of Historic Crashes

The roots of October’s uneasy fame run deep. On 24 October 1929, known as Black Thursday, the US stock market began its descent into the Great Depression. Just days later, Black Tuesday saw even more dramatic losses.

Fast forward to 19 October 1987 (Black Monday), and the Dow Jones Industrial Average suffered a staggering 22.6% drop in a single day, marking the largest one-day percentage decline in history.

These events have firmly established October’s reputation as a period of financial instability. Although the underlying causes of each crash varied, ranging from speculative excess in 1929 to the rise of automated programme trading in 1987, their shared timing has contributed to a widespread perception that October poses heightened risks for equity markets.

What the Volatility Index Reveals

Understanding stock market stance

Understanding stock market stance© IBTimes

October has long been recognised as the most volatile month for equities. According to research from LPL Financial, the S&P 500 has experienced more daily swings of 1% or greater in October than in any other month since 1950.

This heightened activity is often attributed, in part, to the timing of US midterm and presidential elections, which typically occur in early November every other year and can introduce political uncertainty into markets.AXA Cover for Professionals - Mistakes Happen. Be AXA Ready - Small Business Insurance

In 2025, that uncertainty is compounded by an ongoing US government shutdown, with no resolution yet in sight. The shutdown has already disrupted federal operations and delayed key economic data releases, adding a layer of opacity to investor decision-making and fuelling concerns about fiscal dysfunction.

While September historically records more negative returns on average, October’s reputation for turbulence is reinforced by its association with several major market crashes. These include the Panic of 1907, Black Tuesday, Black Thursday, and Black Monday in 1929, as well as the dramatic collapse on Black Monday in 1987.

Interestingly, the triggers for both the 1907 panic and the 1929 crash emerged in September or earlier. However, the most severe market reactions were delayed until October, further cementing the month’s reputation as a flashpoint for financial instability.Fleet Of Smaller Ships - Fred. Olsen Cruise Lines - Book A British Isles Cruise

Seasonal Patterns and Investor Psychology

Behavioural finance offers one explanation for October’s reputation. Investors may be more prone to panic during this month due to its historical baggage, creating a self-fulfilling prophecy. This phenomenon is compounded by media coverage that tends to amplify fears around anniversaries of past crashes.

Yet, data from the Federal Reserve Bank of St. Louis suggests that while October is more volatile than average, it is not the worst-performing month in terms of returns. According to Visual Capitalist, which compiled S&P 500 monthly performance data from 1950 using YCharts:

September has the lowest average return at -0.72%, making it the weakest month historically for US equities.

October shows an average return of +0.91%, indicating modest gains despite its reputation for volatility.

November and December have historically strong performances, averaging +1.82% and +1.49% respectively.

These figures challenge the notion that October is uniquely dangerous. While the month is indeed volatile, it does not consistently produce negative returns. It is often followed by stronger performances in November and December, implying that perception may not always align with reality.

Modern Safeguards and Market Resilience

Today’s financial markets are equipped with tools that didn’t exist in 1929 or 1987. Circuit breakers, improved risk modelling, and diversified portfolios have made markets more resilient to sudden shocks. Moreover, central banks now play a more active role in stabilising markets during periods of stress.

In 2025, investors will navigate a complex landscape marked by inflation concerns, interest rate uncertainty, and geopolitical instability. These factors contribute to volatility, but they are not confined to October. The timing of market swings often depends more on macroeconomic developments than on the calendar.

The Verdict: Myth or Reality?

So, is October truly cursed? The answer lies somewhere in between. While historical crashes have given the month a dark reputation, the data does not conclusively support the idea that October is uniquely perilous.

Volatility tends to rise, but returns are not consistently negative. Investor psychology, media narratives, and seasonal patterns all play a role in shaping perceptions.

For long-term investors, the lesson is clear: don’t let calendar myths dictate your strategy. Diversification, discipline, and a focus on fundamentals remain the best defences against short-term turbulence. October may be dramatic, but it’s rarely decisive.

Market-beating passive income

3 high-dividend investment trusts to consider for passive income

Looking for ways to target a reliable and market-beating passive income? Consider these dividend-paying investment trusts.

Posted by Royston Wild

Published 3 October

A senior man using hiking poles, on a hike on a coastal path along the coastline of Cornwall. He is looking away from the camera at the view.
Image source: Getty Images

When investing, your capital is at risk. The value of your investments can go down as well as up and you may get back less than you put in.

The content of this article is provided for information purposes only and is not intended to be, nor does it constitute, any form of personal advice. Investments in a currency other than sterling are exposed to currency exchange risk. Currency exchange rates are constantly changing, which may affect the value of the investment in sterling terms. You could lose money in sterling even if the stock price rises in the currency of origin. Stocks listed on overseas exchanges may be subject to additional dealing and exchange rate charges, and may have other tax implications, and may not provide the same, or any, regulatory protection as in the UK.

Dividends are never, ever guaranteed. Even the most dependable dividend share can slash, postpone, or even cancel shareholder payouts when a crisis rears its head. However, investment trusts that carry a basket of equities can take the sting out of this threat.

By holding a wide selection of shares, these trusts draw income from a mix of companies, industries and regions, thus reducing the impact of dividend shocks from one or two holdings.

With this in mind, here are three top investment trusts to consider. Today, their forward dividend yields comfortably beat the FTSE 100‘s 3.3% average.

Asia focus

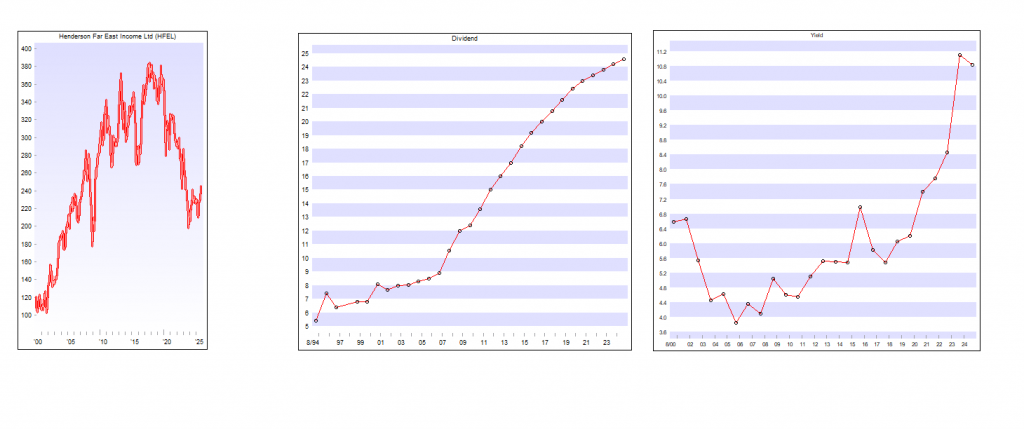
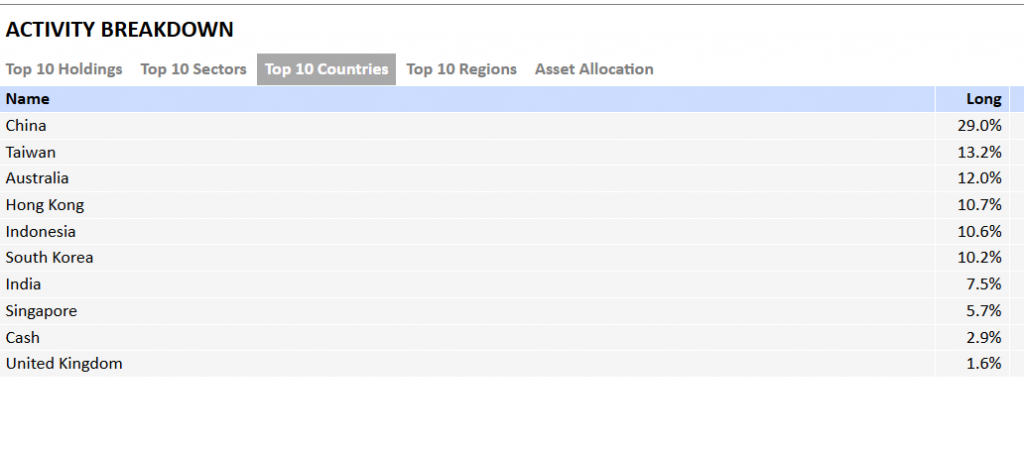
Henderson Far East Income (LSE:HFEL) seeks to capture the enormous investment potential of Asian markets. From a dividend perspective it’s a high performer, having risen annual payouts each year since 2007.

Dividends are also on the large side, and for this year its yield is an enormous 10.2%.

Focusing just on Asia means it carries greater regional risk than global funds. Yet this strategy also leaves it laser-focused on some of the world’s largest and fastest-growing economies like China, India and the Philippines.

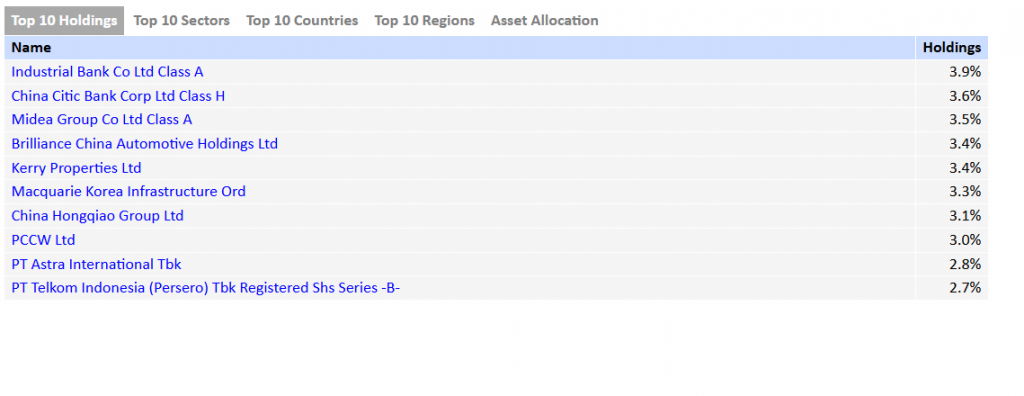
In total, this Henderson Fund holds shares in 73 different companies, ranging from cyclical shares such as Taiwan Semiconductor Manufacturing and HSBC to defensive stocks including Power Grid Corporation of India. This balances the portfolio nicely and provides a more stable return across the economic cycle.

Euro star

The European Assets Trust (LSE:EAT) has a more continental flavour than Henderson Far East Income. Some 70% of its funds are wrapped up in eurozone nations, with non-euro-trading European nations accounting for almost all the rest.

Again, this narrow regional strategy carries higher risk. But that’s not all — as with those other trusts we’ve discussed, more than 90% is allocated to shares in cyclical and sensitive industries. This can leave it vulnerable during economic downturns, as illustrated by recent dividend cuts.

The good news though, is that this allocation means each of the trusts can outperform when conditions improve. In this case, major holdings include building materials supplier Heidelberg Materials and Bank of Ireland.

European Assets Trust carries a robust 5.9% dividend yield for 2025. Despite its recent problems, I think it’s worth serious consideration.

Closer to home

The Chelverton UK Dividend Trust (LSE:SDV) has raised yearly dividends reliably since the early 2010s. For 2025, it carries a Footsie-busting 8.4%.

You’ll see this is another investment trust focused on a specific region. In this case, its success is highly geared to Britain’s economy which — if many forecasters are correct — could experience prolonged growth issues. Some 92% of it is tied up in UK-listed shares, which may be a problem.

Yet Chelverton’s ability to overcome similar issues over the last decade and deliver healthy regular growth is a good omen. Since 2020, annual payouts have grown at a decent yearly rate of 6.3%.

The trust holds shares in 66 companies in total spanning multiple sectors. These are as diverse as financial services, consumer goods, energy and telecoms, providing excellent balance.

XD Dates this week

Thursday 9 October


Amedeo Air Four Plus Ltd ex-dividend date
AVI Japan Opportunity Trust PLC ex-dividend date
BlackRock Latin American Investment Trust PLC ex-dividend date
Finsbury Growth & Income Trust PLC ex-dividend date
Gore Street Energy Storage Fund PLC ex-dividend date
JPMorgan Asia Growth & Income PLC ex-dividend date
JPMorgan Emerging Markets Investment Trust PLC ex-dividend date
Merchants Trust PLC ex-dividend date
Mid Wynd International Investment Trust PLC ex-dividend date
Primary Health Properties PLC ex-dividend date
Ruffer Investment Co Ltd ex-dividend date
US Solar Fund PLC ex-dividend date

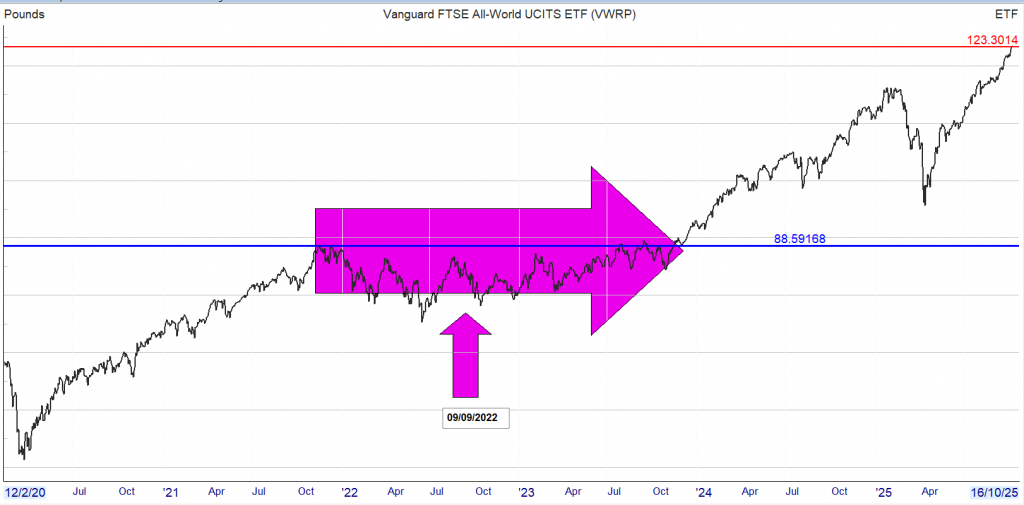
Comparison Share VWRP

The current value of the control share is £147,908, not too shabby. Using the 4% rule it would give you a ‘pension’ of £5,916.00.

Maybe now is not the best time to buy, as you can see from the chart you could have multi years of contributing to your ‘pension’ of zero, zilch, nothing.

Just saying

ALTERNATIVE INCOME REIT PLC

Over the past few years the Group has maintained an enviable record of collecting 100% of its rent. Provided this remains the case and in the absence of any unforeseen circumstances, the Board has announced that it is targeting a dividend of no less than 5.6pps for the year ending 30 June 2026. The resetting of this dividend target, which is lower than the previous year, is entirely due to increase in financing costs of the new facilities.

The new target for AIRE is a yield of around 7.75% on current buying price, so although a cut, the share remains in the Watch List.

CEF’s

Brett Owens, chief strategist of the Contrarian Income Report high-yield investing service.

To make our investments give us enough dividend cash to live on without having to invest seven figures, we really need yields in the 8% to 10% range, and even higher.

And that’s exactly what today’s overlooked 11% payer allows you to do.

And the key to our opportunity here is the fact that this isn’t just your typical mutual fund or ETF — it’s a special kind of fund called a closed-end fund (CEF).

CEFs are like “regular” stocks and ETFs in that they trade openly on the public markets.

You can buy and sell them easily from almost any standard brokerage account. And CEFs hold the same assets that ETFs hold.

You can buy CEFs that hold blue chip stocks, corporate bonds, real estate investment trusts (REITs), you name it.

The difference? Dividends! Right now, for example, the average CEF yields around 8%.

So simply by “swapping out” your ETFs and individual stocks for CEFs, you could go from, say, the 1.1% average dividend the typical S&P 500 stock pays to north of 8% — a nearly sevenfold increase!

And that’s just the yield on the average CEF. Many, like this 11% payer, deliver MUCH more — massive dividends yielding 10%+ are readily available in the CEF market.

That’s EXACTLY what makes CEFs such incredible wealth generators.

And they are proven. We’ve ridden these income generators to big gains again and again in my Contrarian Income Report high-yield investing service.

Here are just a few of the returns, including dividends, we’ve posted in CEFs over the years:

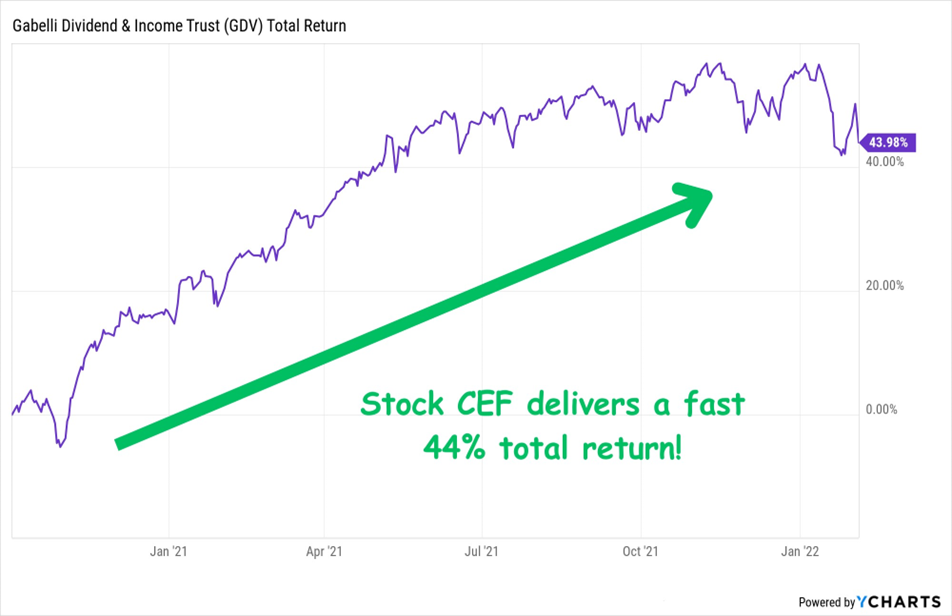
A Blue Chip Stock CEF That Returned a Sparkling 44% in 15 Months

14.6%-Paying Bond CEF Has Returned 43% in a Little Over 2 Years

A “Boring” Infrastructure CEF That Delivered a 95% Return

And talk about dividends!

That blue chip fund, the Gabelli Dividend & Income Trust (GDV), paid a healthy 7.3% when we bought.

The PIMCO Dynamic Income Fund (PDI)? An incredible 14.6% at the time.

And the utility-focused Cohen & Steers Infrastructure Fund (UTF) was throwing off an 8.8% cash stream, nearly triple what the typical utility yielded.

Do all of our calls work out like this? Of course not. I wouldn’t insult your intelligence and suggest they do. Investing involves some risk, even with top-quality funds like these, and you can lose money.

But I think you can see where I’m going here: Buying attractively valued CEFs with big dividends and savvy managers is a proven way to build wealth over time.

And the bond-buying pro running the fund we’re targeting today is, hands-down, the savviest of the bunch.

Morningstar previously named him a Fixed Income Manager of the Year, and he has been inducted into the Fixed Income Analysts Society Hall of Fame.

When he took the top job at his management company, he displaced the firm’s founder — a legend who revolutionized bond trading in the ’70s and ’80s. His long-term track record is a matter of public record.

Check out the drubbing he’s laid on the corporate-bond benchmark (orange line) through another of his firm’s CEFs since he took over as his Group CIO (knocking off that bond legend I just mentioned) a little over a decade ago (in purple):

Our Income Pro Clobbers Corporate Bonds

That’s no fluke. Here’s how one of his company’s most established mutual funds has performed since 2007, the year he became its portfolio manager:

Another Big Win for Our Bond Pro

Our manager also has a team of 4 other bond experts backing him up that, between them, boast 90+ years of experience.

So we can be sure we’re getting the cream of the crop working for us here — and that’s particularly critical in the small world of fixed income, which isn’t as “democratic” as stocks.

Well-connected managers get the first call when new issues roll out, and our top-flight manager and his team are at the top of the “to-call” list.

This, by the way, is why we always go with CEFs over ETFs for our bond picks. ETFs are simply tied to a “robotic” bond index — so there’s just no way they can compete.

« Older posts Newer posts »

© 2026 Passive Income Live

Theme by Anders NorenUp ↑