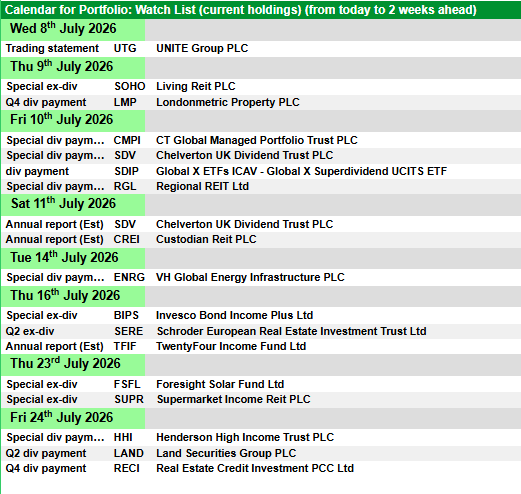
BlackRock Latin American Investment Trust PLC ex-dividend date Invesco Asia Dragon Trust PLC ex-dividend date JPMorgan China Growth & Income PLC ex-dividend date JPMorgan Emerging Markets Growth & Income PLC ex-dividend date JPMorgan European Growth & Income PLC ex-dividend date Real Estate Investors PLC ex-dividend date Schroder UK Mid Cap Fund PLC ex-dividend date Sirius Real Estate Ltd ex-dividend date Social Housing REIT PLC ex-dividend date
Which investment trusts have delivered riches this year ?
Investment trusts are often a sound investment but picking one that stands out from the crowd can really boost your returns.
So if you’re trying to decide where to invest for the second half of the year it could pay to see which trusts and sectors have outperformed the rest over the last six months.
Story by Dan McEvoy
The top funds and stocks for DIY investors have reflected a slant towards technology so far this year. Investors who followed that trend were rewarded, as technology-focused investment trusts delivered greater returns than any other sector.
According to the Association of Investment Companies (AIC), an industry body representing the UK’s investment trusts, the average investment trust performed better than the UK stock market’s flagship large cap index, returning 9.4% during the first half of the year compared to the FTSE 100’s 5.7%.
Some investment trust sectors generated average returns well above this level.
The top-performing investment trust sectors of H1 2026
Tech was the top-performing investment trust sector, returning over 50% in the first six months of the year.
“The historic boom in AI spending continued to drive returns in the first half of 2026, most obviously in the technology sector,” said Annabel Brodie-Smith, communications director at the AIC.
The ten best performing investment trust sectors in H1 202
AIC sector
Share price total return in %
H1 2026
1 yr
3 yrs
5 yrs
10 yrs
Technology & Technology Innovation
50.5
88.6
211.6
184.7
1,026.3
Asia Pacific
32.8
58.3
79.5
47.3
257.9
Global Emerging Markets
31.4
62.2
109.4
65.3
232.9
Asia Pacific Equity Income
26.0
53.2
88.1
72.5
208.1
Global Smaller Companies
23.7
32.7
64.8
12.4
206.7
Japan
18.2
32.0
62.5
39.6
178.3
Growth Capital
17.3
49.9
115.1
-40.8
N/A
Global
15.5
29.7
84.3
28.6
307.3
Commodities & Natural Resources
13.1
62.3
71.3
92.1
97.2
Infrastructure
10.7
18.9
28.4
16.0
186.3
Source: theaic.co.uk / Morningstar. Share price total return in % to 30/06/26.
Tech and AI might be more heavily represented in the top-performing investment trust sectors than is initially apparent: the theme is also having a significant impact “in Asia and emerging markets where some of the world’s largest AI hardware and microchip manufacturers are based”, said Brodie-Smith.
It has also been a good six months for global small caps, with the sector returning 23.7% on average to make it the fifth-best-performing investment trust sector. The average Japan-focused investment trust, meanwhile, returned 18.2%.
Which investment trusts were the top performers in H1 2026?
While technology was the top-performing investment trust sector overall, the top-performing individual investment trust came from the commodities sector.
Baker Steel Resources (LON:BSRT) returned over 65% in the first six months of the year. The trust is a diversified commodities investment trust; it holds producers of precious metals like gold and silver, but as of 31 March its portfolio has the largest weighting towards tungsten producers – making up 23% of assets.
The ten best-performing investment trusts in H1 2026
Investment trust
AIC sector
Share price total return in %
H1 2026
1 yr
3 yrs
5 yrs
10 yrs
Average investment trust
9.4
21.1
48.2
28.9
171.5
Baker Steel Resources
Commodities & Natural Resources
65.2
104.0
187.6
35.5
433.3
Seraphim Space Investment Trust
Growth Capital
56.5
119.4
595.6
N/A
N/A
Polar Capital Technology
Technology & Technology Innovation
53.7
96.2
223.4
201.1
1,040.8
Pacific Horizon
Asia Pacific
50.0
92.2
119.5
40.2
538.6
JPMorgan Asia Growth & Income
Asia Pacific Equity Income
45.7
76.0
108.5
56.3
310.5
Manchester & London
Technology & Technology Innovation
45.6
47.8
185.5
127.2
540.6
Fidelity Emerging Markets
Global Emerging Markets
43.5
99.2
178.5
84.9
238.3
Templeton Emerging Markets Investment Trust
Global Emerging Markets
42.9
80.9
146.0
90.5
322.3
Allianz Technology Trust
Technology & Technology Innovation
42.7
77.4
187.0
155.4
1,112.9
Schiehallion Fund
Growth Capital
39.7
73.6
213.9
8.8
N/A
Source: theaic.co.uk / Morningstar. Share price total return in % to 30/06/26.
Technology is unsurprisingly a recurring sector in the rest of the 10 top-performing investment trusts list. Three of the trusts – Polar Capital (LON:PCT), Manchester & London (LON:MNL) and Allianz Technology (LON:ATT) – are all designated to the technology and innovation sector by the AIC, while Seraphim Space (LON:SSIT) and Schiehallion Fund (LON:MNTN) have significant overlap with technology as a theme.
Asian and emerging market trusts like Pacific Horizon (LON:PHI) also featured amid the AI boom. Pacific Horizon’s top two holdings as of 31 May were chipmakers Samsung and Taiwan Semiconductor.
“The strong performance is extremely welcome, but this is only a snapshot. It is important to remember that investing is a long-term commitment and that any sector or trust should form part of a broader, diversified portfolio,” said Brodie-Smith.
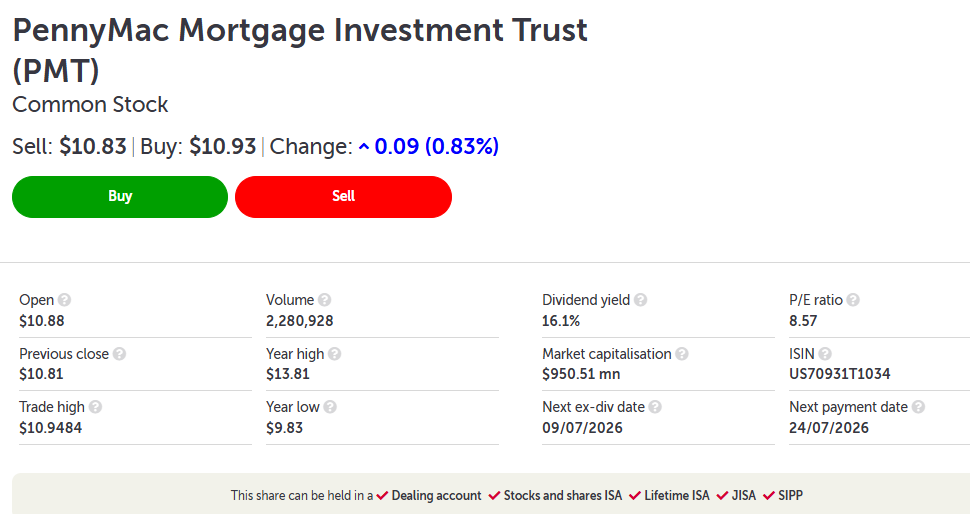
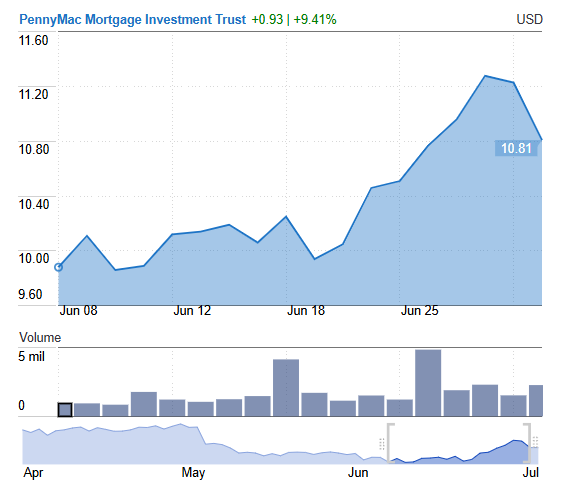
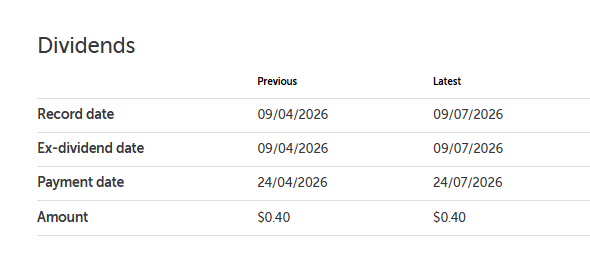
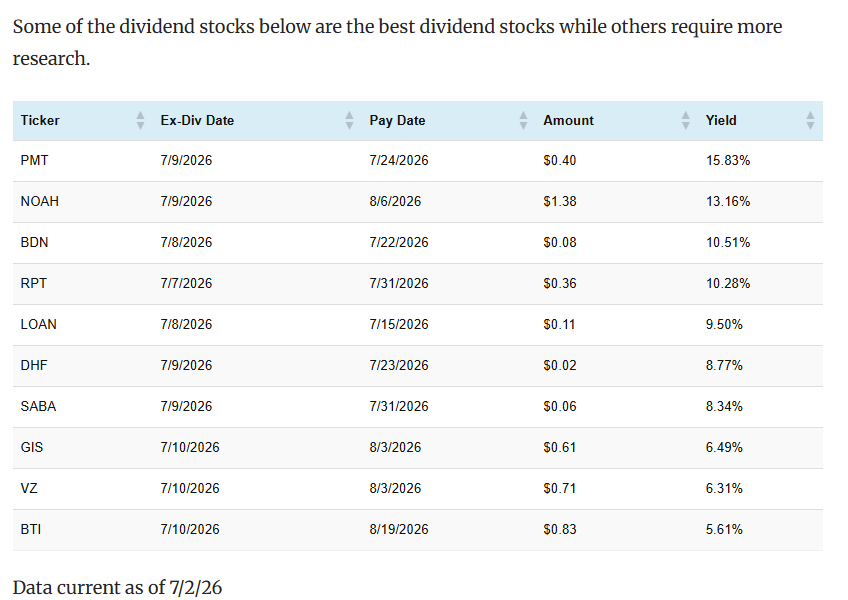
I’ve bought for the SNOWBALL 798 shares in PMT, PennymMac Mortgage Investment Trust, ahead of their xd date this week. High risk as they are quoted in U$ dollars so there is a currency charge included in the trade. The costs may outrun the benefits, so the share may have to be sold sooner than later.
Increased final* cash Offer and publication of Offer Document
1. Increased final* cash Offer
On 12 June 2026, Glenstone announced a cash offer to acquire the entire issued and to be issued ordinary share capital of AIRE that the Glenstone Group does not already hold (the “Offer“) at 70.0 pence in cash for each AIRE Share (the “Rule 2.7 Announcement“). The Offer is to be implemented by means of a takeover offer for the purposes of Part 28 of the Companies Act.
Following the Rule 2.7 Announcement, the Glenstone Board noted the announcement made by the AIRE Independent Board Committee in connection with the Offer. Although Glenstone believes that the original terms of the Offer represented an attractive liquidity opportunity for AIRE Shareholders, Glenstone is pleased to announce the terms of an increased final* cash offer in order to further enhance value for AIRE Shareholders.
Under the terms of the increased final* Offer, which is subject to the satisfaction (or, where applicable, waiver) of the Conditions and to the further terms of the Offer as set out in Part II of the Offer Document and, in the case of AIRE Shares held in certificated form, the Form of Acceptance, AIRE Shareholders who accept the Offer shall be entitled to receive:
71.4 pence in cash for each AIRE Share (the “Increased Offer Price”)
The Increased Offer Price represents:
§ a premium of approximately 2.44 per cent. to the Closing Price of 69.7 pence per AIRE Share on 14 May 2026 (being the last Business Day prior to the commencement of the Offer Period);
§ a premium of approximately 3.48 per cent. to the Closing Price of 69.0 pence per AIRE Share on 11 June 2026 (being the last Business Day prior to the Rule 2.7 Announcement);
§ an increase of 4.9 pence per share, representing an uplift of 7.37 per cent. from Glenstone’s indicative cash offer price of 66.5 pence per AIRE Share which was rejected by the AIRE Board in November 2025; and
§ an increase of 1.4 pence per share, representing an uplift of 2.00 per cent. from Glenstone’s previous cash offer price of 70.0 pence per AIRE Share set out in the Rule 2.7 Announcement. This increase is equivalent to AIRE’s target for its fourth quarterly interim dividend in respect of the financial year ended 30 June 2026 (the “Fourth Quarterly Dividend”) (which has not been declared as at the Latest Practicable Date and would not be expected to be paid until the end of August under AIRE’s usual dividend timetable).
*The financial terms of the Offer are final and will not be increased except that Glenstone reserves the right to revise the financial terms of the Offer if a third party announces a firm intention to make an offer for AIRE under Rule 2.7 of the Code.
For the reasons set out in paragraph 4 of Part I of the Offer Document, the Glenstone Board believes that the Offer continues to be an attractive liquidity opportunity for AIRE Shareholders and encourages all AIRE Shareholders to follow the instructions set out on pages 9 to 10 of the Offer Document (and, in the case of certificated shareholders, the instructions contained in the Form of Acceptance) to accept the Offer as soon as possible.
2. Publication and posting of the Offer Document
The Board of Glenstone is also pleased to announce that the offer document in relation to the increased Offer (the “Offer Document“), together with the accompanying Form of Acceptance in relation to AIRE Shares held in certificated form, has today been published, posted and made available to AIRE Shareholders (other than AIRE Shareholders resident or located in a Restricted Jurisdiction). Unless the context requires otherwise, capitalised terms that are used but not defined in this announcement shall have the meaning given to them in the Offer Document.
The Offer Document contains, among other things, a letter from the Chairman of Glenstone, the full terms and Conditions of the Offer (save in the case of AIRE Shares held in certificated form, which are also subject to the terms of the Form of Acceptance), an expected timetable of principal events and details of the action to be taken by AIRE Shareholders.
A copy of this announcement, the Offer Document and the documents required to be published pursuant to Rule 26 of the Code have or will be made available (subject to certain restrictions relating to persons resident in Restricted Jurisdictions), free of charge, on Glenstone’s website at www.Glenstonereit.co.uk/possible-offer-for-AIRE by no later than 12 noon on the Business Day following the date of this announcement.
AIRE Shareholders are encouraged to read the Offer Document carefully and in full. In order to assist with the satisfaction of the Acceptance Condition and thereby potentially obtain the economic value of the Offer as early as possible, AIRE Shareholders are strongly encouraged to accept the Offer as soon as possible. Please see the section titled “Action to be taken by AIRE Shareholders to accept the Offer” below for further information.
3. The Acceptance Condition, acquisition of AIRE Shares and AIRE Shareholder support
The Conditions to the Offer include, amongst other things, a Condition that valid acceptances have been received (and not validly withdrawn in accordance with the rules and requirements of the Code and the terms of the Offer) by no later than 1.00 p.m. (London time) on the Unconditional Date (or such other time(s) and/or date(s) as Glenstone may specify, subject to the rules of the Code and where applicable with the consent of the Panel) in respect of such number of AIRE Shares as shall, when aggregated with any AIRE Shares that Glenstone and/or any of its wholly-owned subsidiaries has acquired or agreed to acquire (whether pursuant to the Offer or otherwise), represent AIRE Shares carrying in aggregate over 50 per cent. of the voting rights then normally exercisable at a general meeting of AIRE Shareholders (the “Acceptance Condition“).
In the period since the publication of the Rule 2.7 Announcement, Glenstone has provided liquidity to certain AIRE Shareholders through the purchase of, in aggregate, 630,000 AIRE Shares, representing 0.78 per cent. of AIRE Shares (excluding shares held in treasury) as at the Latest Practicable date, in the secondary market at prices that did not exceed 70.0 pence per AIRE Share. Further details of such dealings are set out in paragraph 4.3 of Part VI of the Offer Document.
As at the Latest Practicable Date, the Glenstone Group holds 19,955,461 AIRE Shares, representing approximately 24.78 per cent. of AIRE’s issued ordinary share capital.
As set out in paragraph 5 of Part I and paragraph 7 of Part VI of the Offer Document, Glenstone has received commitments and indications of support for the Acquisition from AIRE Shareholders in respect of 6,423,000 AIRE Shares, which represent, in aggregate, approximately 7.97 per cent. of AIRE’s issued ordinary share capital, and approximately 10.60 per cent. of AIRE Shares excluding the AIRE Shares held by the Glenstone Group, in each case excluding any shares held in treasury and as at the Latest Practicable Date.
These commitments and indications of support comprise an irrevocable undertaking received from Adam Smith and a non-binding letter of intent received from Hawksmoor Investment Management (the “Hawksmoor Letter of Intent“), in each case to, among other things, accept or procure acceptance of the Offer. Adam Smith’s irrevocable undertaking is in respect of 1,900,000 AIRE Shares which represent approximately 2.36 per cent. of AIRE’s issued ordinary share capital, and approximately 3.13 per cent. of AIRE Shares excluding the AIRE Shares held by the Glenstone Group, in each case excluding any shares held in treasury and as at the Latest Practicable Date. The Hawksmoor Investment Management Letter of Intent is in respect of 4,523,000 AIRE Shares which represent approximately 5.61 per cent. of AIRE’s issued ordinary share capital, and approximately 7.47 per cent. of AIRE Shares excluding the AIRE Shares held by the Glenstone Group, in each case excluding any shares held in treasury and as at the Latest Practicable Date.
The Hawksmoor Letter of Intent had originally been given by Hawksmoor Investment Management on 11 June 2026 in respect of 4,973,364 AIRE Shares. As set out in the announcement made by Glenstone on 25 June 2026, Hawksmoor Investment Management subsequently confirmed to Glenstone that it was no longer in a position to accept, or procure the acceptance of, the Offer in respect of (i) 68,200 AIRE Shares which had been sold by Hawksmoor Investment Management or (ii) an additional 382,164 AIRE Shares which were held by Hawksmoor on behalf of private clients on a discretionary basis. Accordingly, 4,523,000 AIRE Shares remain subject to the Hawksmoor Letter of Intent as at the Latest Practicable Date.
In aggregate, therefore, Glenstone (or its wholly owned subsidiaries) holds or has received an irrevocable undertaking and a letter of intent to accept or procure the acceptance of the Offer in respect of 26,378,461 AIRE Shares, representing approximately 32.76 per cent. of the issued share capital of AIRE as at the date of this announcement.
Glenstone encourages all AIRE Shareholders to consider the Offer carefully and, if they wish to accept the Offer, to do so as soon as practicable in accordance with the instructions set out in the Offer Document.
4. Action to be taken by AIRE Shareholders to accept the Offer
The Offer will initially be open for acceptance until 1.00 p.m. (London time) on the Unconditional Date, unless the Unconditional Date is brought forward or extended by Glenstone in accordance with the Code and as further described in paragraph 16 of Part I of the Offer Document and paragraph 1 of Part C of Part II of the Offer Document.
Following the publication of the Offer Document, the Unconditional Date (being Day 60) is 4 September 2026.
AIRE Shareholders are strongly encouraged to accept the Offer as soon as possible.
The FTSE 100 is proving to be a great place to find stocks to buy. The index is up 19% over the last year, as global investors have sought top stocks with depressed valuations. And according to one major global bank, the party might last for some time yet!
UBS has noted that UK shares continue to carry “reasonable” valuations. More specifically, it notes that London stock market companies trade on a forward price-to-earnings (P/E) ratio of 12.4 times. That’s below the long-term average of 12.8
The result? UBS expects FTSE 100 shares to rise from 10,467 points to 11,000 by the end of 2026. The bank’s tipping a target of 11,300 by next June too, though it’s also suggested 12,300 could be reached if economic conditions are stronger and interest rate hikes less aggressive.
2 FTSE 100 bargains
It’s important to remember forecasts like this can change overnight. But let’s say the bank’s estimates are accurate. Which might be the best stocks to buy before a market rally?
Despite the FTSE 100’s strong gains, many top shares remain dirt cheap today. So it’s perhaps wise to assume these could remain the biggest risers if the broader index marches higher
Tritax Big Box is one top share that could outperform. As a real estate investment trust (REIT), it could especially benefit from fewer interest rate hikes. The trust’s risen 8% over the last year, though still trades at a meaty 12% discount to its net asset value (NAV) per share.
Tritax lets out warehouses and logistics properties, and is increasing its exposure to data centres as well, boosting its growth prospects. Occupier demand could weaken if the economy worsens, but it’s still a top stock to consider at current prices.
I think Prudential is another undervalued blue-chip star to consider. It’s up 12% on a 12-month horizon, but still trades on a forward P/E ratio below the FTSE 100 average, at 11.3 times. ‘The Pru’ has surged thanks to an improving outlook in its key markets such as China and Hong Kong.
Can Prudential continue rising though? Not if economic growth splutters in its Asian territories. The good news is crucial indicators such as consumer spending are improving rapidly, which bodes well for financial service providers
Will Lion Finance keep roaring?
Lion Finance (LSE:BGEO) has outperformed Tritax and Prudential shares, rising 61% over the past year. And given its cheapness, it’s another FTSE 100 star performer to consider.
The Bank of Georgia owner trades on a forward P/E ratio of 7.1 times. That makes it one of the FTSE 100’s cheapest banks (Lloyds, for instance, carries a P/E of 11.1). Meanwhile, its dividend yield for 2026 is a healthy 3.2%.
So what are the risks? Like any banking share, Lion’s profits could come under pressure if economic conditions worsen, impacting revenues and bad loans. But I’m backing it to keep rising over the long term as its emerging markets rapidly grow. Its share price has risen 687% over five years.
Brave investors have beaten beat doom-mongers this year
Opinion by Hamish Mcrae
We’re halfway through the year, and my word it’s been a bumpy ride for investors.
If you had known on January 1 there would be a war in the Middle East, with the Strait of Hormuz closed and the oil price going to well over $100 a barrel, what would you have expected to happen to US share prices?
And had you known that Keir Starmer and Rachel Reeves would be on the way out, what would you have thought would happen to markets here?
You would surely have reckoned this all looked a bit hairy and decided it was time to de-risk your portfolio. You would sell some shares and switch to cash or something safe such as government bonds. And you would have been completely wrong.
The S&P500 index, the best measure of US equities, is up 9 per cent to date, while the FTSE 100 index is up 7 per cent. Allowing for dividends it would have returned more than 8 per cent.
Government bonds, by contrast, have been disappointing. US ten-year Treasury notes yielded 4.2 per cent in January and are at 4.5 per cent. The yield on ten-year gilts – UK Government bonds – has risen from 4.5 to 4.8 per cent.
Bumpy ride: We’re halfway through the year, and my word it’s been a bumpy ride for investors
Prices move inversely to yields and on my quick tally, allowing for the interest you’d receive, you would be down between 1 and 2 per cent on your investment.
What’s the explanation? What’s the message for the second half of the year, and what does this say about investing more generally
The simple explanation of what has happened to bond prices is to note that wars cost money in all sorts of ways and push up inflation, so investors want a bigger premium to lend to government.
For equities it is more complicated, as the UK and US are very different. American shares offer both the hope of technology-driven growth and solid profits for established corporations.
British-quoted companies also offer profit growth, but the key feature is that our market, by contrast, is a bargain basement.
The message for the second half is generally positive. The professionals in New York are bullish, with Morgan Stanley and Goldman Sachs both looking for the S&P500 to rise from 7,500 at present to 8,000 by year-end.*
In London there is more caution, for example with UBS suggesting that the FTSE 100 could go to 11,000 this year, up from today’s 10,679, but not far above the peak in February just before the Middle East war of 10,935.
Insofar as it is sensible to generalise, the big fund managers and investment advisers do not seem to rate the possibility of a share crash this year as very high. The overall view is that we are in a mature bull market for equities, but the forces that will cause it to end are not yet in place.
And investment more generally? Last week we had the latest annual Global Wealth Report from UBS, which assessed how global wealth had grown in 2025.
Among the headlines were that stock market gains last year created nearly a million more dollar millionaires. Also that global personal wealth rose nearly 11 per cent. And that Australia now ranks third-highest for median wealth.
As well as, more dismally, that allowing for inflation Britain had the sharpest fall in wealth of any country in the survey.
That’s because for most of us our homes are our biggest investment and since 2020 house prices have failed to keep pace with inflation.
Unpicking all this, the message I take away is that the enemy of people who want to try to build wealth, or even become comfortable enough not to have to worry about money, is indeed inflation.
It is not crashes in share prices, though they will inevitably come, for eventually global equities will produce positive real returns.
As long as people start saving as early as they can, keep adding to their pot and keep reinvesting the proceeds, compound interest will enable them to build real wealth – not to become billionaires but to be ‘the millionaire next door’.
But there’s another enemy. Governments not only permit inflation, they tax away paper gains even though these are only compensating for inflation and not real gains at all.
* Historically the S&P moves higher after the American Mid Elections.