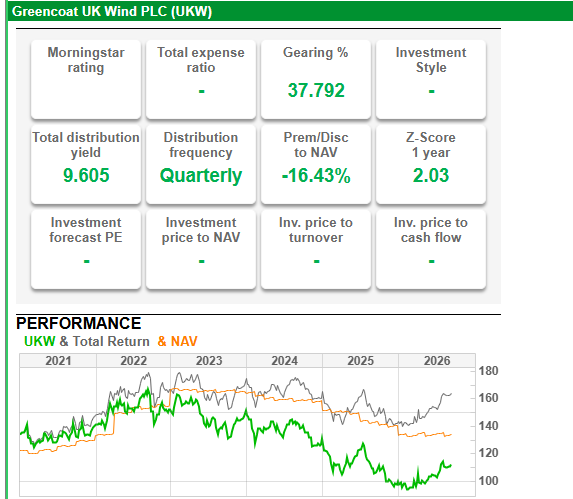
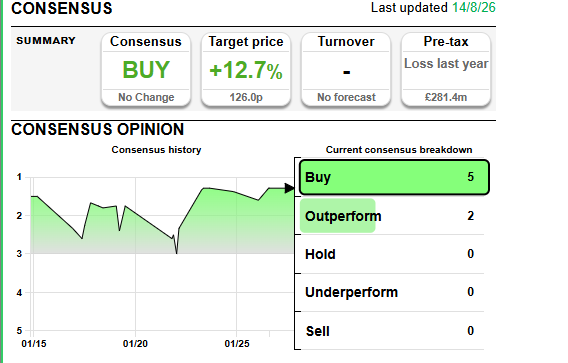
Remember the SNOWBALL does not trade The Target Price but buys shares that pay a dividend then uses those dividends to buy more shares.
Investment Trust Dividends
Remember the SNOWBALL does not trade The Target Price but buys shares that pay a dividend then uses those dividends to buy more shares.
Thursday 17 September
BlackRock World Mining Trust PLC ex-dividend date
Fidelity European Trust PLC ex-dividend date
Regional REIT Ltd ex-dividend date
Unite Group PLC ex-dividend date
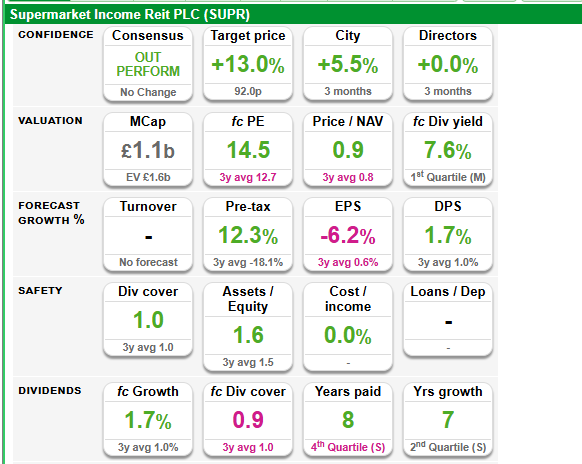
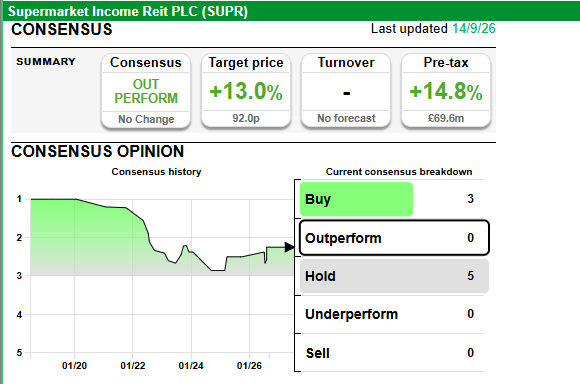
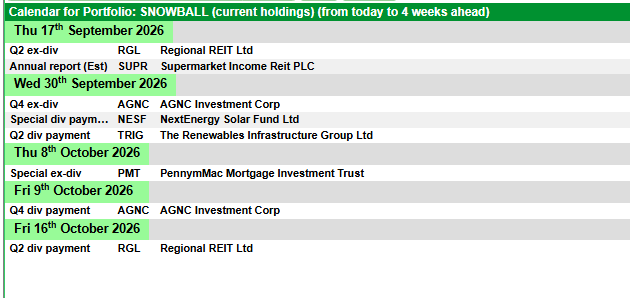

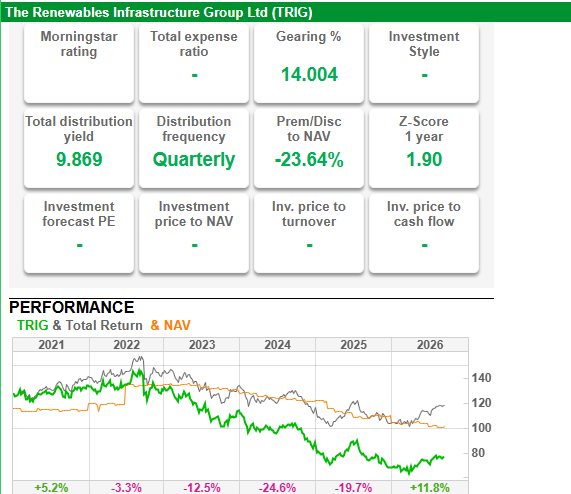
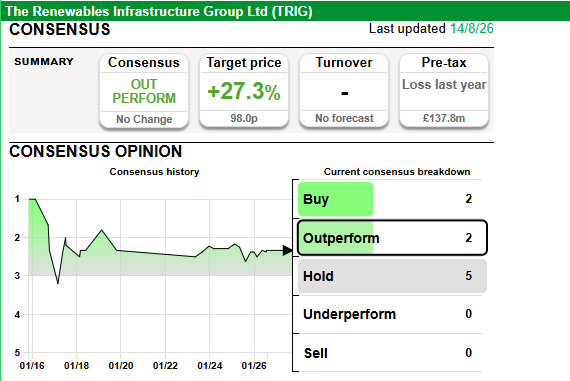
Several dividends to be received to be re-invested in shares that pay a dividend to earn more dividends to re-invest.
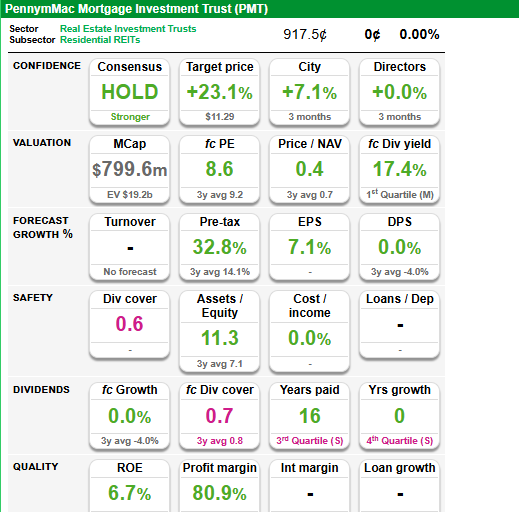
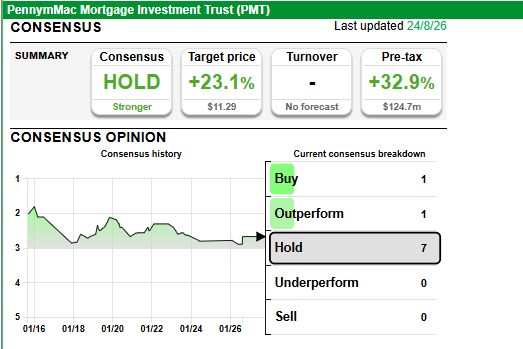
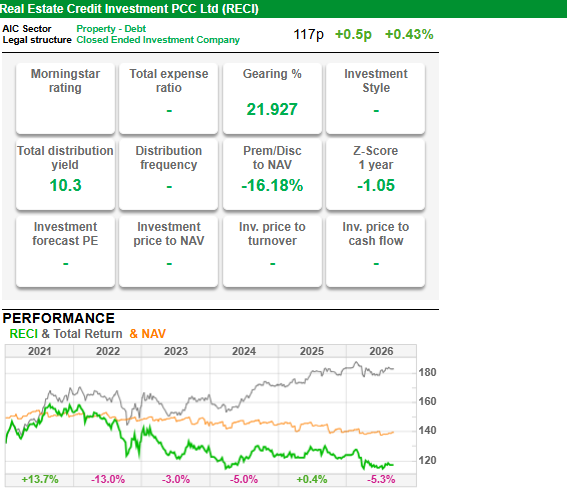
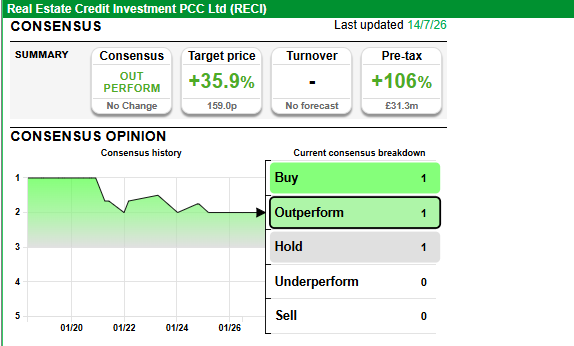
Remember if you trade, you are buying for the yield and not the target price as that is unlikely to be achieved.
Story by Steven Smith

A young Asian woman and her daughter are happily saving coins in a pink piggy bank on a table at home.© simon2579 via Getty Images
Parents could potentially amass a fund of approximately £65,000 for their child through one straightforward early action, an expert has revealed.
While many believe that accumulating wealth involves selecting winning stocks, forecasting market trends or making a few shrewd financial choices, one specialist suggests the genuine secret is far more mundane – it’s simply time. Paul Denley, CEO at London-based Oakham Wealth Management, highlighted that the strength of compound growth remains one of the most undervalued forces in personal finance.
He explained: “As (entrepreneur) Naval Ravikant said, ‘all the returns in life, whether in wealth, relationships or knowledge, come from compound interest’. That observation applies remarkably well to investing because long-term financial success is often not about finding the next hot stock. It is about allowing compounding to work quietly over time.”
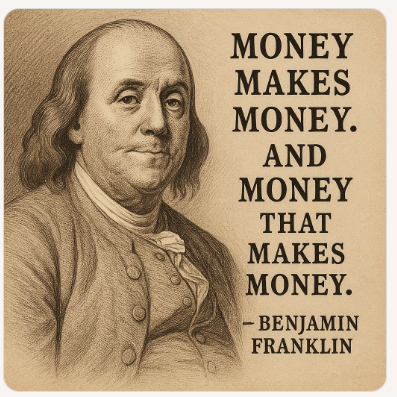
Compounding refers to the mechanism whereby investment profits themselves generate additional returns. Benjamin Franklin famously characterised it as: “Money makes money. And the money that money makes, makes money.”
Mr Denley emphasised that this straightforward concept underpins the effectiveness of long-term investing.
He elaborated: “The mathematics are extremely powerful. Returns generate further returns, creating a snowball effect that becomes increasingly significant as time passes.
“The challenge is that compounding is almost invisible in its early years. Progress can feel slow and the real benefits often only become obvious much later.”
That’s precisely why beginning early can yield such remarkable results. A parent putting aside £150 monthly into a Junior ISA from their child’s birth could accumulate approximately £65,000 by the time they reach 18, based on an average yearly return of 7%. When adjusted for inflation, that sum would equate to roughly £50,000 in current terms.
Mr Denley explained: “The exact contribution matters less than the principle. Whether someone invests more or less than £150 a month, the important point is that the earlier investing begins, the longer compounding has to do the heavy lifting.”
This same logic extends to pension savings. Many people concentrate almost exclusively on contribution amounts, when frequently the more crucial factor is timing. An additional decade of compound growth can sometimes outweigh attempting to make substantially larger payments later on.
Mr Denley said: “People often think they can make up for lost time later, but time itself is the most valuable ingredient. Once those early years have gone, you cannot get them back.”
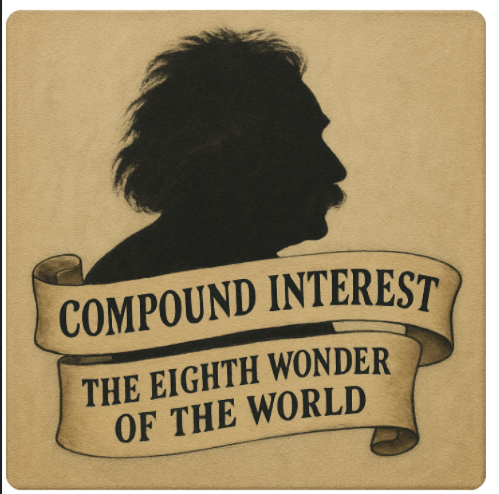
Warren Buffett, who amassed his fortune across more than 70 years, famously attributed his wealth to “a combination of living in America, some lucky genes, and compound interest”. According to Mr Denley, the key takeaway isn’t that compounding generates rapid wealth, but rather that it rewards patience, discipline and consistency.
He concluded: “Compounding is not exciting day to day. It does not feel dramatic. But, over long periods, it can be transformational.”
In an investment landscape where short-term predictions, market chatter and daily news cycles reign supreme, Mr Denley reckons countless investors are missing the most straightforward advantage at their disposal.
He explained: “The greatest edge most people have is not prediction. It is time. Start early, stay invested and allow compounding to do the heavy lifting.”

With yields as high as 5.6%, these three dividend stocks have proven to be reliable income producers through good times and bad.
By Reuben Gregg Brewer– Sep 12, 2026
The stock market is trading near all-time highs. JPMorgan Chase
CEO Jamie Dimon is warning Wall Street about tectonic plates beneath the financial surface that could “cause meaningful disruptions when they shift or collide.” Some of the risks include geopolitical conflict, inflation, and elevated debt levels. If you are looking for high-yield dividend stocks in this environment, you need to focus on resilient businesses.
Here’s why Enterprise Products Partners (EPD-1.09%), Realty Income (O-0.12%), and PepsiCo (PEP-0.24%) should be on your short list in September. And, the best part, is that the lowest yield on this list is roughly 4x higher than the miserly 1% yield on offer from the S&P 500 index (^GSPC+0.86%).

Image source: Getty Images.
Of the high-yield investments on this list, Enterprise Products Partners has the shorted streak of annual distribution increases at 28 years. However, that’s about as long as the midstream master limited partnership (MLP) has been publicly traded. Real estate investment trust (REIT) Realty Income’s streak is 31 years. And PepsiCo, one of the world’s largest consumer staples businesses, has an incredible 53-year track record, making it a Dividend King.
As of this writing, it is 2026, so each of those streaks started before the dot-com crash and survived it. They continued through the Great Recession, when there were legitimate concerns that the global financial system would collapse. And they got through the coronavirus pandemic, when governments around the world effectively shuttered their economies. If you need a dividend you can count on, these three high-yielders have proven they can keep paying through extreme adversity.
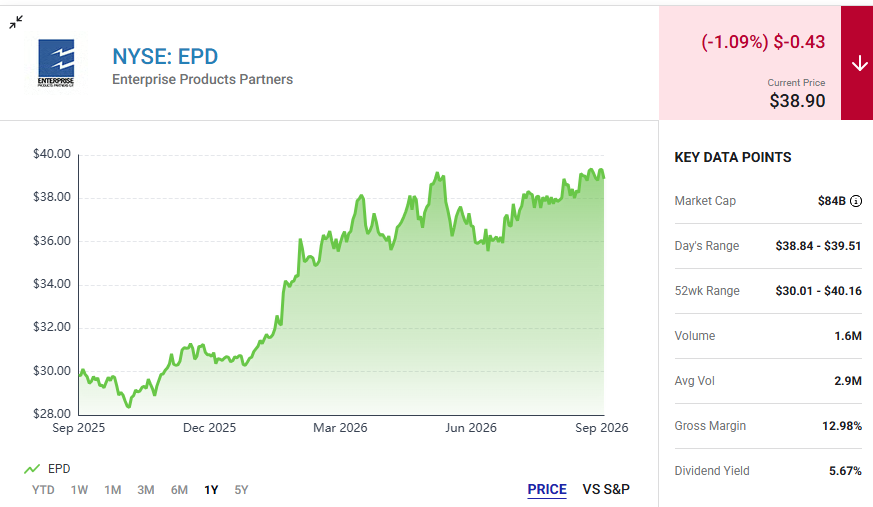
North American midstream giant Enterprise Products Partners has the highest yield at 5.6%. The MLP operates in the highly volatile energy sector, but it is a very boring business that throws off reliable cash flows. That’s because its collection of energy infrastructure assets, such as pipelines, helps to move oil and natural gas around the world. It charges fees for the use of its assets, so the prices of oil and natural gas aren’t the driving force of its business; demand for these vital fuels is.
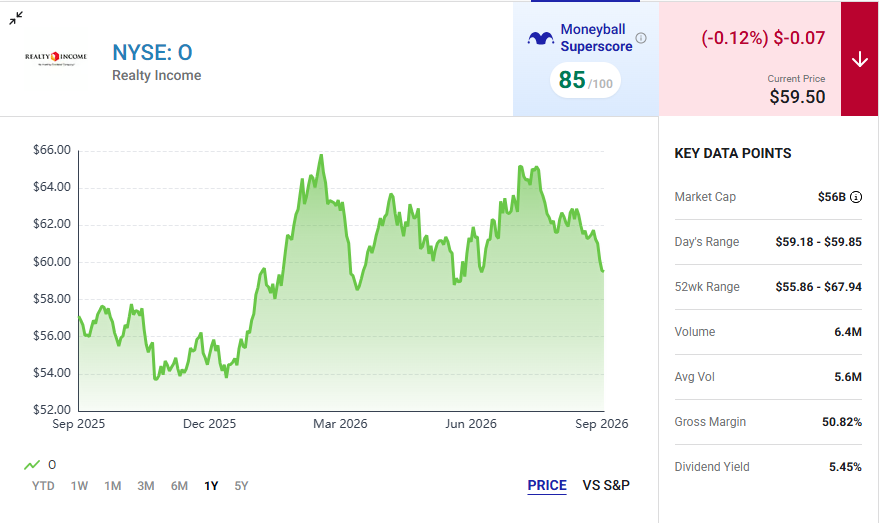
Realty Income’s 5.3% yield is backed by a massive portfolio of single-tenant net lease properties. A net lease requires the tenant to pay most property-level operating costs, thereby reducing Realty Income’s expenses and risk. Meanwhile, the portfolio includes over 15,500 assets spread across North America and Europe. While roughly 80% of its properties are retail, that is the most liquid net lease asset class. Its industrial exposure and other properties, such as casinos and data centers, add meaningfully to diversification. And the REIT has been expanding its reach into debt financing and institutional asset management, complementary areas that add even more diversification.

PepsiCo
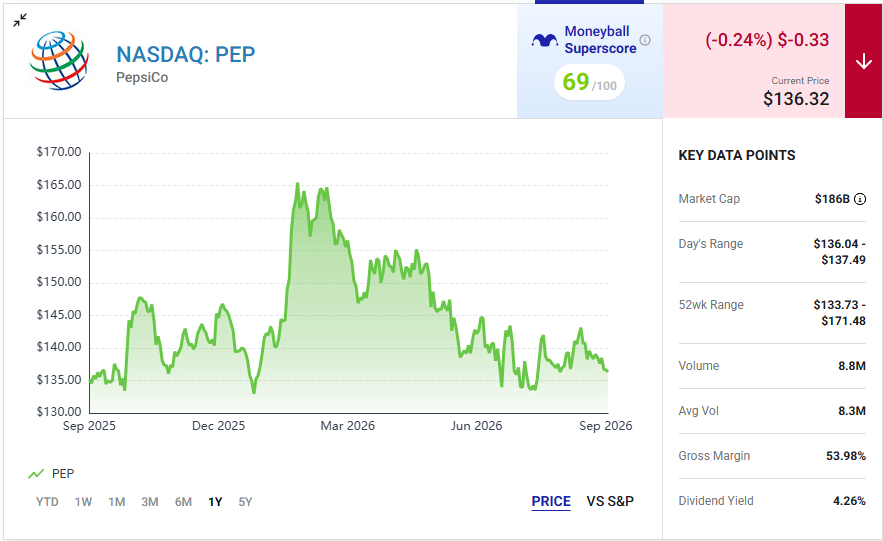
PepsiCo has the most impressive streak by far, as its 53 years of increases puts it on the Dividend King list. The current 4.3% yield is historically high, as the consumer staples giant faces headwinds. However, PepsiCo has successfully navigated headwinds many times over the past 53 years. It is highly likely to do so again. One key feature here is the company’s diversified business, with industry-leading positions in beverages, snacks, and packaged food products.
Of the three high-yield dividend stocks here, PepsiCo is probably the riskiest choice. But that speaks more to the low-risk nature of Enterprise and Realty Income than to the risks posed by PepsiCo. With well-above market yields and incredible dividend histories, this trio could enhance your income stream while, at the same time, helping you sleep at night. Now, before the tectonic plates Jamie Dimon warned about crash together, is the time to add reliable dividend stocks like these to your portfolio.


Brett Owens, Chief Investment Strategist
Updated: September 9, 2026
Let’s discuss an investor who banks a $34,533 dividend check on the first of every month. From one fund alone!
Think you can survive on $34,000 in passive income per month, too? From just one position?
Of course you do. And right now, you and I can buy this monthly payer for a better price than the big shot! (Who, by the way, keeps working long days—not what many of us would do with a $34K monthly paycheck!)
I’m talking about Emmanuel “Manny” Roman, the CEO of PIMCO. Yes, that PIMCO, the most famous bond shop in the world. It was the old home of Bond King Bill Gross, who has since been deposed.
Manny grew up in Paris, the son of two artists. He spent 18 years at Goldman Sachs. Now, he runs PIMCO.
In other words, a regular dude just like you and me, right? Ha! Yeah right, but here’s the thing. We can learn from Manny and lock in a better yield for ourselves than he did!
First, we learn. Then, we earn. Let’s look at Manny’s previous buys. In September 2022, the S&P 500 had its worst day since June 2020, in the thick of COVID. Manny’s fund was down 25% from its IPO. Most bond funds were getting waxed as the Fed jacked up interest rates and the bond market feared forever inflation.
PIMCO’s big boss bought the fear then and also the following spring. Regional banks like Silicon Valley Bank were going down—Manny bellied up to buy 100,000 more shares.
And he never sold. Neither has any other PIMCO insider: Not one has reported selling a PDO share in five and a half years of filings. It’s not that he won’t sell. Back in 2019 our hero unloaded 100,000 of another PIMCO fund, this one at a loss. Shot it down in cold blood.
Yet this fund, he’s put $4.3 million into! (I know, relatable, right? Ha.)
The fund is our own PIMCO Dynamic Income Opportunities Fund (PDO), which we bought in May 2023, a little after Manny, at a few dimes higher.
Manny’s average cost is $16.04 per share, giving him a 9.6% yield. But PDO, as I write, yields 12%, nearly three points above Manny’s dividend average!
The thing is, you and I can buy PDO just like a normal stock. It’s a closed-end fund, or CEF, which means it trades on the exchange. The keyword here is “closed,” which means it doesn’t create and redeem shares on demand like an ETF. So PDO can trade above or below what the bonds in its portfolio are actually worth (net of any debt). When it trades below that, you and I score a sweet deal because we secure more dividend for each dollar we invest—and snare a margin of safety to boot.
The fund has paid $0.1279 on the first of the month every month since July 2022. PDO usually trades at a premium because, hey, who doesn’t like a big yield? But it actually sits at a discount right now. Unusual.
PDO owns bonds that are spicier than your stodgy old pension fund can usually buy: mortgages, overseas bonds, and “junk-rated” company bonds. These tend to be below investment grade. Pension mandates usually bar them, so the value gets left on the table. We snatch it up!
How does the yield reach 12%? PDO borrows money, or in suit-speak, uses leverage to buy more bonds, borrowing 38 cents of every dollar it invests. Money costs about 5% today. Not exactly low cost, but it’s a winner for PDO because it buys bonds that yield more than 5%.
Now, why does PDO trade below what its bonds are worth, for 98 cents on the dollar? This dividend payer is a relative minnow at nearly $2 billion in assets, too small for the Wall Street whales to consume.
If you are Goldman Sachs and you’re looking to put your wealthy clients into it, you can’t just splash $50 million to $100 million in there, right? (About $8 million worth of PDO trades per day, so a $50 million order is a full week’s worth of volume! Too heavy for the market to absorb. It would push the price up and the yield down!)
But it’s plenty liquid for us—and Manny, who invested $4.3 million. We don’t move the price.
We can invest like Manny. You can put $10,000, $20,000, $50,000, or even $100,000 into this fund, no problem on the liquidity side. At the current 12% yield, every $100,000 invested mails you about $1,030 a month.
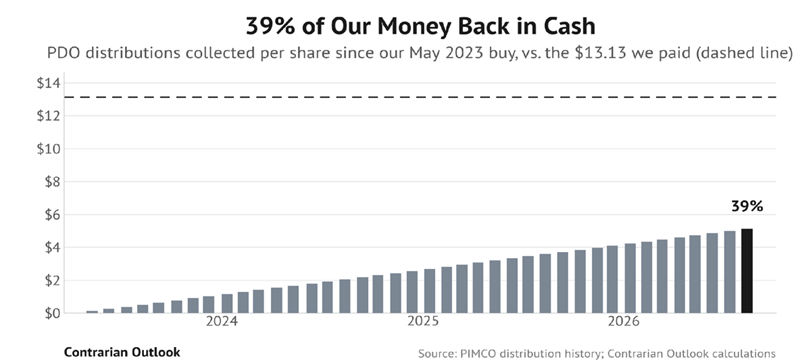
It’s worked out well for my Contrarian Income Report subscribers. We bought the fund in May 2023, after Manny’s most recent purchases. We’ve collected 40 dividend payments to date, $5.12 on our initial purchase of $13.13. That’s a sweet 39% of our money already back in cash.
The PDO “payout sausage factory,” though, is not for the faint of heart. Its income is lumpy, sometimes way over what it needs to pay us and sometimes below. For example, one-quarter of August’s check was investors’ own money handed back, called return of capital.
Coverage was ugly in January, when PDO earned only about 60% of its payout. Over the last three months it earned well above 100%. That’s what we care about. And you can be confident we watch Manny’s action closely for clues of any changes.
For now, the insider money says: “Buy!” His colleague Dan Ivascyn—Bond King Bill Gross’s successor—also has a big stake generating $31,975 in monthly divvies. That’s two huuuuge votes we’re happy to side with.
The fund now trades near fair value of its bond portfolio. Historically, it’s fetched a premium. Let’s take the cue from Roman and Ivascyn. After all, Manny’s check lands on the first of the month. So will yours, if you buy PDO.
Inefficient markets like the one we have in CEF land are key to retiring on monthly dividends, and PDO is not alone.
© 2026 Passive Income Live
Theme by Anders Noren — Up ↑