
Investment Trust Dividends

Author: admin (Page 107 of 448)

Across the pond

Contrarian Outlook


The AI Bubble Is Overblown (But This 10.6% Dividend Wins Either Way)

by Michael Foster, Investment Strategist

Is 2026 going to be the year the AI “bubble” finally bursts?

Maybe my use of quotes there tipped you off to my true opinion: Worries about an AI bubble are vastly overdone.

And today we’re going to grab a 10.6%-paying closed-end fund (CEF) that wins either way: If I’m wrong and there is an AI bubble (that pops), cash will flow into it. If not, that’s fine: We’ll happily collect its growing 10.6% payout.

From Silicon Valley to Wall Street

Of course, the AI CEOs agree with me that there is no AI bubble: Sam Altman, Elon Musk and the heads of Microsoft (MSFT)Meta Platforms (META)Alphabet (GOOGL) and Oracle (ORCL) are all bullish and willing to spend trillions on the tech.

But another group also agrees that AI-bubble fears are overdone: a cadre of hedge funds and institutional investors that regularly hold tech titans like Musk, Zuckerberg and friends accountable – and know the “plumbing” of the tech world even better than the billionaire set does.

You can see what I’m talking about here in the fight between Elon Musk and institutional investors over the latter group short-selling stocks like Tesla (TSLA). Musk has complained about this repeatedly, but this short selling does give companies an incentive to do better, so their stocks don’t end up shorted. A kind of accountability emerges as a result.

Coatue and the Tech Hedge Fund World

All of this brings me to Coatue Management. It’s a tech hedge fund that began during the dot-com bubble and not only survived but grew from $45 million in assets at its launch to about $70 billion today.

Over that time, Coatue has shorted many tech stocks, so it has experience in keeping corporate managers from getting tied up in indulgent behaviors that lose money for investors. Coatue also has plenty of experience with bubbles.

So when Coatue dismisses talk of an AI bubble, we should listen. And that’s exactly what it did late last month, when it posted this chart:
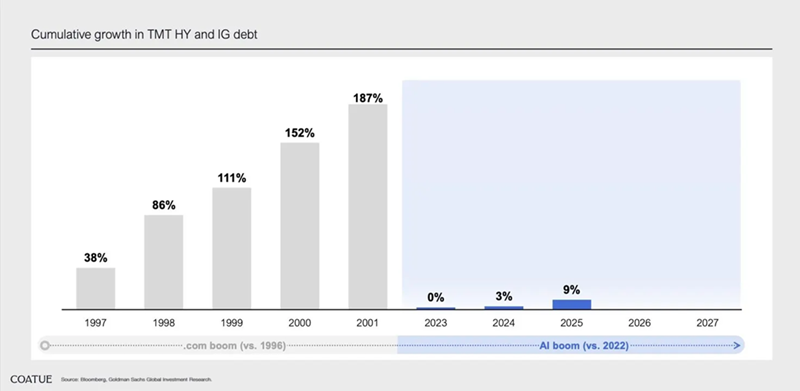
Here we see that over the last three years, there has been surprisingly little growth in the amount of money invested in corporate bonds issued to fund the tech, media and telecom sectors. (That’s the “TMT” in the title – those are the companies like Google, Microsoft, Meta and Oracle.)

The 0%, 3% and 9% gain in total debt issuances from 2023 to 2025 in these sectors suggest the bond market is not overly exposed to AI, and that there’s still a lot of room for debt to grow. Also, the comparison with the dot-com boom’s surging debt growth (on the left side of the chart) tells us the current situation is likely not a bubble – at least not yet.

To be sure, private debt and creative financing of some AI projects means a lot of AI borrowing isn’t shown on this chart. But that was also true of the dot-com era. And estimates of both again show we’re far from a bubble today.

But even if we were, the fact remains that corporate bonds are not overly exposed to AI. Moreover, bond holders tend to demand more discipline around costs.

The AI Hedge Move

If the corporate-bond market isn’t overly exposed to AI, then any volatility prompted by AI-bubble worries will likely drive cash from stocks to corporate bonds. That makes the corporate-bond market the perfect hedge for anyone worried about a selloff.

There’s just one thing: AI bubble fears are fading and have been since they peaked in November, at least according to internet search traffic.

AI Bubble Fears on the Backburner – for Now

I know what you’re thinking. “Markets are calm. AI bubble fears are fading, so why worry about this now?” The low fear means the market is not pricing in the potential of investors looking to hedge against AI in the future. That’s left corporate bonds cheaper than they should be.

In other words, we can buy into bonds now that the market isn’t hedging, wait for any stock volatility to boost demand for said bonds, then sell those bonds to investors.

Take a look at this chart.

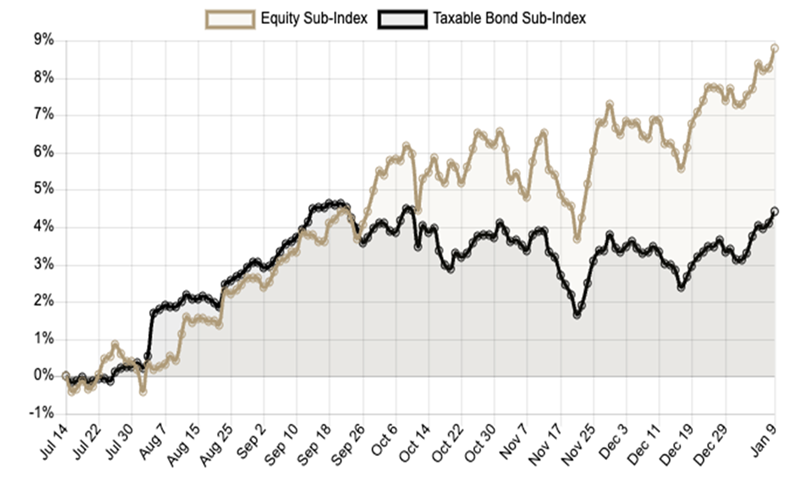
Bond CEF Underperformance Highlights Our Opportunity
Source: CEF Insider
I started 2025 bullish on corporate bond CEFs until September, when we sold three of these funds from our CEF Insider portfolio.

The reason is in the chart above: September was when CEF Insider‘s corporate-bond-fund subindex (in black) began lagging its equity-fund subindex (in brown). So CEF Insider focused more on equity funds, which have outperformed since.

Now that bond funds are on sale, and stand to gain on any short-term worries over an AI bubble, it’s time to cycle back to some of them. But how? Through a CEF, of course!

Buying corporate bonds individually is difficult, and bond ETFs typically underperform. But a CEF like the BlackRock Corporate High Yield Fund (HYT) is a great way to buy in, both now and over the next few weeks.

HYT Clobbers Its Benchmark
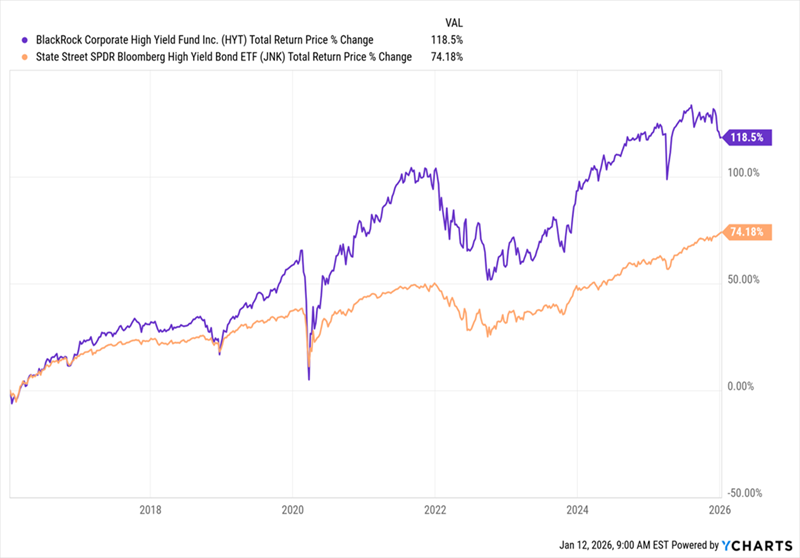
HYT yields 10.6% today and has raised its payout around 11% in the last decade. That’s in contrast to the corporate-bond benchmark SPDR Bloomberg High Yield Bond ETF (JNK), which has actually seen payouts fall a bit. Even better, HYT (in purple above) has outperformed JNK (in orange).

An even better reason to buy HYT is that today’s low bond demand means the CEF is especially cheap:

A Sudden Discount Appears
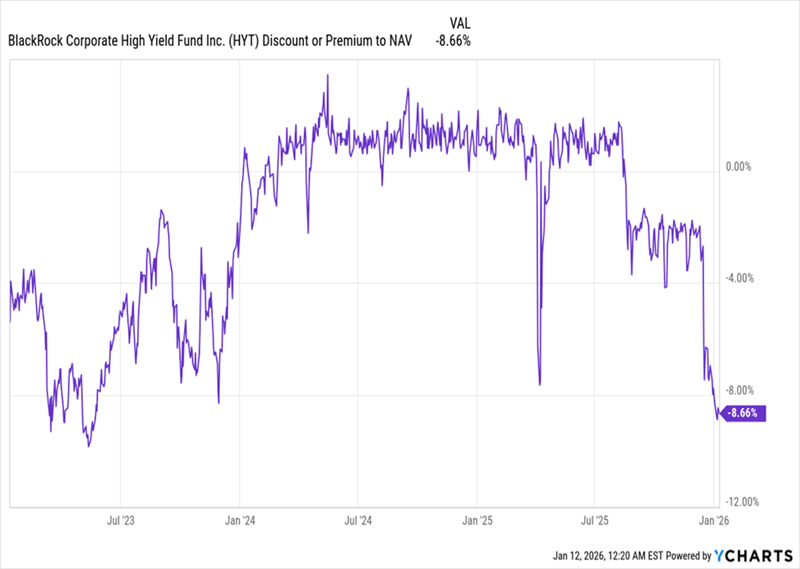
In the last six months, HYT’s discount to net asset value (NAV) has dropped to levels not seen since 2022 and 2023, after a long period of trading around par. This is an opportunity for us, putting short-term upside on the table if the fund’s discount evaporates again, like it did at the end of 2023.

With that in mind, buying HYT now is a solid value play, with demand for a hedge against an AI bubble waiting in the wings. And then, of course, there’s the 10.6% dividend.

HYT Is Just the Start. Here Are My Top “AI Bubble” Plays (Yielding up to 8.7%)

The bond market is far from the only place we’re investing to play overhyped fears of an AI bubble.

Another place? AI stocks themselves! But of course, careful contrarians we are, we’re taking two key precautions to safeguard the gains (and dividends) we get from these plays:

  1. We’re buying AI stocks throwing off huge dividends (yes, up to 8.7%!).
  2. We’re buying these stocks at deep discounts, cutting our risk as we collect their huge payouts.

I know, I know. The big-name AI stocks are all pricey now, and offer low (or no) dividends. So how are we going to pull this off?

Through CEFs, of course! I’m pounding the table on 5 CEFs holding shares of companies that not only provide AI, but those that stand to gain the most by using it, too.

The time to buy these 5 high-yielding CEFs is now.

Here’s how you could build a £23,455 second income with just £100 a month!

Drip-feeding money into growth and dividend shares can eventually deliver a stunning second income in retirement. Royston Wild explains how.

Posted by Royston Wild

Published 16 January

GAW

Storytelling image of a multiethnic senior couple in love - Elderly married couple dating outdoors, love emotions and feelings
Image source: Getty Images

You’re reading a free article with opinions that may differ from The Motley Fool’s Premium Investing Services

Looking to build a life-changing second income? For me, the best way to chase a strong and sustained income — and one that requires considerably less effort than most popular side hustles — is to invest in the stock market.

Last year, the FTSE 100 delivered an enormous 25% total return to investors. For the S&P 500 index of US shares, the figure was 18%. Those buying stocks at the start of 2025 could have supercharged their portfolios, then, boosting their chances of eventually enjoying a large passive income.

Returns were larger than usual, sure. But even at typical rates, a small investment can generate considerable wealth over time. The FTSE All-World Index of large- and mid-cap shares has delivered an average annual return of roughly 12% over the last five years.

Here’s how investing just £100 in global stocks could eventually produce a £23,455 second income with minimal effort.

Generating wealth

One of the simplest ways to invest in stocks is with an index tracker fund. They allow individuals to own a slice of many different companies, spreading risk and providing exposure to a broad selection of growth and income opportunities. And all at relatively little cost, too.

The Vanguard FTSE All-World ETF, for instance, tracks the performance of 3,657 stocks across regions and industries. And it has an ongoing charge of just 0.19%. If it can continue delivering the 12% annual return of recent years, a £100 monthly investment over 30 years will eventually turn into £335,074.

If then invested in 7%-yielding dividend stocks, a portfolio of this size would generate a £23,455 passive income a year.

Buying single stocks

Rather than gaining broad stock market exposure with a fund, investors can also choose to invest directly in companies. This requires a lot more effort than simply sticking your cash in an index tracker. However, it can also lead to far better results.

I think a portfolio of 15-20 stocks offers excellent diversification to spread risk and aim for big returns. Games Workshop (LSE:GAW) is one of the FTSE 100’s finest growth stocks I’ve bought for my own portfolio.

Thanks to its leading role in a rapidly growing market, the tabletop gaming specialist continues to enjoy booming profits even as the broader retail sector struggles. Last year it delivered a total return of 47%, smashing the broader FTSE index’s performance.

Further price gains in 2026 mean the average annual return over the last decade is 45%. If you’d drip fed £100 each month into Games Workshop shares since then, you’d now be sitting on a cool £218,409 (assuming dividends were reinvested).

If then invested in 7%-yielding dividend stocks, a portfolio of this size would generate a £23,455 passive income a year.

The big risk is that even if you achieve the target, there will be enough shares yielding 7% for a diversified portfolio.

TFIF

Dividend Announcement

The Directors of TwentyFour Income Fund Limited (“TFIF”), the FTSE 250 listed investment company targeting less liquid, higher yielding UK, European, US and Australian asset-backed securities, have declared that a dividend will be payable in respect of quarter end 31 December 2025 as follows:

Ex Dividend Date 22 January 2026

Record Date  23 January 2026

Payment Date  6 February 2026

Dividend per Share 2.00 pence per Ordinary Share (Sterling)

How big does an ISA need to be to generate a £100k second income?

Ben McPoland highlights how it’s possible for a Stocks and Shares ISA portfolio to one day throw off life-enhancing sums of money.

Posted by Ben McPoland

Published 14 January

LMP

A rear view of a female in a bright yellow coat walking along the historic street known as The Shambles in York, UK which is a popular tourist destination in this Yorkshire city.
Image source: Getty Images

You’re reading a free article with opinions that may differ from The Motley Fool’s Premium Investing Services.

Imagine revealing that a Stocks and Shares ISA generated £100,000 every year in tax-free dividends. In some cases, people hearing that might not even believe it, as it sounds like the stuff of dreams for many.

Yet we know some investors are likely enjoying this level of passive income because the latest HMRC data showed there were over 5,000 ISA millionaires in the UK today. And the average pot among the top 25 investors was a staggering £11.3m !

However, that data was from the 2024/25 tax year. And since then, the stock market has boomed, with the FTSE 100 returning more than 30%, including dividends.

Admittedly, markets bombed in April 2025 after President Trump’s tariff bombshell. So that was a lower starting point, making these figures look unusually strong for such a short space of time.

Nevertheless, there will almost certainly be more ISA millionaires now, with many of them generating sizeable second incomes.

Here’s how it’s possible to join them.

Please note that tax treatment depends on the individual circumstances of each client and may be subject to change in future. The content in this article is provided for information purposes only. It is not intended to be, neither does it constitute, any form of tax advice. Readers are responsible for carrying out their own due diligence and for obtaining professional advice before making any investment decisions.

Regular investments

To generate £100k a year in dividends, a 6%-yielding ISA would have to be worth approximately £1.67m. That sum may sound unobtainable at first. But as mentioned, there are thousands who have already built ISAs of this size.

Moreover, they didn’t have any unfair advantages when starting. A billionaire can’t stick £5m straight into a Stocks and Shares ISA to shield it all from tax. They’re restricted to the same £20k per year limit as everyone else. 

Of course, in reality, not everyone can afford to put away £20k every year. Especially in today’s never-ending cost-of-living crisis.

For our purposes here then, I’m going to assume that someone invests half that amount. That’s the equivalent of £833 a month.

The long-term average total return of UK stocks is around 8% per year. But with careful research and savvy stock picks, it’s possible to target an average of 9%.

In this scenario, it would take approximately 32 years to reach £1.67m and £100k in passive income (excluding brokerage fees).

For someone maxing out the £20k limit at a 9% return, it would fall to 25 years. All figures assume reinvested dividends.

6.6% yield

The UK market is home to hundreds of dividend shares, including LondonMetric Property (LSE:LMP). This is a FTSE 100 real estate investment trust (REIT) that owns distribution centres, hotels, and healthcare, entertainment and retail properties. 

Yesterday (13 January), it was announced the company had snapped up a handful of Premier Inn hotels for £89m, bringing its ownership to 22.

In November, its portfolio had an impressive occupancy rate of 98.1%

As we can see above though, the stock has struggled in recent years as interest rates have soared. Higher rates have increased debt service expenses and made portfolio growth more expensive.

Moreover, as a REIT, LondonMetric has to dish out 90% of its rental profits as dividends, leaving it to rely on more expensive debt to operate. So this isn’t a risk-free investment.

However, with interest rates gradually heading lower, 2026 might mark the start of a turnaround for REITs. This one currently offers an attractive 6.6% forward-looking yield.

With its high-quality property portfolio, high yield and the possibility of a turnaround, I reckon LondonMetric stock is worth checking out at 193p.

£2,000 in a SIPP at birth could be worth £849k in 65 years!

Dr James Fox explains how an investment into a SIPP at birth could compound into a nice retirement pot even if no extra money is added over the years.

Posted by Dr. James Fox

Published 15 January, 6:00 am GMT

SMT

Two male friends are out in Tynemouth, North East UK. They are walking on a sidewalk and pushing their baby sons in strollers. They are wearing warm clothing.
Image source: Getty Images

You’re reading a free article with opinions that may differ from The Motley Fool’s Premium Investing Services.

A newborn with just £2,000 invested in a Self-Invested Personal Pension (SIPP) could one day retire with close to £850,000. No that’s not a typo — and it all comes down to how pensions work and the extraordinary power of compounding.

To start, when money’s paid into a pension, the government adds tax relief. For someone with no earnings — including a baby — parents or grandparents can contribute up to £2,880 a year, and HMRC automatically tops the SIPP up by 20%.

So a £2,000 contribution doesn’t stay £2,000 for long. It becomes £2,500 once the £500 tax relief’s added.

From there, the maths becomes astonishing. If that £2,500 compounds at 9% a year — roughly in line with long-term global equity returns — it grows to around £849,000 over 65 years. No monthly contributions. No stock-picking. Just one lump sum, left alone for a lifetime. That’s compounding.

Most people think pensions are something to worry about in middle age. In reality, the most powerful years are the very first ones. Money invested in the early decades has far more time to snowball. That’s because every pound of growth starts earning returns of its own.

What makes this strategy so compelling is how little it requires up front. It’s a meaningful gift, £2,000, but it’s not transformational for many families. Yet when combined with tax relief and six decades of compounding, it can become exactly that.

The lesson’s simple: in investing, time beats everything. Start the clock early, and the results can be extraordinary.

Please note that tax treatment depends on the individual circumstances of each client and may be subject to change in future. The content in this article is provided for information purposes only. It is not intended to be, neither does it constitute, any form of tax advice. Readers are responsible for carrying out their own due diligence and for obtaining professional advice before making any investment decisions.

Where to invest?

When investing for a long period and with a relatively small figure, it may be best to invest in trusts or funds. This could include one fund tracking the performance of the US market, and one tracking the performance of the UK market. However, I’d leave room for something a little more exciting, and that could come in the form of the Scottish Mortgage Investment Trust (LSE:SMT).

This investment trust sits at the adventurous end of the FTSE 100, backing some of the world’s most ambitious growth companies through a single, globally diversified portfolio. Scottish Mortgage blends listed giants with hard-to-access private firms, giving investors exposure to everything from SpaceX (15.2%) to TSMC, Amazon, Nvidia, Meta and ASML.

The top holdings read like a roll-call of the technologies shaping the next decade, spanning artificial intelligence (AI), semiconductors, e-commerce and digital payments, with private names such as Stripe and Bytedance adding extra upside potential.

Right now, the trust trades on a 9% discount to net asset value, meaning investors can buy this portfolio for less than the underlying assets are worth. That can be an attractive entry point if sentiment improves.

However, there is risk. Scottish Mortgage uses gearing (leverage), which amplifies gains in rising markets but also magnifies losses when growth stocks fall.

For long-term investors comfortable with volatility though, the combination of elite holdings and a discounted price could prove compelling. I certainly think it’s worth considering.

LMP

2 REITs to consider for passive income in 2026

Real estate investment trusts (REITs), offer some phenomenal dividend yields for passive income investors. Zaven Boyrazian explores two that are on his 2026 radar.

Posted by Zaven Boyrazian, CFA❯

Published 11 January

LMP SGRO

Red lorry on M1 motorway in motion near London
Image source: Getty Images

You’re reading a free article with opinions that may differ from The Motley Fool’s Premium Investing Services.

Around 25% of my Self-Invested Personal Pension (SIPP) is taken up with real estate investment trusts (REITs). While each of my positions within this sector is diversified across different parts of the value chain, this concentration’s stemmed from too-good-to-resist passive income opportunities.

Higher interest rates have hampered sentiment throughout this sector. But that hasn’t stopped all REITs from thriving. And now that rates are steadily falling, 2026 could be the year that REITs make a comeback.

At least, that’s what some institutional investors are signalling with their recent Buy recommendations. And among these are:

  • LondonMetric Property (LSE:LMP) – 6.6% yield.
  • Segro (LSE:SGRO) – 4.2% yield.

Please note that tax treatment depends on the individual circumstances of each client and may be subject to change in future. The content in this article is provided for information purposes only. It is not intended to be, neither does it constitute, any form of tax advice.

1. Diversified logistics and healthcare

LondonMetric’s a business I’ve had in my SIPP since 2023, generating incrementally higher passive income. While the business has historically specialised in prime-positioned warehouses for e-commerce giants, its recent acquisitions have diversified its real estate portfolio into other sectors like healthcare and entertainment properties.

Today, the group boasts an industry-leading 98.1% occupancy level with an average lease duration of 16.4 years. What’s more, only around 8% of its rental agreements are up for renewal over the next three years, signalling a continuation of steady and predictable cash flows that fund an ever-increasing shareholder payout.

There is, of course, risk.

In the latest Autumn Budget, the government announced higher business rates on larger properties like those in LondonMetric’s portfolio. While it’s ultimately up to tenants to pay this bill, it could put pressure on their margins, indirectly slowing demand for LondonMetric and raising the risk of eventual non-renewals.

Nevertheless, with most of its tenants enterprise-scale customers with solid financials, this is a risk I feel’s worth taking. That’s why I’ve recently topped up my existing position.

2. Investing in European data centres

Like LondonMetric, Segro also manages a vast portfolio of big box warehouses and urban logistic hubs. But more recently, management’s been investing in data centres to capitalise on artificial intelligence (AI) tailwinds.

Only around 8% of its real estate portfolio consists of data centres as of June 2025. But with numerous projects in the pipeline that could quickly change. In the meantime, cash continues to flow into the pocket of shareholders, with occupancy standing strong at 94.3%, funding almost eight years of sequential dividend hikes.

While Segro’s exposed to the same UK business rate threat, its diversification across Europe mitigates the impact, making its yield look more secure. However, it nonetheless remains exposed to potential slowdowns in logistics demand as well as emerging competition within the data centre space.

Its average lease duration is also lower than that of LondonMetric’s, standing at 8.2 years. But that’s not entirely surprising given that lease durations in Europe are typically much shorter than in the UK. Regardless, it remains quite lengthy, providing ample long-term visibility to cash flows.

That’s why I’m taking a closer look at this REIT to potentially sit alongside LondonMetric in my SIPP. But the opportunities within this sector don’t end here…

Pensions. Michael Taylor.

Pensions
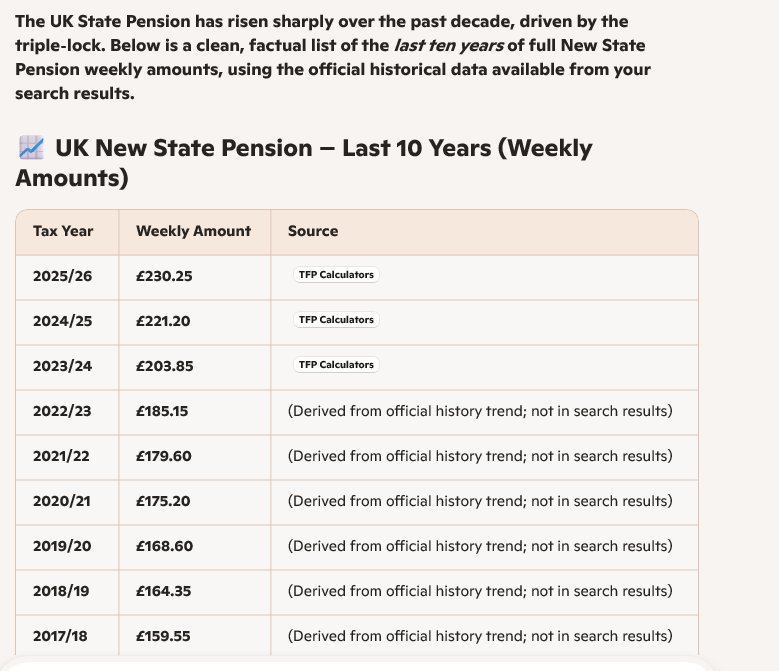
The UK state pension currently pays £230.25 a week.
Less than £1,000 a month after over 40 years of work.
You can live off it, but it’s probably not the lifestyle people imagine for retirement.But this assumes that:
1) The state pension won’t become lower in real terms (which it historically has)
2) It will even exist. Personally, I think pensions will need to become means-tested. Obviously, no party wants to touch pensions because it’s an instant vote loser.
But with the state pension predicted to be no longer financially sustainable by 2035, it’s a ticking timebomb that someone at some point will need to do the hard thing that needs doing.

Western governments are drowning in debt.
UK: 96% debt-to-GDP
USA: 123%
France: 112%
Japan: 250%

Anything above 90% raises serious concerns.
Above 120% is a serious red flag long-term.
Since 2008, we have papered over the cracks by printing money.
And now inflation has hit your wallet.
Freddos were 5p in the early 2000s.They’re now 45p.
Have your wages gone up 9x for doing the same job in the last 20 years?
I’m going to guess they probably haven’t. But unfortunately, the situation is probably only going to get worse.
You don’t need to be Warren Buffett to realise that when fewer people are working compared to more retirees who are also living longer, there is going to be less money going in than coming out.
This is a long way of saying that if you’re relying on the government, then good luck.
The only person you can rely on to secure your financial future is you.

If you use the last ten years average pensions have risen by £72.40 a rise of around 44%.

If you use compound interest, we love compound interest and use the same figure the pension will rise by £101.20 to £331.20.

The further out you go, compounding makes it worse, not for the pensioner but whoever the government is at the time. One option would be to make it means tested but

before then.

What are the cheapest ways to track global markets?

Our guide to the cheapest ways to access global markets, including the UK, US and emerging markets.

13th January 2026

by Dave Baxter from interactive investor

Investor holding up pound symbol 600

One of the biggest investing trends over the past decade has been the rise of passive funds, either via exchange-traded funds (ETFs) or open-ended index funds. 

In fact 27 of the 50 most-bought funds in the third quarter of 2025 were passive, with investors drawn to strong returns and low fees. 

Below, we examine some of the ways to invest passively in global markets via interactive investor. The figures shown are the yearly ongoing charges figure, which does not include transaction costs (the fees incurred by the tracker fund when it buys and sells holdings).

United Kingdom

The FTSE 100 is one of the most recognisable indices in the world. As a result, investors can find several very cheap ETFs tracking the index. For instance, both iShares Core FTSE 100 ETF GBP Dist 

ISF

 and HSBC FTSE 100 ETF 

HUKX

charge just 0.07% a year. 

However, as cheap as these ETFs are, they are not actually the cheapest way to access the UK market with an ETF. The Amundi UK Equity All Cap ETF 

LCUK

 charges just 0.04%, making it one of the cheapest ETFs available to UK investors.

LCUK does not track the FTSE 100, but the Morningstar UK Index, which is slightly different. Whereas the FTSE 100 is the largest 100 companies listed in the UK, the Morningstar index has more than 200 constituents, giving it both large- and mid-cap exposure.

However, the two indices are not that different in practice. Both indices have similar top 10 weightings, and the sheer size of the largest holdings in the Morningstar index crowd out its additional smaller holdings.

The second-cheapest ETF is the L&G UK Equity ETF 

LGUK

with a charge of just 0.05%. 

For non-large cap UK exposure, the cheapest in terms of fees is Amundi Prime UK Mid & Small Cap ETF DR D 

PRUK

which costs 0.05%. 

Open-ended passive funds can also be very competitive. Tracking the 600 shares in the FTSE All-Share, iShares UK Equity Index costs just 0.05% and Fidelity Index UK costs 0.6%.

Vanguard’s FTSE 100 Index Unit Trust and FTSE UK All-Share Index Unit trust also both cost 0.06%. 

United States

The cheapest way to gain passive exposure to US stocks is via SPDR S&P 500 ETF USD Acc GBP  SPXL

.Managed by State Street, it costs just 0.03% and was launched in November 2023. 

The next cheapest ETFs for the US market are the Invesco MSCI USA ETF 

MXUS

 and Invesco S&P 500 ETF GBP 

SPXP

with both charging just 0.05%. These are the two cheapest ways to gain exposure to either the S&P 500 or the MSCI USA Index.

Three open-ended funds also stand out for value: iShares US Equity Index (costing 0.05% to track the FTSE USA Index which has around 500 holdings in it), Fidelity Index US (0.06% to track the S&P 500) and HSBC American Index (0.06% to also track the S&P 500). 

As has often been noted, there can be slight differences between indices. The S&P 500 has strict and unique inclusion requirements compared to other indices, with stocks required to be profitable over a certain period of time. The index also has a selection committee, which makes discretionary judgements about inclusion.

The popular Vanguard S&P 500 UCITS ETF GBP  VUSA

 and iShares Core S&P 500 ETF USD Acc GBP  CSP1

 charge 0.07%.

Europe

Passive exposure to Europe is not straightforward, as there is not singular definition of what “Europe” actually is.

Two of the cheapest ways to gain European exposure are via the Invesco EURO STOXX 50 ETF GBP  SX5S

 or the HSBC EURO STOXX 50 ETF GBP  H50E

Both charge just 0.05%. However, it is worth noting that Invesco’s transaction costs are higher, with the latest data showing this fee added up to 0.35% versus 0.05% for the HSBC tracker.

These two ETFs will give you exposure to the EURO STOXX 50 index. It looks to reflect “the performance of supersector leaders across the eurozone”.

As a result, the index is dominated by France and Germany. Also accounting for a reasonable share are the Netherlands, Italy and Spain.

Just as cheap is the Amundi IS Prime Europe ETF DR GBP  PRIE

This ETF charges 0.07% tracks the Solactive GBS Developed Markets Europe Large & Mid Cap Europe Index for 0.05%.

Another option is Amundi Core Stoxx Eurp 600 ETF Acc GBP  MEUD

This ETF charges 0.07% and tracks the STOXX EUROPE 600 index. Not only is this index larger than the EURO STOXX 50, it is also not restricted to just eurozone markets. As a result, it has around 23% exposure to the UK and 14% to Switzerland.

Cheap open-ended options include HSBC European Index (0.06% to track the FTSE Developed Europe ex UK index) and iShares Continental European Equity Index (0.05% to track the FTSE World Europe ex UK Index). The HSBC fund has around 400 holdings, while the iShares fund has around 550.  

Global

For those seeking global exposure, an especially cheap option is the UBS Core MSCI World ETF USD acc GBP  WRDA

which charges 0.06%. It tracks the widely followed MSCI World index.

Another option is the L&G Global Equity ETF  LGGL

which charges 0.1%. This ETF tracks the Solactive Core Developed Markets Large and Mid Cap Index.

Slightly more expensive is the SPDR MSCI World ETF GBP  SWLD

It tracks the MSCI World Index, composed of around 1,300 companies across developed markets, for 0.12%.

Both are cheaper than the iShares Core MSCI World ETF USD Acc GBP  SWDA

which tracks the same index for a 0.2% fee. Despite a higher fee, this ETF is more popular with interactive investor customers, often appearing in our monthly top 10 most-bought ETF rankings.

The Amundi MSCI World V ETF Acc GBP (LSE:LCWL) also uses this index and also costs just 0.12%. Another option is the Vanguard FTSE Dev World ETF $Dis GBP  VEVE

This ETF also charges 0.12% and tracks the very similar FTSE Developed World Index.

Fidelity Index World also costs 0.12% to track the MSCI World index. This is an open-ended fund, not an ETF.

Open-ended L&G International Index Trust and L&G Global Equity Index track the FTSE World ex UK and FTSE World index for just 0.13% in fees. They both own around 2,500 developed-world shares, with the former excluding UK shares. 

For those who want their global exposure to also include emerging markets, the funds can be slightly more expensive. For example, there is the iShares MSCI ACWI ETF USD Acc GBP (LSE:SSAC), which charges 0.2%. Alternatively, the Vanguard FTSE All-World ETF USD Acc GBP (LSE:VWRP) charges a slightly lower 0.19%. 

However, HSBC FTSE All World Index costs just 0.13% and does include more than 7% in China, Taiwan and India.

global financial market worldwide world 600

Emerging markets

Generally, it is more expensive to track emerging market as the underlying indices are less-frequently traded and composed of less-liquid stocks.

However, that is not to say exposure cannot be achieved at a reasonable price. The Amundi MSCI Emerging Markets II ETF Dist GBP (LSE:E127) is the cheapest, with an ongoing charge of 0.14%. Next there is the HSBC MSCI Emerg Mkts ETF GBP (LSE:HMEF), and theUBS Core MSCI EM ETF USD dis GBP (LSE:UB32), both of which charge 0.15%. All track the MSCI Emerging Market index, composed of around 1,400 large- and mid-cap stocks.

For the same ongoing charge, investors can also access emerging market shares without China. The Amundi MSCI Emerging Market Ex China ETF (LSE:EMXC) charges 0.15%.

There is also the iShares Core MSCI EM IMI ETF USD Acc GBP (LSE:EMIM), which charges 0.18%. It tracks the MSCI Emerging Markets Investable Market Index. In contrast to the other index, this one also includes small-cap stocks, giving it just over 3,000 constituents. There is also an ESG-screened version of this ETF for the same fee; the iShares MSCI EM IMI ESG Scrn ETF USD Acc GBP (LSE:SEGM)

Two competitively priced open-ended funds are iShares Emerging Markets Equity Index (0.2% fee) and Fidelity Index Emerging Markets (0.20% fee). They track the FTSE Emerging Index and MSCI Emerging Market Index, owning roughly 2,000 and 1,150 shares respectively. 

China

As noted, China dominates the emerging market index. However, for those who specifically want China exposure, there are several competitively priced ETFs.

The cheapest is the Franklin FTSE China UCITS ETF (LSE:FRCH) with an ongoing charge of 0.19%. The ETF tracks the FTSE China 30/18 Capped Index. This index is composed of around 1,000 Chinese companies. The largest positions are Tencent Holdings Ltd (SEHK:700) (12%) and Alibaba Group Holding Ltd ADR (NYSE:BABA) (8.5%). 

The second-cheapest China-focused ETF is a whole nine basis points more expensive, with the HSBC MSCI China ETF GBP (LSE:HMCH) charging 0.28%. 

Asia-Pacific

For the broader Asia-Pacific region, the cheapest option is the L&G Asia Pacific ex Japan Equity ETF GBP (LSE:LGAG), which has a charge of 0.10%. This ETF tracks the Solactive Core Developed Markets Pacific ex Japan Large & Mid Cap Index. Its biggest weighting is Australia, accounting for just over 60%, followed by Hong Kong at about 14%.

The next cheapest is the Vanguard FTSE Dev AsiaPac exJpnETFUSDAcc GBP (LSE:VDPG), for 0.15%. This tracks a slightly different index, the FTSE Developed Asia Pacific ex Japan index. Australia is still the biggest holding, accounting for around 41%. This is followed by Korean equities, at around 35%.

An open-ended alternative is iShares Pacific ex Japan Equity Index, at 0.11% in fees, as well as Fidelity Index Pacific ex Japan, at 0.13%. They track FTSE and MSCI indices, owning roughly 600 and 100 shares respectively. 

Japan

Active funds are often viewed by investors as a more favourable route for Japan exposure. However, Japan is one of the most efficient markets in the world, so investors might want to consider passive exposure. If they do, there are several reasonably priced options.

The cheapest is the iShares Japan Equity Index, at 0.08% in fees to track the FTSE Japan Index. This index currently contains almost 500 shares, ranked by their market capitalisation. 

It’s followed by Xtrackers Nikkei 225 ETF (LSE:XDJP), which charges just 0.09%, and tracks the famous Nikkei 225. This index is price-weighted, not market-capitalisation weighted. This means that the trading price of a stock determines how much of the index it makes up.

According to most investors, this method is inferior to a market-capitalisation weighting, in which the proportion that each company represents in the index is the result of its share price multiplied by the number of shares in circulation.

For just one basis point more, investors can buy a market-cap weighted ETF, the L&G Japan Equity ETF GBP (LSE:LGJG). This ETF charges 0.10% to track the Solactive Core Japan Large & Mid Cap Index, which is supposed to give exposure to large- and mid-cap publicly traded Japanese companies, with some ESG screening.

There is also the Amundi MSCI Japan ETF GBP (LSE:LCJP), which tracks the MSCI Japan index for 0.12%, as well as the open-ended HSBC Japan Index, which tracks the FTSE Japan index for 0.14% in annual fees. 

One or two positions in your Snowball could be pair traded with a higher yielder.

Whilst opening a new position at the tail end of a bull market is high risk, those with a longer term frame for investing could re-invest some of their earned dividends because as long as you can choose when to sell, you will not lose any of your hard earned, although it could be multi years. Not a problem if you add when Mr. Market gives you the chance.

The blog Snowball may in future buy a World ETF with earned dividends but only after the market falls.

Global Market Outlook 2026

Trends, risks and the road ahead

Our expert panel unpacks the potential trends, risks and opportunities for 2026.

12th January 2026

by the interactive investor team from interactive investor

As we head into the new year, our expert panel unpacks the potential trends, risks and opportunities for 2026, helping you navigate global markets with confidence.

Joining host Victoria Scholar, head of investment at interactive investor, are Paul Diggle, chief economist at Aberdeen, and the manager and founder of Capital Gearing Ord 

 investment trust, Peter Spiller.

Transcript

Hello and a very warm welcome to everyone joining us for today’s webinar. Thank you so much for being with us — it’s great to see you at the start of the year. I think we can still call it the start of the year, even a couple of weeks in.

My name is Victoria Scholar, Head of Investment at Interactive Investor, and I’ll be hosting today’s panel. The topic we’ll be discussing is what’s in store for global markets in 2026. It’s a broad subject, and we’ll try to cover as much as we can — the key trends, risks, and the road ahead — drawing on expert perspectives from our panel on the US, UK, and international markets over the year ahead.

We’re aiming to run for around 40 minutes. We’ll begin by introducing our guests, then move into a panel discussion, followed by Q&A from you in the audience.

Before we start, just a couple of housekeeping points. First, this webinar is for educational purposes only and does not constitute financial advice. Second, we’d love to hear from you. We’ve already received some fantastic questions that have helped shape today’s discussion — thank you to everyone who’s written in so far.

Now, let’s introduce our fantastic panel.

Joining me today are Paul Diggle, Chief Economist at Aberdeen. Paul heads the global macro research team, sits on the house view committee, and leads macroeconomic forecasting and political risk analysis to support investment decisions.

We’re also joined by Peter Spiller, founder and manager of Capital Gearing Investment Trust. Peter is the longest-serving fund manager in the UK investment trust sector and has developed a disciplined multi-asset investment approach focused on capital preservation and long-term real returns.

Paul and Peter are here to help shape today’s discussion, and it’s fantastic to have you both with us.

Victoria Scholar: Let’s start with geopolitics, which continues to dominate headlines. We’ve seen the war in Gaza, the war in Ukraine, tariffs, and uncertainty around Venezuela, Iran, and Greenland. Despite all this, markets have held up relatively well. Should investors still be paying attention to geopolitics?

Paul Diggle: In short, yes. Geopolitics doesn’t matter — until it does. We’re in an era of structurally high geopolitical risk, driven by the fracturing of the global order and increasing competition between major powers, particularly the US and China. Geopolitics matters for markets when it feeds through to economic fundamentals — growth, inflation, oil prices, and commodities.

We saw this clearly with Russia’s invasion of Ukraine, which affected energy prices and macro conditions. Some of today’s geopolitical themes — including a more assertive US foreign policy — could affect macro fundamentals over time, from oil prices to election outcomes in Latin America. Investors need to build resilience against shocks arising from heightened geopolitical tensions.

Peter Spiller: I agree with much of that. I lived through the 1970s, when geopolitics really mattered because of its impact on oil prices and inflation. That said, it’s important to distinguish between tragic events and economically significant ones. The situation in Gaza has been horrific, but it has had little direct impact on the global economy. However, the broader geopolitical backdrop does have important medium-term consequences. Europe, for example, will need to strengthen its military capability, which implies rising defence spending and significant budgetary pressure over time.

Victoria Scholar: Turning to investment opportunities, let’s start with the UK. The FTSE 100 had a strong year, up around 20%, outperforming some US markets. It’s broken above the 10,000 mark. Are we looking at another strong year in 2026?

Peter Spiller: For me, the most important market is the US. If the US experiences a major correction, correlations across equity markets tend to move close to one — meaning diversification offers little protection in the short term.

Assuming the US remains stable or modestly higher, UK valuations look relatively attractive. In historic terms they’re average, but with momentum, there’s no obvious reason that strength can’t continue for a while.

Financials have performed well, supported by steep yield curves and benign credit conditions. That said, the FTSE is fine — until it isn’t.

On the economic side, UK growth has been sluggish. Inflation has eased, but unemployment has risen. There are legitimate concerns, but there are also potential silver linings.

Paul Diggle: It’s easy to tell a negative story about the UK economy, and many people do. But inflation is coming down, partly due to weaker labour markets and more favourable energy dynamics.

Budget measures are broadly disinflationary, and that should allow for interest rate cuts. I expect three more Bank of England rate cuts, taking Bank Rate to around 3%, which should support the economy.

One key risk is the political calendar. Local, Scottish, and Welsh elections in May could prove challenging for the government. If markets perceive a shift away from fiscal discipline, gilt markets could react negatively.

That said, I do think there’s potential for positive surprises in the UK, especially given valuations and the prospect of rate relief.

Victoria Scholar: Turning to the US, markets had a strong year, but with volatility around tariffs and concerns about an AI bubble.

Peter Spiller: In sterling terms, the US wasn’t as strong as headline numbers suggest. A Bloomberg survey of strategists shows consensus expectations of around 10% returns — a fairly standard outlook.

Earnings growth looks solid, financial conditions are supportive, and rates may fall. But valuations are extraordinarily high. On cyclically adjusted measures, we’re near historical extremes.

Historically, such valuations imply very low or negative real returns over the next decade. Professional managers remain fully invested due to career risk — underperforming the index matters more than avoiding losses.

For individuals, it’s different. Large drawdowns are hard to stomach. Our approach prioritises capital preservation over chasing the last 10% of upside.

Fear of missing out has driven markets higher, but it also explains why valuations are stretched. Long-term investors should focus on downside risk, not short-term momentum.

Victoria Scholar: There has been rotation away from US mega-cap tech. Where are the opportunities?

Paul Diggle: Globally. Emerging markets, Europe, the UK, and parts of Asia offer better relative valuations. Rate-cutting cycles and defence spending provide tailwinds.

Beyond equities, short-dated credit looks attractive. Long-dated bonds face fiscal risks, but the short end offers income without excessive duration risk.

Japan is particularly interesting. Political change, fiscal stimulus, and long-running corporate governance reforms support the equity market. However, currency risk matters — gains can be offset by yen depreciation for sterling investors.

Victoria Scholar: Tariffs are likely less dominant than last year, but legal challenges to US tariff powers could reintroduce uncertainty. The Federal Reserve will also be under scrutiny as Jerome Powell’s term ends.

Peter Spiller: Bond markets are skating on thin ice. US deficits are extraordinarily large for a fully employed economy with above-target inflation.

Confidence at the long end of bond markets has weakened as politics increasingly influences rate expectations. Inflation appears sticky, and while short-term rates may fall under political pressure, credibility risks are rising.

A bond market crisis — in the US, UK, or Europe — would have profound implications for equities. There’s little appetite for fiscal restraint anywhere, which makes recessions harder to manage.

Victoria Scholar: Gold has been popular among investors.

Paul Diggle: Gold is expensive relative to real rates, but valuation has not been the dominant driver recently. Structural demand from central banks and reserve managers has increased significantly. Gold reflects concerns about dollar dominance, geopolitical fragmentation, and political interference in monetary policy. As a diversifier, it remains interesting — though valuations warrant caution.

Peter Spiller: We’ve owned gold for years, but we prefer index-linked bonds as a more rational response to inflation risk. Gold doesn’t provide income and doesn’t behave reliably as an inflation hedge. When an asset is up over 60% in a year, it’s no longer a safe haven. A small allocation may be justified, but excess exposure carries real downside risk.

Victoria Scholar: Biggest opportunity for 2026?

Paul Diggle: US productivity growth has surprised strongly. If productivity settles above post-crisis norms, this could support equity markets more broadly. Diversifying globally remains attractive, but it’s also possible that equity market beta performs well again, despite valuation concerns.

Peter Spiller:
If asset prices fall sharply, savings rates will rise and a recession will follow. In that environment, index-linked bonds offer rare real returns with relatively low risk.

Victoria Scholar: Biggest risk?

Paul Diggle: Political interference in the Federal Reserve. US interest rates anchor the global financial system. If credibility is lost, the consequences would be profound.

Peter Spiller: A bond market crisis would place severe pressure on equity valuations. In that scenario, being fully invested in equities would be extremely uncomfortable.

Victoria Scholar: Thank you so much to our panel — Paul Diggle and Peter Spiller — for a fascinating discussion.

« Older posts Newer posts »

© 2026 Passive Income Live

Theme by Anders NorenUp ↑