Just turned 40? Here’s how much you could have by retirement if you invest £500 a month via a SIPP
Worried about having enough money to retire on ? Investing regularly with a SIPP could potentially build a multi-million-pound nest egg!
Posted by
Zaven Boyrazian, CFA
Published 17 August, 7:21 am BST
Image source: Getty Images
When investing, your capital is at risk. The value of your investments can go down as well as up and you may get back less than you put in.
The Self-Invested Personal Pension (SIPP) is one of the best retirement preparation tools available to British investors. While taxes do eventually re-enter the picture, the elimination of dividend and capital gains tax, along with income tax relief, drastically accelerates the wealth-building process. So much so that even when starting later at the age of 40, it enables investors to accumulate a substantial nest egg. Here’s how.
Please note that tax treatment depends on the individual circumstances of each client and may be subject to change in future. The content in this article is provided for information purposes only. It is not intended to be, neither does it constitute, any form of tax advice.
Potential retirement wealth
Let’s assume an investor has just turned 40, is planning to retire at 65, and is currently in the Basic income tax bracket, paying a rate of 20%. Depositing £500 into a SIPP entitles them to 20% tax relief, transforming this monthly lump sum into £625. And investing this capital at the average stock market return of 8% a year for 25 years, compounds into a £594,392 pension portfolio.
Looking at the latest data from the Office for National Statistics, that’s just over four times what the average 65-year-old has saved up in 2025. And when following the 4% withdrawal rule, it’s enough to generate a retirement income of £23,775 a year.
Combining with the extra £11,973 from the UK State Pension, this simple investing strategy would put someone on the path to having a £35,748 passive income. And according to the Pensions and Lifetime Savings Association, that’s just over the £31,700 threshold needed to enjoy a moderate retirement in 2025.
Yet, when factoring in inflation, that threshold’s bound to rise over the next 25 years. Therefore, investors may need to aim a bit higher.
Brett Owens, Chief Investment Strategist Updated: August 14, 2025
The market-at-large is expensive by historical metrics. So let’s look past the pricey, low-yielding ETFs in favor of cheap dividend stocks.
That’s right, good ol’ value investing bargains. With high yields too! We’re talking about divvies of 5%, 8% and even 11% that we’ll discuss in a moment.
The spring market dip sure was brief, wasn’t it? The S&P 500 sank into near-bear territory in roughly a month, then snapped back just as quick.
Now? If We’re Buying the Market, We’re Buying Even Higher
In doing so, Mr. and Ms. Market took valuations to high levels. The S&P 500’s forward price-to-earnings (P/E) ratio of 22.1 remains in rarefied air, last reached during the COVID rebound, and before that, the dot-com bubble.
Which is fine. We’ll leave the 22 P/Es to the vanilla investors while we focus on bargains with respect to two “cash is king” metrics:
Big dividends: These generous stocks dish out 4x to 9x the market’s yield.
Cheap price-to-cash-flow: These companies are priced dirt cheap with respect to the cash flow they generate.
Let’s start with Virginia-based electric utility AES Corp. (AES, 5.5% yield), which we recently discussed as a low-beta name. This means AES, being a safe, stodgy utility, is more insulated from market pullbacks than run-of-the-mill dividends.
AES also has upside potential. Its renewable energy-selling business gives it growth potential that many utility stocks don’t have.
Potential, But So Far, It Hasn’t Shown Up Much in Practice
It’s also cheap. AES trades at a cheap 5 times cash-flow estimates, as well as a 0.6 PEG that implies it’s also cheap compared to its growth estimates. (Remember: A PEG under 1.0 signals that a stock is inexpensive.) The stock yields more than 5%, to boot, which is better than the already generous utility sector.
Edison International (EIX, 5.9%) is another utility company—this one more typical of the sector. It’s the parent of regulated utility Southern California Edison (SCE), which serves more than 15 million customers and generates much of its electricity from renewable sources including solar, wind, and hydro. It does, however, have a second business—Trio (formerly Edison Energy), a global energy advisory firm that serves large commercial, industrial and institutional organizations.
Unlike other utilities, however, EIX is a bit more “exciting.” It spent years in court fighting litigation over wildfire damage and ended up having to pay multiple billion-dollar-plus settlements. And the legal drama has returned in 2025. Shares have lost more than a quarter of their value, with most of that coming in January amid Los Angeles County wildfires, including the massive Eaton Fire, which prompted multiple suits against SCE over allegations that the company had “violated public safety and utility codes and was negligent in its handling of power safety shut-offs.” SCE is also being investigated in connection with the Hurst Fire.
In Fact, Wildfire Woes Have Been Par for the Course
If, for a minute, we closed our eyes and ignored all that, there’s a lot to like about Edison. It’s expected to generate decent top-line growth and a significant snap-back in profits over the next couple years. The big drop in shares has launched EIX’s yield to nearly 6%. It trades at just 3 times cash-flow estimates. And its PEG, which at fractionally under 1 suggests the stock is only mildly underpriced, is substantially down from the nearly 3 it traded at when I evaluated the stock a couple years ago.
But we can’t ignore the fire liabilities—they’re why EIX’s valuations are so low. That makes Edison a much bigger high-risk, high-reward gamble than the average utility.
Amcor (AMCR, 5.2% yield) is technically a cyclical stock, but it acts defensively. That’s because, as a packaging specialist, it’s in the business of—well, other business’s business. It makes everything from high-barrier paperboard trays for beef and meats to glass dressing bottles to overwrap for home and personal care. And its applications go far beyond the grocery store: Amcor’s products are used in garden and outdoor products, agriculture, pet care, healthcare, even building and construction. So Amcor is simultaneously a play on the broader economy and all the businesses it supports, but it also fills a vital need across a diversified set of companies.
AMCR stands out for a few reasons:
It’s a Dividend Aristocrat with a 5%-plus yield, which is rare. The hallowed group of dividend growers know how to stack pennies over time, but their headline numbers often leave a lot to be desired.
Amcor’s shares tend to be less volatile than most.
The stock is cheap, at least as far as cash flow is concerned; P/CF is roughly 6x right now. It’s a little less attractive by other metrics; its forward P/E (12) is so-so, and its PEG (1.3), while cheaper than the market, is still a bit overpriced.
Kodiak Gas Services (KGS, 5.2% yield) is an energy services firm that provides natural gas compression services, mostly in the Permian Basin of Texas and New Mexico. Its compression units are critical to upstream and midstream natural gas firms, so it’s able to secure multiyear, fixed-revenue contracts. There’s nothing novel about the business model, though. Like other energy services firms, if natural gas/liquefied natural gas (LNG) is in demand, Kodiak will be in demand, so the fact that global LNG demand is expected to grow over the next few years bodes well for KGS.
That’s in large part because Kodiak is extremely well-positioned to capture that growth. In late 2023, KGS announced it would acquire CSI Compressco LP to create the industry’s largest compression fleet. Kodiak’s fleet is young, too (read: less maintenance and replacement costs).
There’s not much stock history to examine, however. Kodiak is a relatively new issue that went public just a few months before the CSI announcement. But the company has started a dividend and raised it twice since then, including a nearly 10% improvement announced in April 2025.
A Stock Doubler-Plus + A New and Rising Dividend. Nice Start!
Meanwhile, its yield has wafted up to over 5% amid energy’s weakness this year—and left shares relatively cheap. KGS trades at roughly 6 times cash flow estimates and a low PEG of 0.13.
Atlas Energy Solutions (AESI, 8.4% yield) is another Permian Basin energy equipment and services firm, this one providing transportation and logistics, storage solutions, and contract labor services to oil and natural gas E&P firms, as well as other oilfield services companies. Its most important offering is mesh frac sand used in hydraulic fracturing (fracking). I had been keeping tabs on it because of its unorthodox streak of dividend hikes, but that streak stopped earlier this year.
The Trap Door Opened Soon After AESI Stopped Raising
It’s not ideal. Nor is the fact that AESI shares have been hammered to the tune of 45% this year. Again, energy services haven’t had a great 2025, but Atlas has been downright miserable amid slower-than-expected U.S. completion activity and droopy frac-sand prices. If there’s any silver lining to that, it’s that AESI shares now trade at just 5.7 times estimates for cash flows, as well as an attractive PEG of 0.75.
The dividend at least appears to be safe, too. While things look bad from an adjusted earnings perspective ($1.00 in dividends annually vs. forecasts for just 25 cents this year), Atlas has more than enough FCF to cover the payout. Example: Last quarter, it generated $48.9 million in adjusted FCF while paying out $30.9 million. Those cash flows are substantial because AESI is a low-cost operator—crucial for survival in this industry. But like any energy services provider, Atlas needs commodity prices to cooperate.
It’s unusual for a blue-chip stock like United Parcel Service (UPS, 7.5%) to yield north of 7%, but it’s also rare for a blue-chip stock like UPS to have its shares hemorrhage so much without a recession or broader bear market.
Lower-margin e-commerce volumes, higher costs because of its unionized workforce, and a weak freight environment hampered the company in 2024.
Then in early 2025, it spooked investors with a weak 2025 forecast and announced that—in hopes of shifting away from those lower-margin volumes—it would drastically reduce its business with Amazon (AMZN), which accounted for roughly 10%-12% of annual UPS revenues. The April tariff announcement also hit shares hard.
The result? UPS shares have lost nearly half of their value in just two years.
The upshot? UPS trades at roughly 8 times cash-flow estimates and has never offered a better yield in its 26 years of trading.
Sadly, Dividend Growth Had Little to Do With It
Is UPS a dividend trap? Perhaps. The company pulled its full-year revenue and profit forecasts in April, and didn’t bring them back in its late July report.
Meanwhile, Wall Street is expecting a roughly 15% drop in adjusted earnings, to $6.61 per share. That specific number matters: UPS has a target dividend payout ratio of approximately 50% of prior-year adjusted EPS. It currently pays $6.56 across four quarterly dividends. (That’s 99%!) CEO Carol Tomé continued to signal commitment to the dividend in the earnings call—“UPS is rock-solid strong and so is our dividend. The UPS dividend is backed by solid free cash flow and a strong investment-grade balance sheet,” she said—but if the delivery giant continues to struggle, simple numbers might force management’s hand.
Western Union (WU, 11.3% yield), somehow, is still in business. Payment apps like PayPal, Venmo and Zelle have been taking business from the “OG” of money transfer. WU boasts a big yield but for the wrong reason—its divvie looks big because shares are (deservedly) way down!
Western Union Has Been Headed South for Years
WU, to its credit, has launched an initiative called “Evolve 2025” in which it’s rolling out new products, improvements and an operational efficiency program. It’s also expanding its digital wallet offerings in Mexico and Singapore. And its latest move, announced just a couple days ago, is the $500 million acquisition of Miami-based International Money Express (IMXI), aka Intermex, which serves some 6 million customers who send money from the United States, Canada, Spain, Italy, the United Kingdom, and Germany to more than 60 countries.
But c’mon man—this dog is dead. The business trades for 4x cash flow and a sub-5 forward P/E, but who cares? Not me.
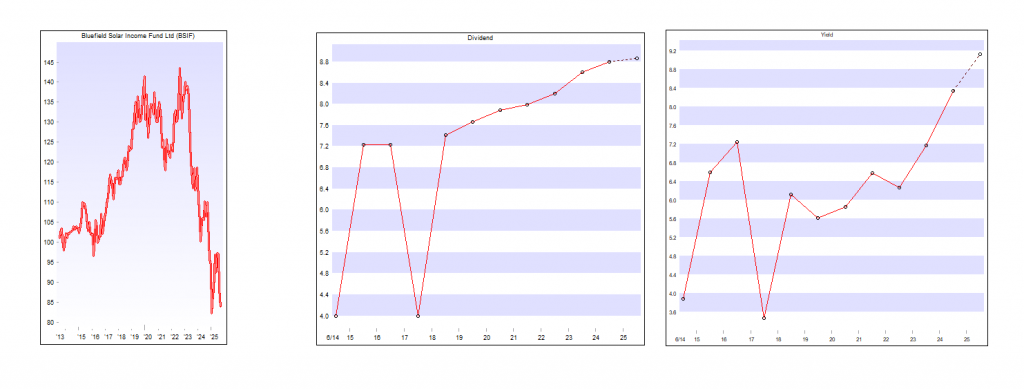
Dividends received £1,748, current yield eleven per cent. If NESF continues to pay a dividend in nine years the Trust should be producing income at a zero, zilch, nothing cost. Also unless NESF is taken over the Snowball should be this time next year be 25% closer to achieving the holy grail of investing.
NESF could be producing income at zero cost and the dividends re-invest into the Snowball should be producing income around 7% another £850.00.
The ‘belt’ is printing a small loss but the ‘braces’ are printing a good profit.
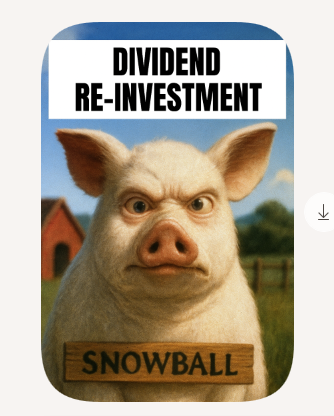
Remember the market could take back all the profit, so it’s often best to re-invest into the Snowball, even at a lower yield.
The Directors of TwentyFour Select Monthly Income Fund Limited (“SMIF“), the listed, closed-ended investment company that invests in a diversified portfolio of credit securities, have declared that a dividend of 0.5 pence per share will be paid, in line with the Prospectus, representing the regular monthly targeted dividend for the financial period ended 31 July 2025 as follows:
Ex-Dividend Date 21 August 2025
Record Date 22 August 2025
Payment Date 5 September 2025
Dividend per Share 0.50 pence (Sterling)
No special dividend announced, with any special dividends the blended yield is around 8%.
SDIP yields around ten percent, so in ten years time it could have return all your capital without compounding.
So it could achieve the holy grail of investing, in that it will produce income at a nil, zero,zilch, cost.
The income re-invested in the Snowball compounded at 7% will also be producing income.
As you can see SDIP is in profit of £1,067 of which dividends are £831.00.
Of course the market could take back all the profit, including the earned dividends but if the dividends are re-invested elsewhere in your Snowball the chances are reduced. This years dividends re-invested should produce further income of around £80.00
This month’s dive into the world of funds examines a high-quality way to invest in US equities, whose valuations are edging relentlessly higher. However, it’s not just US equities that are outperforming – after a prolonged period of underperformance, the share prices of many UK-listed alternative funds have pushed ahead.
Too much of a good thing in the US markets
Should you be worried that US equities are so exceptionally successful?
One of my favourite discussion topics when talking to investors is to get them to determine their actual underlying exposure to US equities, especially the Mag7. Add up what’s in your various portfolios, ISAs, your speculative positions, your SIPPs, and your DC target risk and target date funds. Unless you are nearing retirement, you probably have a much higher exposure to US equities than you realise—mainly because US stocks and shares have performed so well. Many long-term investment plans and global equity funds are benchmarked against an index called the MSCI ACWI index (with the MSCI World or FTSE World as alternatives). This index has 64% exposure to US equities, with Information Technology as a sector accounting for 24%, and the Mag7 making up just under 20% of the index. A close rival is the MSCI World index, which has nearly 72% exposure to US equities and just under 22.5% to the Mag7.
At this point, investors start to feel slightly uncomfortable. They’ll smile at the fact that returns have been excellent – even in recent weeks – but they’ll soon begin to worry about all the myriad risks in that exposure: the valuations, the concentration in a handful of stocks and the exposure to the dollar. Has the exceptional outperformance of the US (and its deep, liquid markets) created a risk to your portfolio?
Let’s be specific here: there are three interconnected but separate issues to consider. The first is whether overexposure to the US as a country and the dollar as an asset (which is currently weakening on the FX markets) is beneficial. Next is what we could call style risk for US equities, meaning whether I am overexposed to a specific type of US equity, such as tech stocks or growth stocks. The third risk is concentration risk, where you are concerned about being exposed to just a few stocks, specifically a suitably magnificent seven. It is helpful to distinguish these risks because, for example, you might be comfortable being overexposed to US assets, equally comfortable being overexposed to US tech growth stocks, but worried about putting all your eggs in the Mag7 basket.
Begin by considering concerns about overexposure to the dollar and US assets generally during Trump’s presidency. The dollar has been weakening (which is bad news for UK investors in US assets as valuations have dropped), and it could decline further (Trump would probably welcome that), but there is no evidence of a ‘flight from the US’ so far among private investors. Strategists at US investment bank Morgan Stanley recently analysed fund flow data on what foreign investors are buying and selling and found little sign of a widespread sell-off of US dollar assets. In fact, weekly data from Lipper on global equity ETFs and mutual funds show that international investors have been net buyers in the weeks following Liberation Day and throughout most of May.
But have we all – outside the US – become more exposed to its equity market? The short answer to that question is yes! In 2015, the MSCI ACWI index was only 51% invested in US equities; now it’s 64%. In 2015, Apple was the biggest stock (not Nvidia as it is now) with Microsoft not far behind at just under 1%. The price-to-earnings ratio of this index (a key valuation metric) was 18.50 back then. If we go back further to the year 2000, the US was at 48% (with the UK in second place at 8% exposure). So, is the US close to all-time highs in terms of geographic exposure? Yes, but not exceptionally so – and let’s be honest, if it is, that’s because US corporates have been growing their earnings at an above-average rate.
We can see this clearly with the S&P 500 benchmark index, which tracks US blue chips and has produced an annualised return of 12.8% over the last ten years. US profit margins are among the highest globally, which helps explain why the American index trades at a robust 27 times earnings, which is a somewhat excessive level, to put it mildly.
What about concentration risk or a bias towards specific sectors? Again, there are reasons to be worried, but let’s not get hysterical. The information technology (IT) sector is the biggest slug at 31% of the index, while the Mag7 comprise 32% of the value of the S&P 500 index. Technology’s share of the benchmark US index is high, but not amazingly high. As for concentration risk, if we look at the top ten stocks in the US index over the last century or so, all the way through to the mid-20th century, the top ten names have usually hovered around 20-30%, dropping below that level in the 1990s and 2000s, and then rising sharply in the last few years, reaching a peak of 40% in early 2025. And one sector has long tended to dominate the index – it used to be banks, now it’s tech.
So, what should you do? I’m more cautious about US equities than most and feel more comfortable running US equities at a closer to a 50 to 60% range in a portfolio full of equities. That’s what many successful global equities fund managers, such as the Alliance Witan Investment Trust, have been doing for a while now, notching US equity exposure to below 60%. Like many active fund managers, I’d be overweight Japan as well as the UK, which strikes me as cheap and provides valuable global diversification.
If you still want significant US exposure but seek more diversification, consider choosing a different style or type of stock within a fund. Instead of merely investing in a few tech giants, you could track US equities through something like the Invesco S&P 500 Quality UCITS ETF, which includes the 100 companies with the highest quality scores within the parent S&P 500 index. Alternatively, you might prefer cheaper, more value-oriented stocks and strategies. In that case, there’s an ETF from a firm called Ossiam that tracks an index devised by economist Robert Shiller – it’s called the Shiller Barclays CAPE index. This index (and ETF) still invests in big tech names, but it also tilts towards other well-known firms, with somewhat cheaper share prices, such as Eli Lilly, Costco, and Walmart. More generally, most active, stock-picking US equity fund managers tend to be biased against Mag7 stocks and more exposed to cheaper, value, and quality stocks, as they are more concerned about concentration risks and high valuations.
Oh, and if you think all this talk about US exceptionalism is just needless worrying, then why not go all in, bet on the coming AI transformation, and just buy the Mag 7 names, perhaps excluding Tesla and replacing it with Broadcom, another tech leviathan. One actively managed investment trust that embodies this ‘all-in’ AI-first strategy is the Manchester and London investment trust, which essentially represents a substantial bet on Nvidia and Microsoft (64% of the portfolio) alongside Broadcom and Arista, two other AI-related companies (another 12.5% of the portfolio). Two tech investment trusts, Polar Capital Technology and Allianz Technology, are also betting big on AI and on US tech, but with a more diversified portfolio, which even includes some international names.
Fortunately for you and me, the financial markets aren’t 100% efficient. And some corners are even less mature and less combed through than others.
These corners provide us contrarians with stable income opportunities that are both safe and lucrative.
There are anomalies in high yield. In an efficient market, you wouldn’t expect funds that pay big dividends today to also put up solid price gains, too.
We’re taught that it’s an either/or relationship between yield and upside – we can either collect dividends today or enjoy upside tomorrow, but not both.
But that’s simply not true in real life. Otherwise, why would these monthly payers put up serious annualized returns in the last 10 years while boasting outsized dividend yields?
For example, take a look at these 5 incredible funds that pay monthly and soar:
This is the key to a true “8% Monthly Payer Portfolio” – banking enough yields to live on while steadily growing your capital. It’s literally the difference between dying broke and never running out of money!
But I’m not suggesting you run out and buy these funds.
Some have been on my watchlist and in our premium portfolios over the years, but I mention them only as examples of the potential ahead.