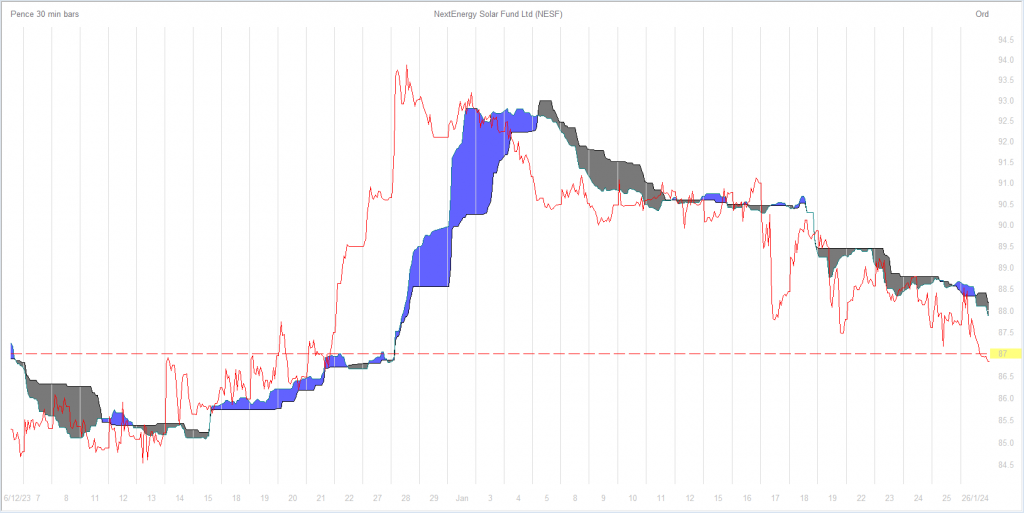
Cleary retracing, will it reverse. ? If u took some money off the table
u would be looking for an opportunity to re-invest.
Investment Trust Dividends
Cleary retracing, will it reverse. ? If u took some money off the table
u would be looking for an opportunity to re-invest.
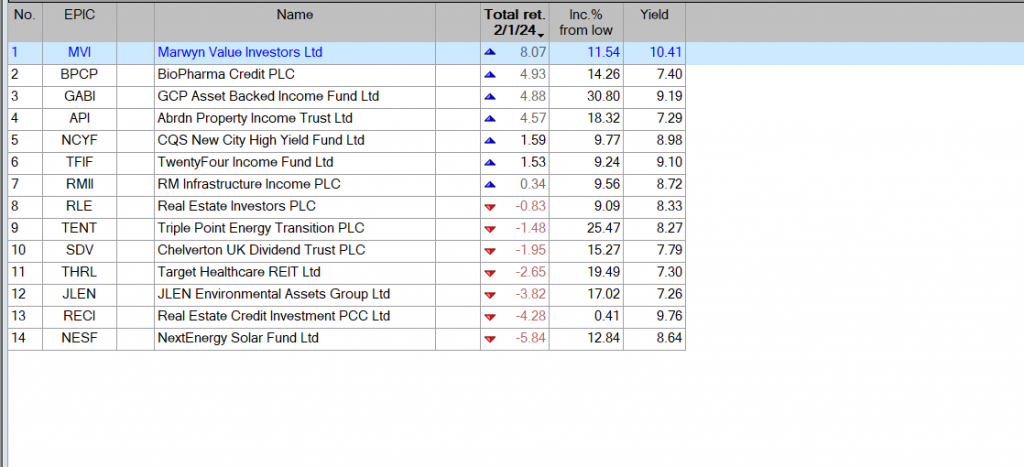
Watch list shares where the main trend is up but can and
often will reverse when the profit takers arrive.
Why passive and actively managed funds both have their uses. Its not an either/or debate because markets aren’t always that efficient

ByDavid Stevenson
Every year around this time there’s a surfeit of surveys that pose the annual question – have active funds outperformed their passive (ETF and index) fund peers. And every year the answer in aggregate is roughly the same: passive is massive and most active fund managers underperform. One of the biggest data sets comes from S&P Dow Jones, the index firm via their SPIVA reports. Typical of their analysis is the most recent report from the middle of last year – the mid year European score card. Here’s a quick summary of their findings :
“It was a challenging first half of 2023 for active managers in European equities, with over one-quarter of 22 categories recording underperformance rates of 90% or higher. Fixed income managers had a better start to the year in relative terms, with no categories registering underperformance rates of over 90%. Across both asset classes, however, underperformance rates increased to a similarly high average over a 10-year horizon. In H1 2023, 72% of British pound sterling-denominated and 76% of euro-denominated actively managed Europe Equity funds underperformed the S&P Europe 350®, while 77% of Eurozone Equity funds underperformed the S&P Eurozone BMI.”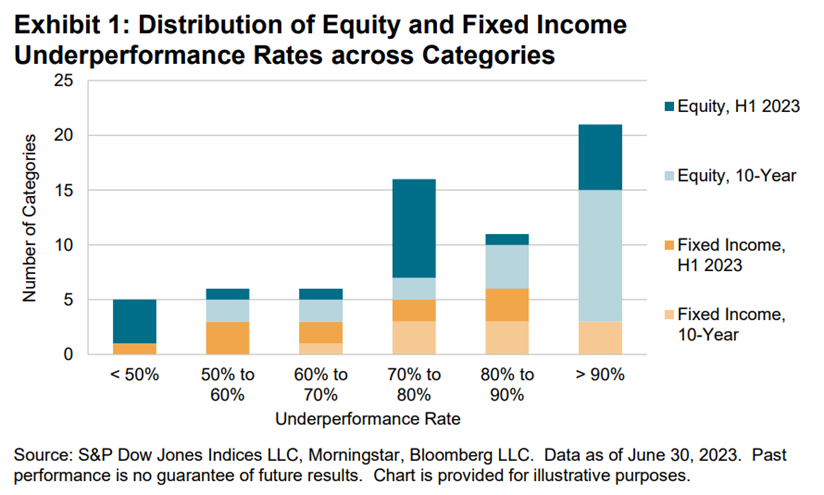
A more recent update on the same theme comes courtesy of a recent article from Trustnet which looks at data from FinXL. It compares returns in 2023 by Investment Association sectors (this is unit trust-focused data) for actively managed funds versus index benchmarks. Headline reveal ? Active management had the upper hand in 22 Investment Association (IA) sectors out of 54 in 2023. As always there are some headline grabbers in here. For example, the Trustnet article says “the chances of picking an outperforming active fund were slim – of the 343 funds that failed to beat the benchmark (the MSCI ACWI index), 289 (84%) were actively managed”.
To understand the chart below look at the preferred actively managed portfolios (on the upper side of the chart below) versus those asset classes where cheaper, passive alternatives (on the lower side of the diagram) would have outperformed. The most successful active managers – versus their benchmark – were in niches such as the IA Financials and Financial Innovation sector, where 84.6% of active funds managed to beat the MSCI ACWI/Financials index. Of the 12 funds that did, 11 were actively managed.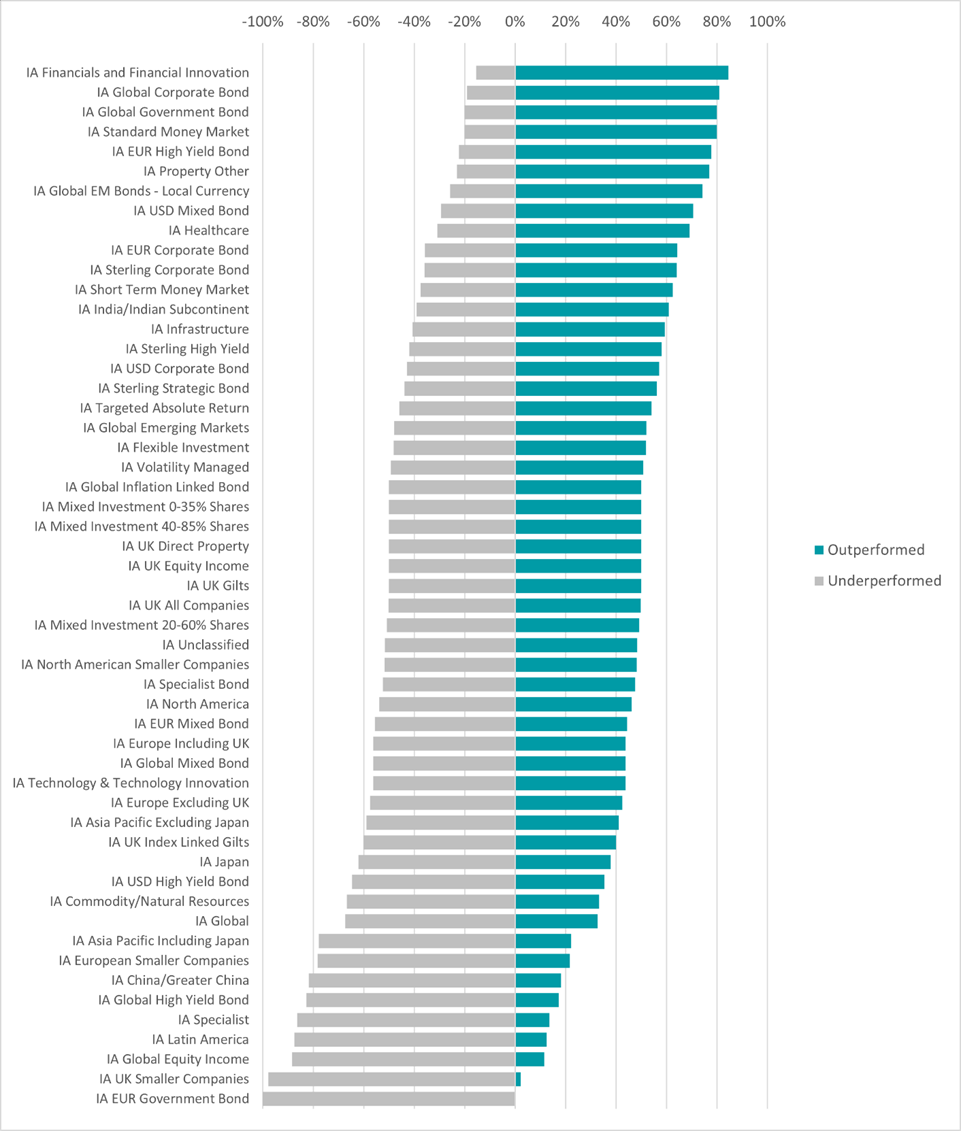 Source: FinXL
The report also suggests that active funds work well in focused bond sectors as well – passive funds tend to end up buying the biggest, most liquid, most indebted issues not the safest. In the more mainstream, liquid strategies and markets it was a ‘coin toss’ between active and passive : IA UK Equity Income, IA UK All Companies and IA North America, where the chance of active portfolios outperforming passives was approximately 50%. The most revealing data point though are returns for tech funds, notably the IA Technology and Technology Innovation sector. Here the index funds captured nearly all the gains any active manager would have targeted.
Active fund management RIP? Not so fast, especially if you invest in investment trusts which by their nature tend to be very specialist and highly focused. There are a number of important caveats to add to these big data sets. First with the SPIVA data you are looking at big aggregate numbers which conceals significant variation around the average. This comes through clearly in the Trustnet FinXL analysis which shows that many alternative sectors and spaces see sustained active outperformance – these include many alternatives, and very specialist markets where smaller cap companies dominate. There’s also some academic debate about the SPIVA numbers in particular : one analysis highlighted a list of concerns including (all very technical this): survivorship bias, Equal weighted performance measurement bias, Incorrect comparison to index/style bias, single index comparison bias, Index funds, ETF and others inclusion bias, Fund fees bias, Indices and index funds comparison bias and finally, different timeframes comparability bias.
A more general criticism of the passive is massive argument is that it relies on the idea that markets – equity markets, bond markets – are efficient. According to academics this posits that markets behave in a rational fashion and are largely efficient in processing stock specific information. There’s always been weak and strong versions of this theory and much of it underlines modern portfolio theory. Personally I’ve always bought the weak version – overall, in aggregate terms, markets do get prices right in the short to medium term, but I would add many caveats, most of which are based around the power of momentum and crowds. Liberum’s chief strategist Joachim Klement highlights a recent paper which suggests that most financial professionals – and investors – don’t believe in that theory.
“Peter Andre and his colleagues conducted lab experiments where academics, financial professionals, retail investors, and members of the general public were invited to invest in different stocks or the stock market overall. The setup was quite simple. Investors were provided with good or bad news about a company that had been released four weeks ago. Then they were asked to predict the future return of that stock and interviewed about their reasons for making that forecast. The results are summarised in the chart below. Essentially, the vast majority of academics followed the prescriptions of the efficient market hypothesis and did not change their forecasts in response to old news, good or bad. They argued that this information was fully reflected in the share price and hence has no impact on future returns. Financial professionals, retail investors, and members of the public alike changed their return expectations in response to this news. If the news is good, they increase their return expectations even if that news item was released four weeks ago. If the news is bad, they reduce their return forecasts. The main argument for doing so is the persistent impact of the news on future earnings and dividends. They argue that because of the good news, earnings growth should be stronger, which should result in higher share prices going forward, etc.”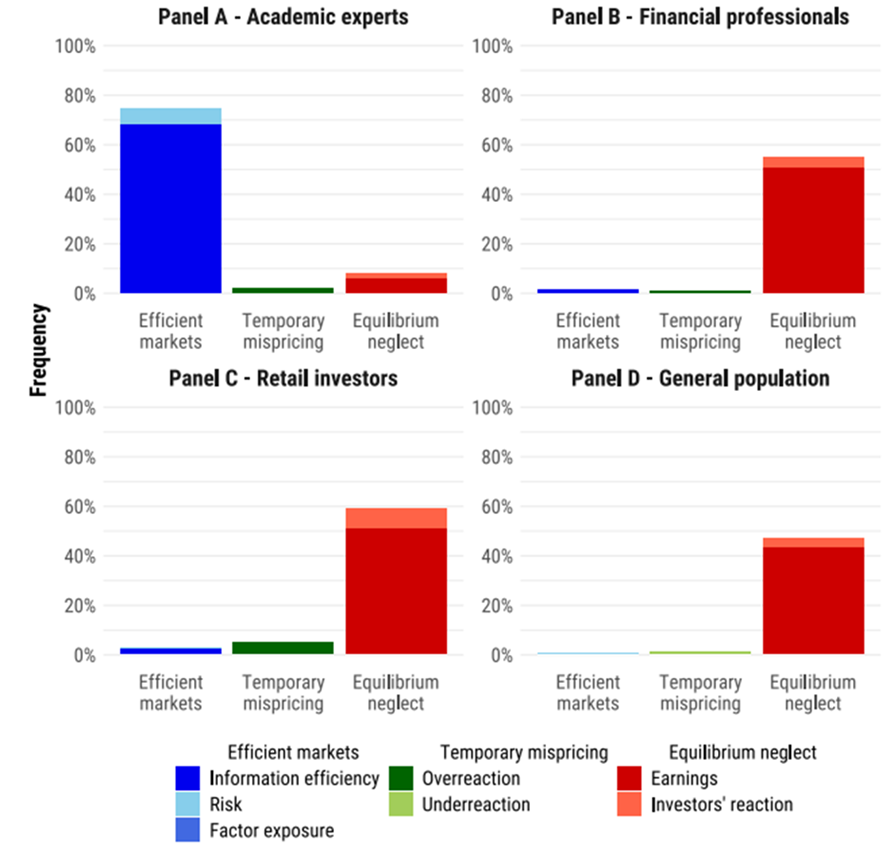
Source: Andre et al. (2023) I’ve quoted this at length because like Klement I suspect that if enough finance professionals and investors think and act as if markets are inefficient, then they are probably inefficient i.e there will be a feedback loop which reinforces crowd like behaviour. A good example of this is the way that analysts produce upgrades and downgrades in waves – the big Ai wave for instance – which in turn produces big momentum trends.
So, what to conclude ? It isn’t simply a case of passive vs active. Both have their place. Passive funds and thus benchmark indices are hard to beat in mainstream, liquid asset classes. Impossible no, difficult yes. As Warren Buffett once put it : “The problem simply is that the great majority of managers who attempt to over-perform will fail. The probability is also very high that the person soliciting your funds will not be the exception who does well.” But that doesn’t mean that active managers in specialist markets and niches – especially the alternatives sector – will fail. In fact I’d suggest the complete opposite – the more opaque the market the better the likelihood of outperformance. And one last fact to consider – a large part of the listed funds universe comprises investments in private assets such as private equity and private credit. Indices and benchmarks that efficiently track all major players are almost non existent and thus you have no other choice than to invest in an actively managed investment trust.
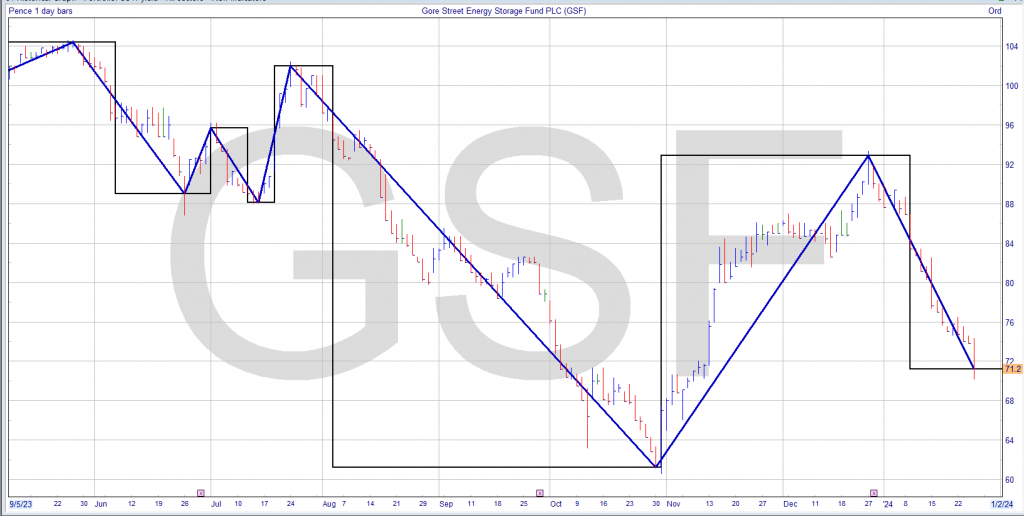
A very weak sector.
Story by John Plender
The Financial Times
Looking back over my five and a half decades exploring investment and finance, I have to ask the inevitable question: what have I learned from it all?
My early education in investment started in the great bull market of the late 1960s, in which a heady pace was set by the so-called Nifty Fifty growth stocks on the New York Stock Exchange. In the brief period I spent in the City of London, becoming a chartered accountant, I had the good fortune to be sent on the audit of the Imperial Tobacco pension fund. This was run by one of the great investment gurus of the postwar period, the actuary George Ross Goobey.
When Ross Goobey went to the Imperial fund in 1947, pension funds were mainly invested in gilt-edged securities, which were regarded as safer than equities. In his view this was a nonsense.
Against the consensus
Equities, by contrast, looked to him absurdly cheap. Ross Goobey managed the remarkable feat of persuading the fund’s trustees to let him invest in equities and dump the fund’s gilts.
In the bull market conditions of the late 1960s the Imperial fund’s portfolio struck me as bafflingly cumbersome. It contained nearly 900 holdings in mainly small and medium-sized — far from nifty — quoted UK companies. The fund was stuck with them regardless of their performance because Ross Goobey insisted his managers should never trade, only buy and hold.
Particularly unfathomable to me was his injunction to his managers to buy nothing that yielded less than 6 per cent. In a raging bull market this ensured exposure to some of the shakiest companies on the London Stock Exchange.
A few went bust in the subsequent recession. Yet, thanks to the policy of extreme diversification, the portfolio damage was marginal. In addition the high-yield injunction protected the fund from exposure to the most overvalued (and thus low-yielding) companies in the boom.
Here was an object lesson in the workings of diversification, though not quite as envisaged by economists such as Harry Markowitz, for whom the “free lunch” of diversification came primarily from spreading bets across different asset classes. Ross Goobey instead took a very risky bet on a single asset class while diversifying within it. The risk of capital loss was mitigated by the yield discipline he imposed.
So great were the returns that Imperial enjoyed pension contribution holidays for years. Other institutional investors followed suit by dropping gilts in favour of ordinary shares. Ross Goobey was credited with founding what came to be known as “the cult of the equity”.
Among the enduring lessons: diversification is an invaluable risk management tool. High yield, though often an indicator of dividend cuts to come, can be a good defence in an overheated market; equating risk with volatility, as so many economists do, may be less helpful, especially for private investors, than focusing on avoiding loss of capital. Meanwhile, reducing transaction costs by minimising share trading bolsters investment performance. That logic has turbocharged the rise of passive investing.
A decade of financial turbulence
The 1970s provided me with an induction course, first on the Investors Chronicle and The Times, then as financial editor of The Economist, in the dynamics of booms and busts. The unintended consequences of deregulation — a recurring theme in financial markets — helped shape what proved in economic and financial terms to be an exceptionally violent decade.
Exhibit A in the saga was US President Nixon’s cancellation in 1971 of the convertibility of the dollar into gold. The resulting deregulation of exchange rates unleashed volatile cross-border capital flows that caused wild swings in global asset prices. Exhibit B was the shift in the banking system from being a home for low-risk, highly regulated quasi-utilities — a product of the troubled 1930s — to an adventure playground in which bankers’ insatiable risk appetite was substantially liberated.
A radical and still instructive deregulatory experiment took place in the UK in 1971. The Bank of England scrapped quantitative ceilings on bank lending in favour of indirect controls, such as balance sheet ratios. This unleashed a wild acceleration of the money supply and credit. Excess liquidity poured into an overheating property market. Then came the 1973 oil crisis, soaring inflation, recession and financial crisis. Property, gilts and equities all plunged.
In equities, the dramatic share price collapse was driven by financial institutions’ selling. Their fear was not ill-founded. In confronting inflation, the Conservative government of prime minister Edward Heath removed key props of the capitalist system by adopting price, dividend and commercial rent controls.
At the same time companies faced not only spiralling wage bills but penal tax liabilities. This was because corporation tax was charged on paper profits from stock appreciation, the difference between the original cost of inventory and the inflated cost of replacing it. Result: British industry was going bust.
When Labour replaced the Tories in early 1974 chancellor Denis Healey intensified the corporate fiscal clamp. Yet by the autumn he had grasped that the corporate sector was being terminally throttled. He introduced tax relief for stock appreciation along with other breaks.
Timing the market
Policy U-turns often signal market turnarounds. Healey’s move to put British capitalism back on its feet should have ended the bear market. Yet in the fourth quarter of 1974, fearful insurance companies, pension funds, investment trusts and unit trusts together sold more shares than they bought for the first and last time during the decade.
Then on January 6 1975, after a peak-to-trough fall on the FTSE All-Share index of 72.9 per cent, the market inexplicably turned and rose vertically. It was impossible for the institutions to get back into the market without causing prices to move spectacularly against themselves.
That is a reminder of the futility, for most investors, of trying to time the market and of the difficulty of contrarianism, the art of investing against the consensus. Note, though, that Ross Goobey, hitherto an equity ideologue, once again defied convention.
When undated gilt yields reached 17 per cent in the mid-1970s the Imperial fund took a big bet on these government IOUs. Ross Goobey’s thinking was that if inflation came down this was an unbelievable bargain. But if the economy was going to hell in a handcart all bets were off anyway.
Of course, all bets are never off in financial markets, not least because when that becomes the common perception, gold comes into its own. There lies the case for the yellow metal as a hedge against catastrophe.
Why should this episode resonate with us today? While economists have explained exhaustively that we are not now reliving the 1970s the similarities remain more striking than the differences. Both periods saw supply side energy and commodity shocks, together with surging money supply. Governments turned on the fiscal tap in response.
Central bankers in both periods initially declared they could do nothing to curb an inflation induced by supply shortages. They were slow to see the demand side of the equation and the risk of second round effects in labour markets. And 21st century central banks’ economic models provided useless forecasts when confronted with supply shocks. So they fell back on a shaky, data-dependent (in other words, backward-looking) monetary policy.
One lesson is that investors, as well as central bankers, ignore money supply signals at their peril. Another is that in such inflationary periods government bonds cease to provide a diversifying hedge against supposedly riskier assets.
Dotcom delirium
Fast forward, now, to the second half of the 1990s, by which time I had been writing for the FT for a decade and a half. The dotcom boom was turning into a bubble, once again making a nonsense of mainstream economists’ belief that markets are “efficient” or reflect fair market values.
An important psychological factor in the tech euphoria was “Fomo” (fear of missing out) which goes back in history at least as far as the South Sea Bubble of the early 18th century. Fomo adds to investors’ myopia over the risk of capital loss.
For professional investors fear of missing out is more a matter of business and career risk. They are usually benchmarked against an index or peer group. So if they stand against a bubble and underperform the index, clients defect and they may be fired.
This was the fate of Tony Dye, the former chief investment officer of Phillips & Drew Fund Management, during the tech bubble. By shunning overvalued tech and going heavily into cash he seriously underperformed PDFM’s peer group, leading to his ousting just two weeks before the bubble burst. Small wonder fund managers tend to hug their benchmarks.
Central banks responded to the dotcom bust with rapid interest rate cuts. This cemented a view in the markets that policy was asymmetric. That is, the central banks would never lean against a bubble and would reliably extend a safety net when it burst.
The moral hazard implicit in asymmetric policy helped pave the way for the wild credit bubble of the 2000s (see below). Then came the great financial crisis of 2007-09. The central banks’ response was once again to come to the rescue and keep interest rates ultra low for a decade while buying up government bonds and other assets via so-called “quantitative easing”. A further round of propping up followed the pandemic and the war in Ukraine.
By the post-crash 2010s the UK investment scene had reverted to something like the pattern that confronted George Ross Goobey after the second world war. Pension funds had run down their equity holdings to near-zero. Quirky accounting standards and pressure from The Pensions Regulator had pushed them into liability-driven investment. Instead of seeking to maximise the return on their assets, trustees sought to match their liabilities by buying what economists and actuaries described as “safe” government bonds.
Yet nothing in investment is ever safe — witness how the collapse in US Treasuries contributed to the failure of Silicon Valley Bank and other US regional banks last year. And the regulators’ attempts to make individual pension funds risk-free makes the overall market structure more risky: if everyone pursues the same strategy, when the market moves, it moves all one way. That eternal verity re-emerged in the pension fund crisis in the gilt market in 2022.
After a lifetime spent watching the markets, I am struck how, with each new cycle in which central banks act as lenders of last resort, debt mounts inexorably. We continue to muddle through. But a great debt denouement is inevitable because debt cannot rise faster than incomes for ever.
Since debt implosions are inherently deflationary — see Japan in the 1990s — gold, ever resilient against inflation, may not provide insurance against falling prices but government bonds certainly will. To conclude; it is tempting to quote the US economist Herbert Stein who remarked that if something can’t go on forever, then it will stop. But as I have remarked here before, the wise rejoinder by fellow economist Rudi Dornbusch was: yes, but it will go on for a lot longer than you anticipate.
The intention is not to open a new position with earned
dividends as the more positions u own the bigger chance of owning
a clunker.
The portfolio is waiting for corporate updates from
ADIG, LBOW, VPC, TENT
where the funds may need to be re-invested into another high yielder.
I intend to add to existing positions to ensure roughly dividends of
1k a year per Trust.
This will mean going overweight in the lower yielders but
that is supposed to be a sign of safety.
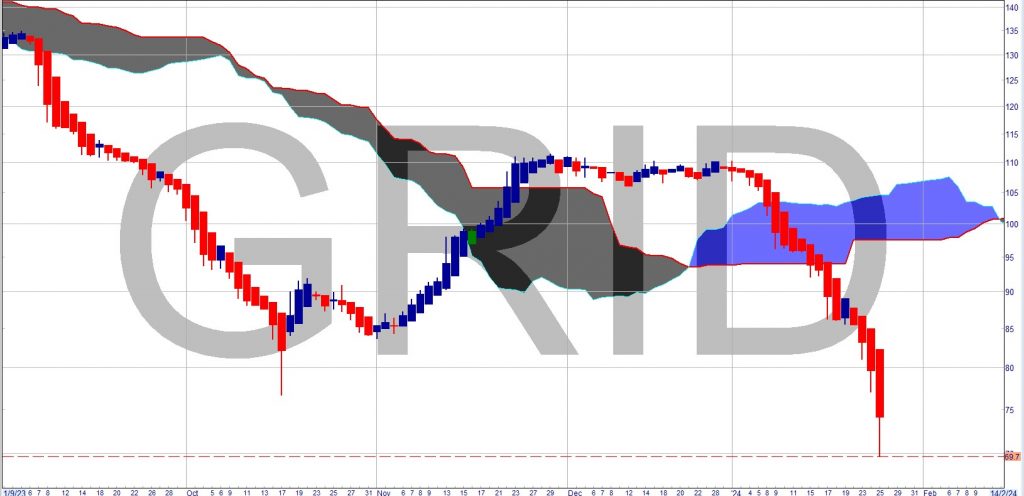
I’ve bought for the portfolio a further 1259 shares in GRID
for £900.00
Like bacon and eggs the chicken makes a contribution but the pig
makes a commitment.
Warehouse REIT plc
Dividend declaration
The Company has declared its third interim dividend in respect of the third quarter of the financial year ending 31 March 2024 of 1.60 pence per ordinary share, payable on 1 April 2024 to shareholders on the register on 1 March 2024. The ex-dividend date will be 29 February 2024.
The dividend of 1.60 pence per ordinary share will be paid in full as a Property Income Distribution.
Bluefield Solar Income Fund Limited
First Interim Dividend Announcement
Bluefield Solar (LON: BSIF), the London listed UK income fund focused primarily on acquiring and managing solar energy assets, is pleased to announce the Company’s first interim dividend for the financial year ending 30 June 2024 (the ‘First Interim Dividend’).
The First Interim Dividend of 2.20 pence per Ordinary Share (January 2023: 2.10 pence per Ordinary Share) will be payable to Shareholders on the register as at 9 February 2024, with an associated ex-dividend date of 8 February 2024 and a payment date on or around 9 March 2024.
The Board is pleased to reaffirm its guidance of a full year dividend of not less than 8.80 pence per Ordinary Share for the financial year ending 30 June 2024 (2023: 8.60 pence). This is expected to be covered by earnings and to be post debt amortisation.
© 2026 Passive Income Live
Theme by Anders Noren — Up ↑