Investment Trust Dividends

Author: admin (Page 94 of 448)

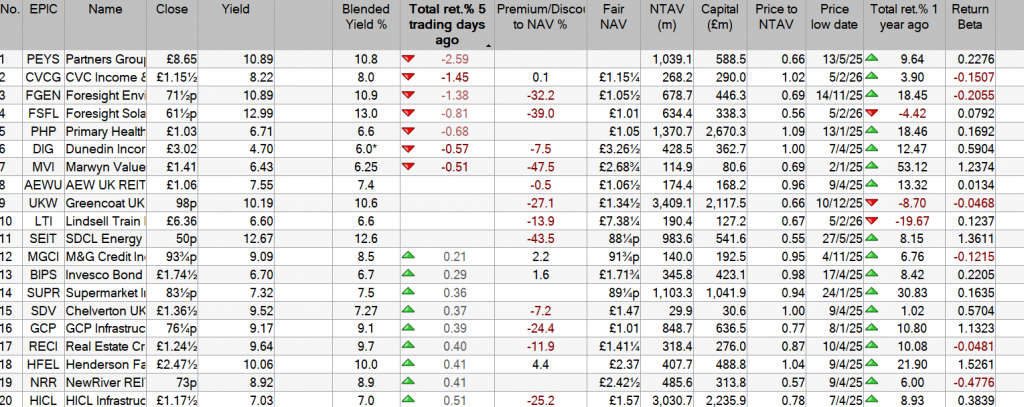
3 top REITs to consider for passive income

Dividend yields up to 10% !

Looking for the best dividend stocks to buy in 2026 ? These top real estate investment trusts (REITs) might merit serious attention, says Royston Wild.

Posted by Royston Wild

Published 4 February

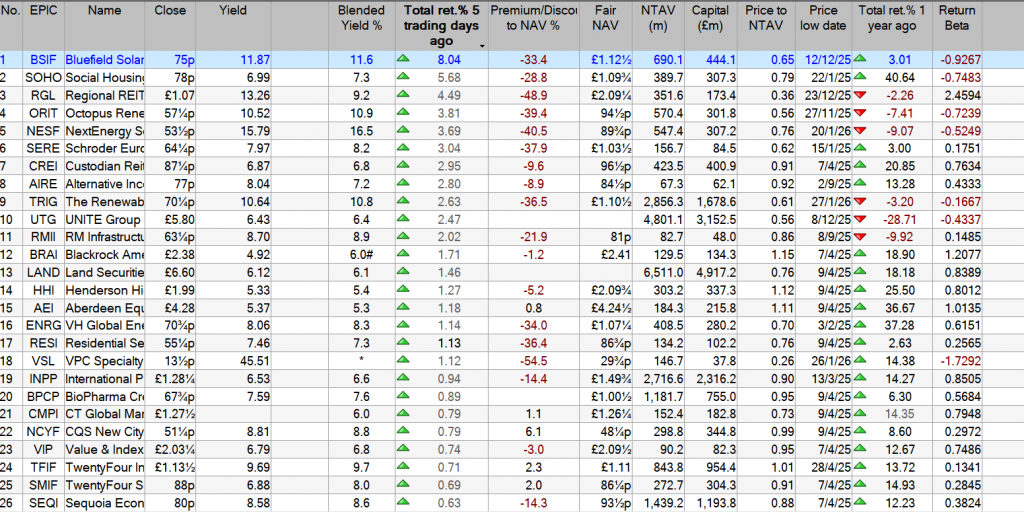
AIRE RGL SERE

Stack of one pound coins falling over
Image source: Getty Images

You’re reading a free article with opinions that may differ from The Motley Fool’s Premium Investing Services. Become a Motley Fool member today to get instant access to our top analyst recommendations, in-depth research, investing resources, and more. Learn More.

Real estate investment trusts (REITs) can be an excellent way to target a long and lasting passive income. Dividends aren’t guaranteed, but they have qualities than can make them better income choices than most other UK shares.

Under REIT rules, companies must pay at least 90% of annual rental earnings out in dividends. This still leaves payouts sensitive to profits performance, but it also provides a higher level of income visibility for investors than most other stocks.

Should you buy Alternative Income REIT Plc shares today?

Despite ongoing uncertainties from Trump’s tariffs to global conflicts, Mark Rogers and his team believe many UK shares still trade at substantial discounts, offering savvy investors plenty of potential opportunities to learn about.

So what are the hottest REITs to buy right now. In my opinion, three of the hottest to consider are:

  • Schroder European Real Estate Investment Trust
  • Alternative Income REIT
  • Regional REIT 

Each of these property powerhouses offers a forward dividend yield of at least 10%. Want to know what makes them true dividend heroes?

Please note that tax treatment depends on the individual circumstances of each client and may be subject to change in future. The content in this article is provided for information purposes only. It is not intended to be, neither does it constitute, any form of tax advice.

Euro giant

Schroder European Real Estate Investment Trust holds a top-class portfolio of properties in continental hotspots. We’re talking about highly desirable cities with strong economies and infrastructure. Think Paris, Berlin, and Hamburg, to name a few of its locations.

It’s a winning strategy that leads to reliable rent collection and strong occupancy (portfolio occupancy was 97%, latest financials show). The trust’s exposure to different sectors like logistics, office, retail, and data centres also gives it strength.

The forward dividend yield here is 8.1%. I think it’s a top trust to consider, even though adverse currency movements could take a bite out of earnings.

Another diversified REIT

Like the Schroder trust, Alternative Income REIT takes a diversified approach to the property market. If anything, things are even more wild and wonderful — they range from hospitals and petrol stations, through to hotels, gyms, and thermal power plants.

Its rent collection is even higher, at 100%. And its tenants are locked down on ultra-long contracts, providing protection from (if not totally eliminating) cyclical pressures on rent collection. The weighted average unexpired lease term for its 23 tenants sits at 17 years.

With more than 92% of rental income linked to inflation, too, Alternative Income is in great shape to grow shareholder payouts. For 2026, the dividend yield is a brilliant 8.5%.

Double-digit yield

At 10%, Regional REIT is today the highest-yielding property trust on the London stock market. It carries greater risk than the other contenders we’ve looked at, reflecting its narrow exposure to the UK and broader weakness in the office market in which it specialises.

This has caused its share price to slump over the past year (down 10%). But is the bad news now baked into the trust’s share price? I think it might be. As well as having that enormous yield, Regional REIT trades at a 51% discount to its net asset value (NAV).

To my mind, it’s a top recovery share to consider. The REIT retains a high-quality portfolio, and is selling non-core assets to boost occupancy and repair the balance sheet. As for dividends, this year’s predicted payout is covered more than twice over by expected earnings, providing a wide margin of error.

SERE

Schroder European Real Estate Investment Trust PLC – London and Johannesburg-listed property investor – Dutch telecommunications company Koninklijke KPN NV formally terminates its lease at Schroder European Real Estate’s Apeldoorn property. KPN occupies this mixed-use office and data centre property in Netherlands, representing about 19% of the company’s portfolio income and 6% of portfolio value as at September 30, 2025. The lease termination will take effect from December 31, 2026. Early this month, Schroder European Real Estate Investment warned of the risk of maintaining its dividend following the departure of KPN.

Kepler View

As the board notes, alongside broader market factors, two specific factors play a role in Schroder European Real Estate’s (SERE) persistent discount. The largest tenant, KPN, has already provided verbal confirmation and is expected to formally confirm shortly its intention not to renew its lease, which expires in December 2026. We note that this is a large site that, aside from its current use, could be repositioned for residential development. But it’s current mixed use, particularly as a datacentre, are in an area which is seeing strong tenant demand across Europe.

We understand from the manager that there is a strong case to believe that the French tax claim will not be paid, and the board confirms that it has received professional advice on the same basis. Alongside this change, there is now a timetable for when we might expect a resolution, and as the board notes, there is an appeal process should the initial assessment go against SERE.

SERE’s significantly wider than average discount, c. 36% , says to us that the market is taking a wait and see approach on the above issues and while that’s frustrating given that there has been an improvement in sentiment to REITs more generally, with some of SERE’s UK-listed peers turning in very good share price performances over the last year, taking this approach is understandable given the binary nature of both issues. Once the outcome of either or both is known, then SERE’s remaining portfolio, which has maintained a relatively stable valuation and income, could be significantly undervalued by the share price.

Are these high-yielding investment trusts a bargain or value trap?

One of the most troubled sectors continues to draw investors.

6th February 2026

by Dave Baxter from interactive investor

Percentage figure above an animal trap

Our monthly list of bestselling investment trusts tells many a tale, from the enduring popularity of growth funds such as Scottish Mortgage Ord  SMT

to the fact that bargain hunters have seized on the (briefly) wilting premium on 3i Group Ord  III

But it also shows us that one particularly battered Association of Investment Companies (AIC) sector, Renewable Energy Infrastructure, continues to draw in buyers after a horrific run of performance.

Greencoat UK Wind  UKW

 and NextEnergy Solar Ord  NESF

both sit in the top 10 list for January and seem to be a common addition to portfolios, what with their ultra-high dividend yields and wide share price discounts to net asset value (NAV).

But shareholders have been through the wars: rising interest rates (and bond yields) did huge damage to share prices across the sector in 2022.

All manner of problems, from a backlash against renewable energy to low wind speeds in the first half of 2025 and a broader crisis for the investment trust universe, have continued to hurt returns in the following years.

Renewable trusts come with bumper yields
TrustDiscount (%)Dividend yield (%)
Aquila European Renewables Ord AERI3.55%-46.919
NextEnergy Solar Ord NESF1.52%-43.116.5
Foresight Solar Ord FSFL1.82%-39.813.3
SDCL Efficiency Income Trust plc. SEIT1.42%-43.512.7
Gore Street Energy Storage Fund Ord GSF0.00%-39.112.7
Bluefield Solar Income Fund BSIF1.35%-33.311.6
Octopus Renewables Infrastructure Ord ORIT1.96%-40.411
Renewables Infrastructure Grp TRIG0.86%-37.710.9
Foresight Environmental Infra Ord FGEN0.28%-30.510.9
US Solar Fund Ord USF0.00%-48.210.6
Greencoat UK Wind UKW0.31%-27.310.6
Greencoat Renewables GRP1.61%-30.29.8
VH Global Energy Infrastructure Ord ENRG0.28%-34.88.3
Hydrogen Capital Growth HGEN0.00%-430
Ecofin US Renewables Infrastructure Ord RNEW3.26%-48.80
Aquila Energy Efficiency Trust Ord AEET0.80%-45.60
Gresham House Energy Storage Ord GRID0.00%-36.80

Source: AIC, 04/02/2026.

The sector took another hit late last year, thanks to the government’s mooted decision to switch the inflation linkage on certain renewable subsidies from the RPI measure of inflation to the lower CPI level. That would limit the revenue that renewable assets (and the trusts that have stakes in them) can generate.

The government confirmed its decision to go ahead with this option last week, although the news did in fact prompt the sector to rally. It’s worth asking what triggered this – and what bargain hunters buying the likes of UKW shares now need to understand.

Lesser evils – and the funds feeling the most pain

The sector rallied because the switch from RPI to CPI from April, while unwelcome, seemingly represented the lesser of two evils. The government had also considered temporarily freezing the subsidy level to make way for “a gradual realignment with the CPI”.

As the table below shows, some of the renewable trusts have substantial exposure to certain subsidy schemes and would see their NAV fall on the back of either change.

But the first option (now chosen by the government) is less harmful, with modest hits to NAV. While the damage is lessened, it’s the solar funds that are expected to take the biggest hit.

Estimated NAV impact of switching from RPI to CPI now vs a temporary freeze
TrustEstimate of revenues from affected subsidies (%)NAV change (%) from switching nowNAV change (%) from a temporary freeze
Bluefield Solar Income50-1.9-9.9
Foresight Environmental Infrastructure20-0.3-1.7
Foresight Solar49-2.2-10.9
Greencoat UK Wind40-1.7-6.1
NextEnergy Solar45-2.9-10.3
The Renewables Infrastructure Group15-0.7-2.5

Source: JPMorgan.

Buy or avoid?

As mentioned, there’s plenty to draw a bargain hunter in, from wide discounts to high yields.

In theory, we now have plenty of catalysts for a recovery: interest rates have been on a downward trend, high dividend yields mean investors are “paid to wait”, while such payouts are in most cases fully covered by earnings, and corporate action could also drive improvements. That could range from asset sales to mergers and buyouts.

Note, for example, that names such as Harmony Energy Income and Downing Renewables saw bids at decent premiums to share prices in the last year. That could prompt a recovery from depressed valuations.

It’s worth pointing out that not all specialists are keen on the sector at all, with Charles Murphy, senior research analyst at Singer Capital Markets, arguing that the underlying assets could ultimately prove hard to value in future, undermining the investment case.

Meanwhile, investors are seemingly overwhelmed with factors that complicate the picture, from shifts in power prices to bond yield moves and a political environment that looks increasingly hostile to the subsector.

As Hawksmoor’s Dan Cartridge adds, Reform UK is leading in the polls. “They have extreme negative views on the renewables sector,” he says. “That’s an ongoing reason for caution, although the next general election is still quite a long way off.”

Such considerations might understandably put off a potential investor. There are much simpler ways to bag a good yield, be it via a “core” infrastructure trust such as HICL Infrastructure PLC Ord  HICL

 (on roughly 7%), via equity income or via a UK government bond, whose 10-year instrument offers 4.5%.

Which trusts are the analysts favouring?

With the caveat that some may simply avoid a headache by not investing in the sector at all, trust brokers and analysts did pick out a few names they viewed as appealing.

Murphy, who as mentioned is generally pretty bearish on the sector, nevertheless views Foresight Environmental Infra Ord  FGEN

 as an interesting fund thanks to the fact that it’s so heavily diversified.

At the mid-point of 2025, the fund had a 27% allocation to wind power, with 14% in anaerobic crop digestion (where organic materials such as grass are broken down by microorganisms to produce renewable energy), 12% in solar power, 10% in biomass and smaller allocations to areas such as low-carbon transport and energy storage. The trust can have an eclectic mix of assets, with these including a fish farm in Norway.

Hawksmoor’s Cartridge is also a fan of Foresight’s diversification, while pointing to other trusts which have a good spread of assets and “where overall cash-flow profiles are more defensive” – for example with strong solar power generation last year to offset the falls suffered in wind generation. Here, he points to Octopus Renewables Infrastructure Ord  ORIT

 and the Renewables Infrastructure Grp  TRIG

To briefly linger on these names, ORIT unveiled something of a turnaround plan in September where it promised to continue and extend its share buyback programme, look to reduce its debt, sell down some assets and make selective new investments.

TRIG sought to roll into stablemate HICL last year, a plan that ultimately fell apart after it caused a stink among HICL investors. However, this drama may have alerted investors to the existence of TRIG as a possible takeover target.

The case for Greencoat UK Wind

Meanwhile, Greencoat UK Wind remains popular with the professionals, much as it does with ii customers.

Cartridge notes that it has “a unique funding model that has been successful over a long time”, while Peel Hunt’s Markuz Jaffe adds: “We like Greencoat UK Wind for the pure-play domestic strategy. It remains simple and is perhaps most exposed to the subsidy amendment but is linking [dividends] to inflation even if that’s now CPI rather than RPI.

“It has been a leader in trying to address the discount, via buybacks, changes to management fees and recycling capital to reduce gearing.”

The Peel Hunt team also has an eye on Bluefield Solar Income as a tactical opportunity, with a focus on how its sale process and strategic review is progressing. The trust is expected to give an update when it publishes its interim results in March. Jaffe notes that its peer, Foresight Solar, also looks interesting because of this.

“The portfolio is quite vanilla, it’s on a wide discount and its closest peer is going through a sale process, so there’s reason to expect a catalyst for a material rerating in the shares,” he says.

Not all rosy

An improving environment does not guarantee a recovery. Note, for example, that interest rates have already been falling over the last year, with no discernible rebound for most of the trusts in this sector. And investors may want to tread carefully.

Cartridge notes some caution on certain specialist names, for example. He points to ii customer favourite NextEnergy Solar, noting that the dividend yield at the NAV level is “higher than the discount rate, pointing to it being unsustainable” and Bluefield Solar.

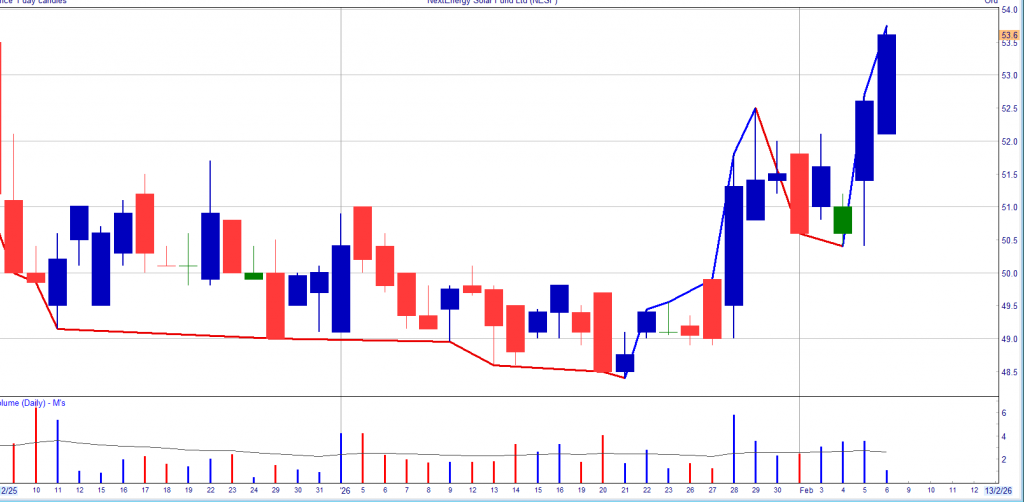
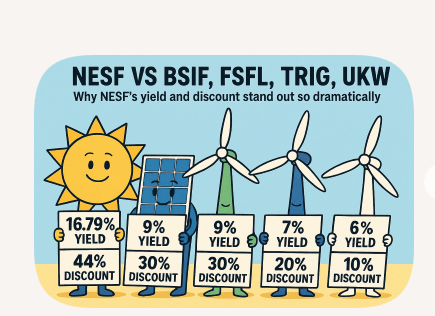
When it comes to NESF, it does have one of the highest yields in its sector.

However, the board has been in the midst of a strategic review “exploring all options to close the current discount”. Options discussed include exploring “opportunities to enhance shareholder returns” and upping the level of capital recycling. The findings of the strategic review are due out this year.

As ever, specialist funds tend to carry greater volatility than generalist options and can reward and punish adventurous investors in equal measure.

The battery storage funds have taught us that: the two remaining names, Gore Street Energy Storage Fund Ord  GSF

 and Gresham House Energy Storage Ord  GRID

suffered huge losses in earlier years but staged a fierce comeback in 2025. One factor here was the sale of rival fund Harmony Energy Income.

A Stocks and Shares ISA to earn a £300 monthly passive income.

How much do I need in a Stocks and Shares ISA to earn a £300 monthly passive income?

James Beard considers the passive income potential of a Stocks and Shares ISA

Posted by James Beard

Published 7 February

You’re reading a free article with opinions that may differ from The Motley Fool’s Premium Investing Services.

It’s estimated that approximately 15% of UK adults have a Stocks and Shares ISA. Many of these individuals will be using them to buy dividend shares to help provide a second income. As an added bonus, this cash can be enjoyed tax-free.

So without having to work for it, how much would someone need in an ISA to earn an extra £300 a month ? Let’s take a closer look.

Please note that tax treatment depends on the individual circumstances of each client and may be subject to change in future. The content in this article is provided for information purposes only. It is not intended to be, neither does it constitute, any form of tax advice. Readers are responsible for carrying out their own due diligence and for obtaining professional advice before making any investment decisions.

What’s achievable?

The answer to this question depends on the level of return achieved. For example, the FTSE 100 currently (5 February) has a historic yield of 3.1%. With a return like this, an ISA would have to be worth £116,129 to meet our £300 a month target.

But I reckon it’s possible to achieve a higher return by carefully choosing a diversified selection of high-yielding stocks. The 10 highest on the index are currently offering 6.4%, meaning our portfolio would need to be worth £56,250 to achieve our objective.

Of course, dividends cannot be guaranteed. However, there are plenty of stocks that have a long history of steadily increasing their payouts and offering above-average returns

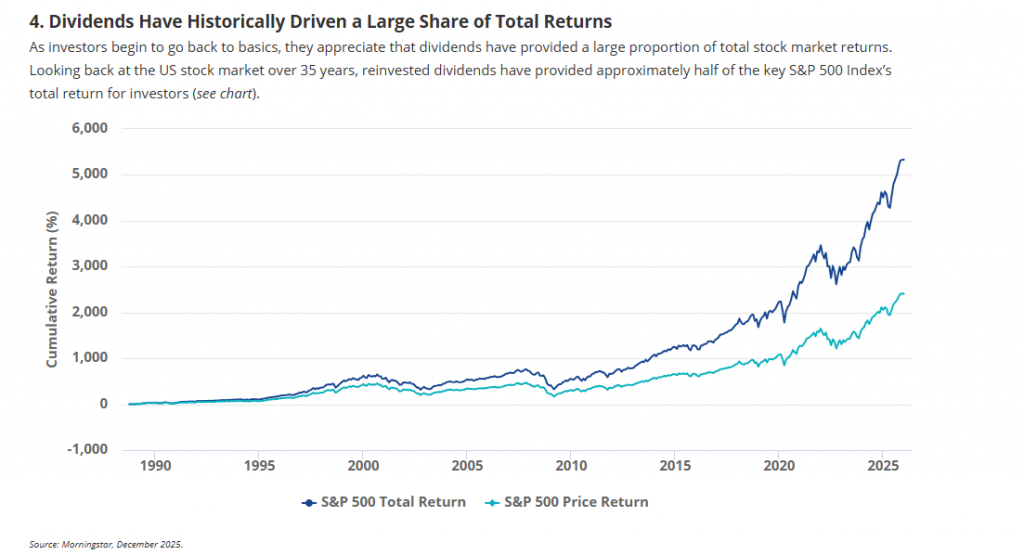
Why Dividends ?

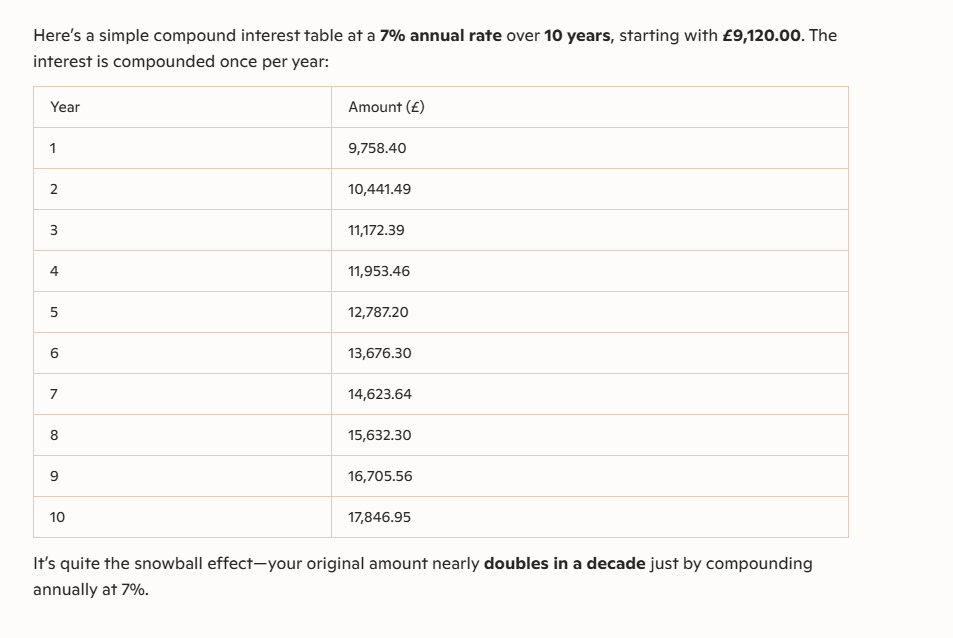
The plan for the SNOWBALL

The current plan for the SNOWBALL is 10k but hopefully we are on target for £10,441.49.

The dividend journey for the SNOWBALL

2023 £9,422

2024 £10,796

2025 £11,914

It’s better to set an achievable target and then try to beat the target which all depends on Mr. Market.

£1,000 monthly passive income

How much do I need in my ISA for a £1,000 monthly passive income?

Picking high-income stocks in an ISA can be a route to securing long-term passive income.

Posted by Alan Oscroft

Published 5 February

You’re reading a free article with opinions that may differ from The Motley Fool’s Premium Investing Services.

The ability to invest up to £20,000 per year in an ISA and not pay a penny tax on the passive income it can generate can be life-changing.

In the 2023/24 financial year, the latest for which we have the numbers, UK adults held 15m ISA accounts. And the total cash invested in those ISA accounts came to £103bn ! So we’re a nation of canny savers and investors, right ? Well, we need to dig a bit deeper.

Please note that tax treatment depends on the individual circumstances of each client and may be subject to change in future. The content in this article is provided for information purposes only. It is not intended to be, neither does it constitute, any form of tax advice. Readers are responsible for carrying out their own due diligence and for obtaining professional advice before making any investment decisions.

Pick the right one

Of those 15m ISA accounts, 9.9m were Cash ISAs — and only 4.1m were Stocks and Shares ISAs. Cash ISAs held £69.5bn, but only £31.1bn — less than half that amount — went into Stocks and Shares ISAs.

Cash ISAs can be a great way to protect some emergency cash or short-term savings. And for folks who really don’t want any stock market risk at all, the guaranteed returns offer a safer option. But over the long term, Stocks and Shares ISAs have wiped the floor with the Cash ISA alternative.

The top Cash ISA interest rates are currently a bit above 4%. And that’s actually not bad at all. But over the past 10 years, the average annual Stocks and Shares ISA return has come in at a whopping 9.6%.

The difference it can make

The total sum we’d need to build up depends on the rate of return we can achieve.

From that 9.6% Stocks and Shares ISA return, around £132,000 should generate enough passive income to cover our target £1,000 per month. And investing £500 per month with all dividends reinvested, we could get there in 12 years.

To get the same from a 4% Cash ISA return, we’d need more than £320,000. And at that interest rate, it should take 29 years to build that up.

To be fair, that 9.6% from shares has been above average for shares in general. But the 4% from cash can’t be maintained when Bank of England (BoE) rates come down. I can easily see Cash ISA interest getting down below the BoE’s 2% inflation target. To take home £1,000 per month from a 2% return, we’d need more than £600,000 — and 56 years to get there.

The target for the SNOBWALL is a return of 10% on seed capital of 100k. Hopefully in 2 years time it will earn income of 1k per month.

Your Snowball should be different to mine, to reflect you risk profile and how many years before you want to spend your dividends instead of re-investing them. Depending on how many years you have to re-invest your dividends there may be surplus income that you could continue to re-invest with.

Brett Owen: Contrarian Investor

Monthly Dividend Superstars:

11% Average Annual Yields

Most investors with $600,000 in their portfolios think they don’t have enough money to retire on.

They do – they just need to do two things with their “buy and hope” portfolios to turn them into $5,000+ monthly income streams:

  1. Sell everything – including the 2%, 3% and even 4% payers that simply don’t yield enough to matter. And,
  2. Buy my favorite monthly dividend payers.

The result? More than $5,000 in monthly income (from an average annual yield just over 11%, paid about every 30 days). With potential upside on your initial $600,000 to boot!

And this strategy isn’t capped at $600,000. If you’ve saved a million (or even two), you can just buy more of these elite monthly payers and boost your passive income to $9,166 or even $18,333 per month.

Now we’re talking!

But if you’re a billionaire, sorry, you are out of luck. These Goldilocks payers won’t be able to absorb all of your cash. With total market caps around $1 billion or $2 billion, these vehicles are too small for institutional money.

Which is perfect for humble contrarians like you and me. This ceiling has created inefficiencies that we can take advantage of. After all, in a completely efficient market, we’d have to make a choice between dividends and upside. Here, though, we get both.

Inefficient Markets Help Us

Bank $100,000 Annually (per Million)

Fortunately for you and me, the financial markets aren’t 100% efficient. And some corners are even less mature and less combed through than others.

These corners provide us contrarians with stable income opportunities that are both safe and lucrative.

There are anomalies in high yield. In an efficient market, you wouldn’t expect funds that pay big dividends today to also put up solid price gains, too.

We’re taught that it’s an either/or relationship between yield and upside – we can either collect dividends today or enjoy upside tomorrow, but not both.

But that’s simply not true in real life. Otherwise, why would these monthly payers put up serious annualized returns in the last 10 years while boasting outsized dividend yields?

For example, take a look at these 5 incredible funds that pay monthly and soar:

This is the key to a true “Monthly Payer Portfolio” – banking enough yields to live on while steadily growing your capital. It’s literally the difference between dying broke and never running out of money!

But I’m NOT suggesting you run out and buy these funds.

Some have been on my watchlist and in our premium portfolios over the years, but I mention them only as examples of the potential ahead.

And get paid every month, too.

« Older posts Newer posts »

© 2026 Passive Income Live

Theme by Anders NorenUp ↑