

Investment Trust Dividends




By Brad Thomas, Wide Moat Research February 2
I was recently reminded of Warren Buffett’s famous speech to Masters of Business Administration students at the University of Florida in October 1998: the one where he emphasized one of his most famous principles…
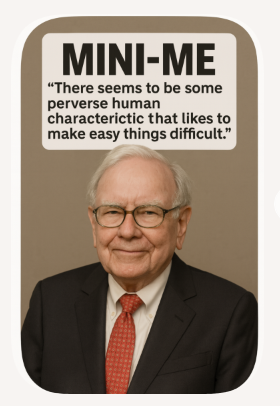
“Don’t lose money.“
It’s a great line – one of many from the Oracle of Omaha. And I’m glad that’s what still stands out today after all these years.
Not the part where he put real estate investment trusts (“REITs”) through the verbal wringer, saying:
REITs have, in effect, created a conduit so you don’t get the double taxation, but they also generally have fairly high operating expenses.
… let’s just say you can buy fairly simple types of real estate at an 8% yield or thereabouts, and you take away close to 1% to 1.5% by the time you count stock options and everything. It is not a terribly attractive way to own real estate.
Maybe [that’s] the only way a guy with $1,000 or $5,000 can own it. But if you have $1 million or $10 million, you are better off owning the real estate properties yourself instead of sticking some intermediary in between who will get a sizable piece of the return for himself.
Buffett wasn’t finished, adding:
REITs have behaved horribly in this market, as you know. And it isn’t at all inconceivable that they become a class that would get so unpopular that they would sell at significant discounts from what you could sell the properties for.
Moreover, even if they did improve as a class, he wondered, “whether management would fight you in that process because they would be giving up their income stream for managing things and their interests might run counter to the shareholders on that.”
But this REIT rebuke?
This wasn’t one of them. In fact, Buffett himself went on to recognize the error of his ways.
Some of you may remember my August 2025 article titled, “Buffett Bets on Billboards.” In it, I reported how his Berkshire Hathaway (BRK-A)(BRK-B) had just disclosed its investment into Lamar Advertising (LAMR).
Lamar is a REIT. A billboard REIT, to be specific.
Most anyone who drives along major thoroughfares throughout the U.S. has seen its signage towering above the landscape. Those ads direct you to the Chick-fil-A or McDonald’s at the next exit… a lawyer you can call if you’ve been hurt at work… or a jeweler at the outlets 20 minutes down the road.
Lamar has been in the billboard business for more than 100 years now, so it obviously has some staying power. And Berkshire recognized that in the second quarter of 2025 by buying up 1,169,507 shares and then again in the third quarter of 2025 with another 32,603.
Since that first purchase, Lamar has returned around 14%, outperforming the Vanguard Real Estate Index Fund (VNQ), a fairly reliable REIT benchmark.
That wasn’t the biggest purchase Berkshire ever made, of course. But it did mark a major shift in attitude toward REITs.
Nor was it Buffett’s first foray into REITs. His holding company purchased shares in Seritage Growth Properties (SRG), a spinoff from Sears, in 2015. That was a special sort of situation, admittedly, but it was still holding shares.
And in 2017, Berkshire bought a sizable 18.6 million shares in STORE Capital (formerly STOR), a prominent mall REIT that was publicly traded at the time. It then backed the truck up on that decision in the second quarter of 2020 – at the heart of the COVID-19 lockdowns – with another 5.79 million shares.
Could we see more REIT purchases from Berkshire? That’s what I’m wondering, especially now that Buffett has stepped down and there’s new management at the helm.
Mere weeks ago, on New Year’s Day, Warren Buffett made history by stepping down from managing Berkshire Hathaway’s day-to-day operations… 60 years after he first accepted the CEO role.
Everyone knows the legend he has become, the money he has made, and the wisdom he has provided. But even the best races have to come to an end eventually, and sometimes they need to.
Buffett, who is still chairman, can probably use a bit of a break. He is 95, after all.
Not to say that his successor, Greg Abel, is a spring chicken at 63. One of Buffett’s key lieutenants for the past 25 years, he has been instrumental in acquisitions such as MidAmerican Energy – now Berkshire Hathaway Energy – and overseen important aspects of many other company holdings.
But that combination of experience and comparative “freshness” is probably precisely what a well-established giant like Berkshire needs in a world of artificial intelligence (“AI”), cryptocurrencies, and other alternative investments.
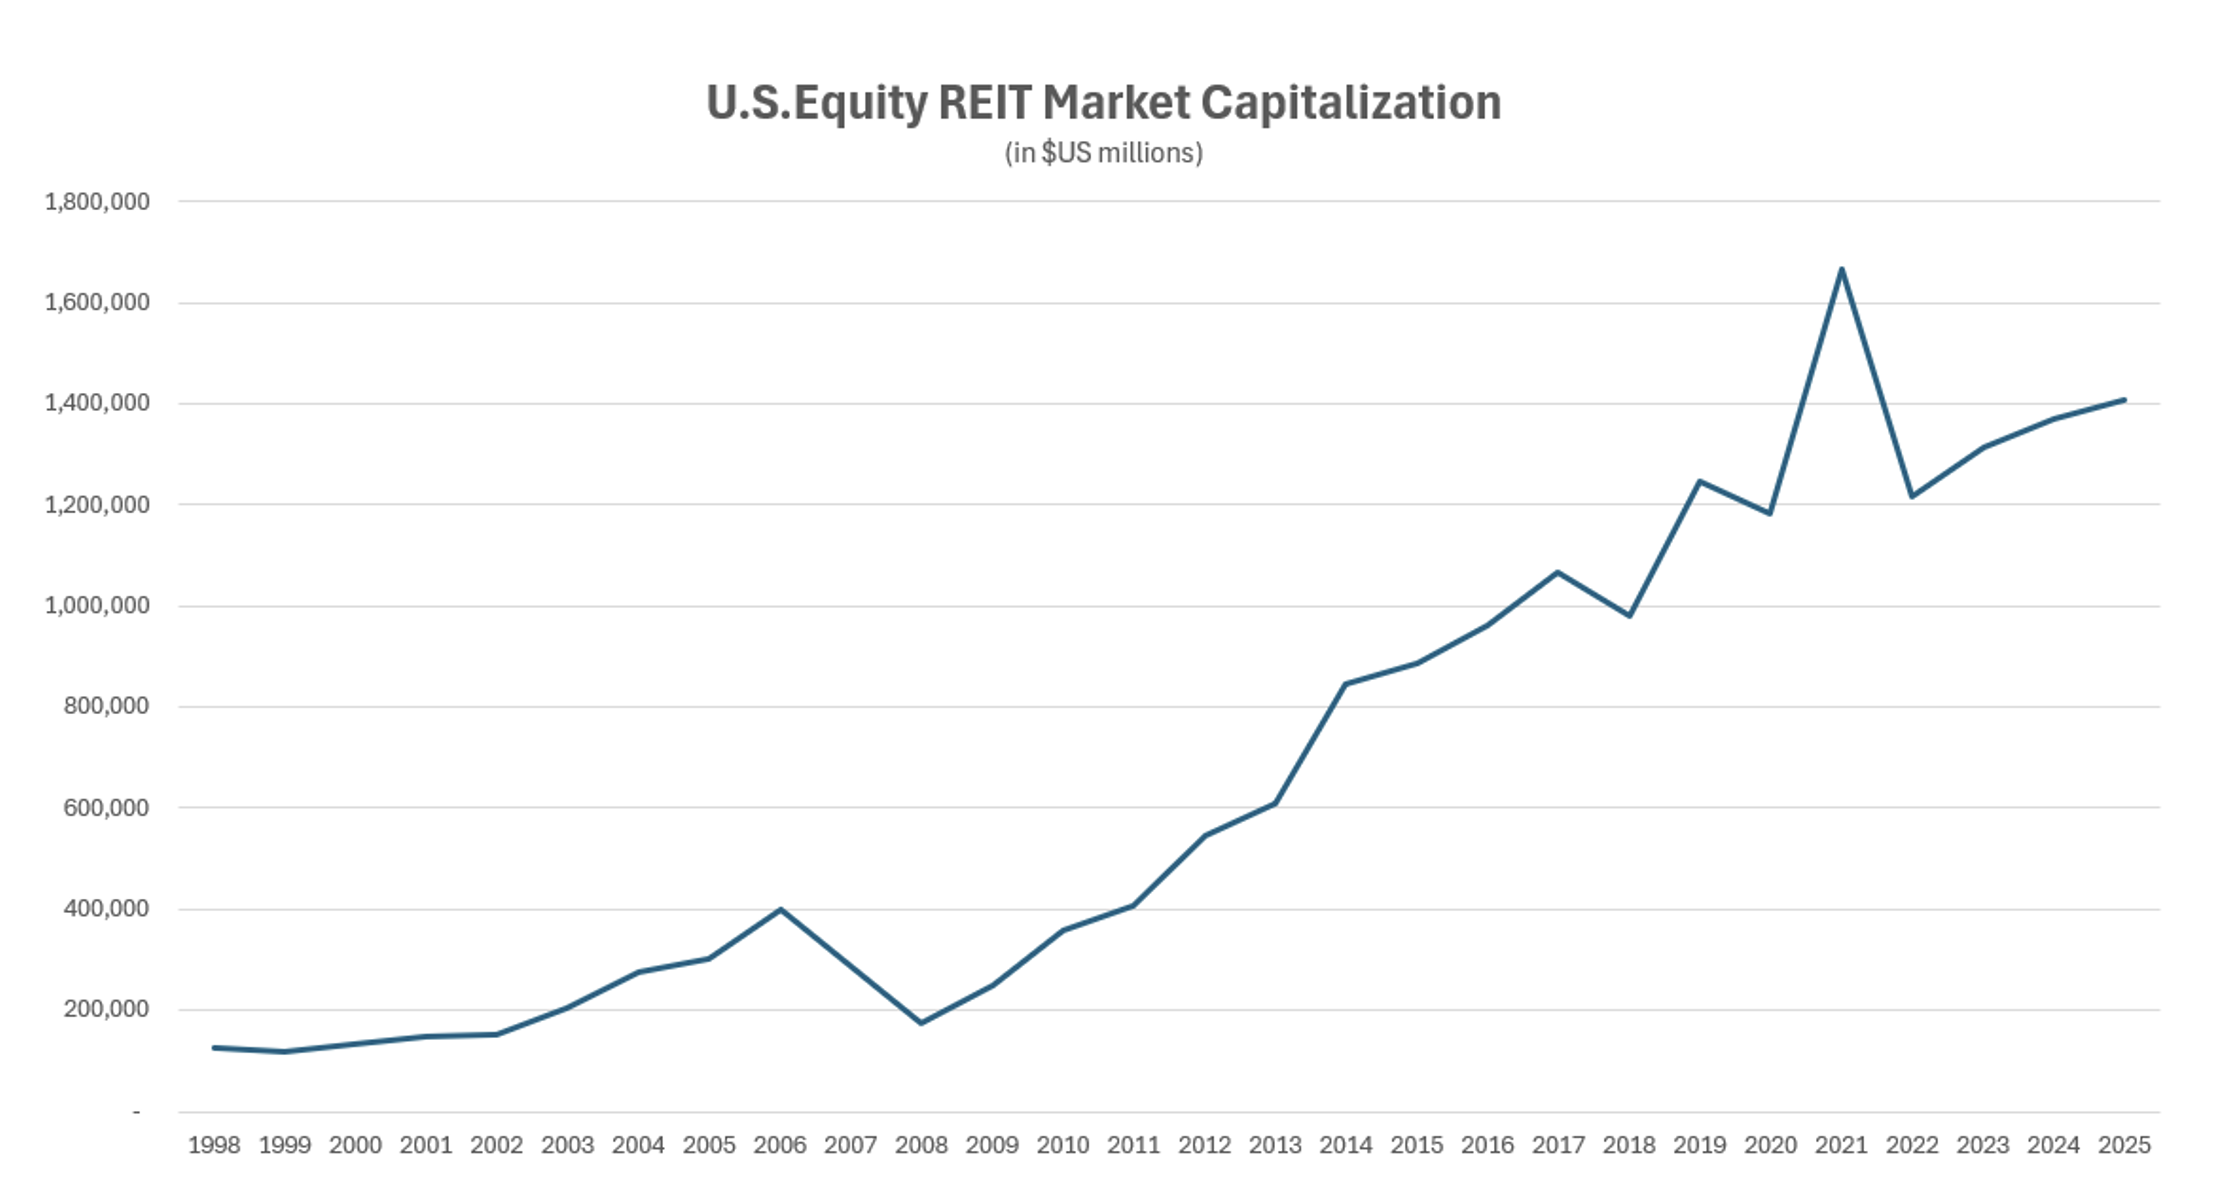
We’ve also long-since crossed the point of REIT profitability. When Buffett talked about them in that speech 28 years ago, the asset class was still in its infancy, with a market capitalization of around $126 billion.
It has since mushroomed to over $1.4 trillion, undeniably erasing Buffett’s prediction that REITs could “get so unpopular… they would sell at significant discounts.”
These real estate companies have also become their own broader investment universe. REITs were formally moved out of the financials sector under the Global Industry Classification Standard and into their own real estate sector in 2016. And they’ve added new categories like cell towers, data centers, farming, timber, and single-family rentals – which I wrote about recently.
Better yet, over the past 30 years, REITs have delivered strong double‑digit average annual total returns of about 12% across the various subsectors. This places them among the top-performing major asset classes over multidecade periods.
In short, there are plenty of solid, safe, and growing opportunities. And Abel, who might very well have been behind last year’s Lamar purchase, is young enough to more readily forgive REITs their bumpy beginnings.
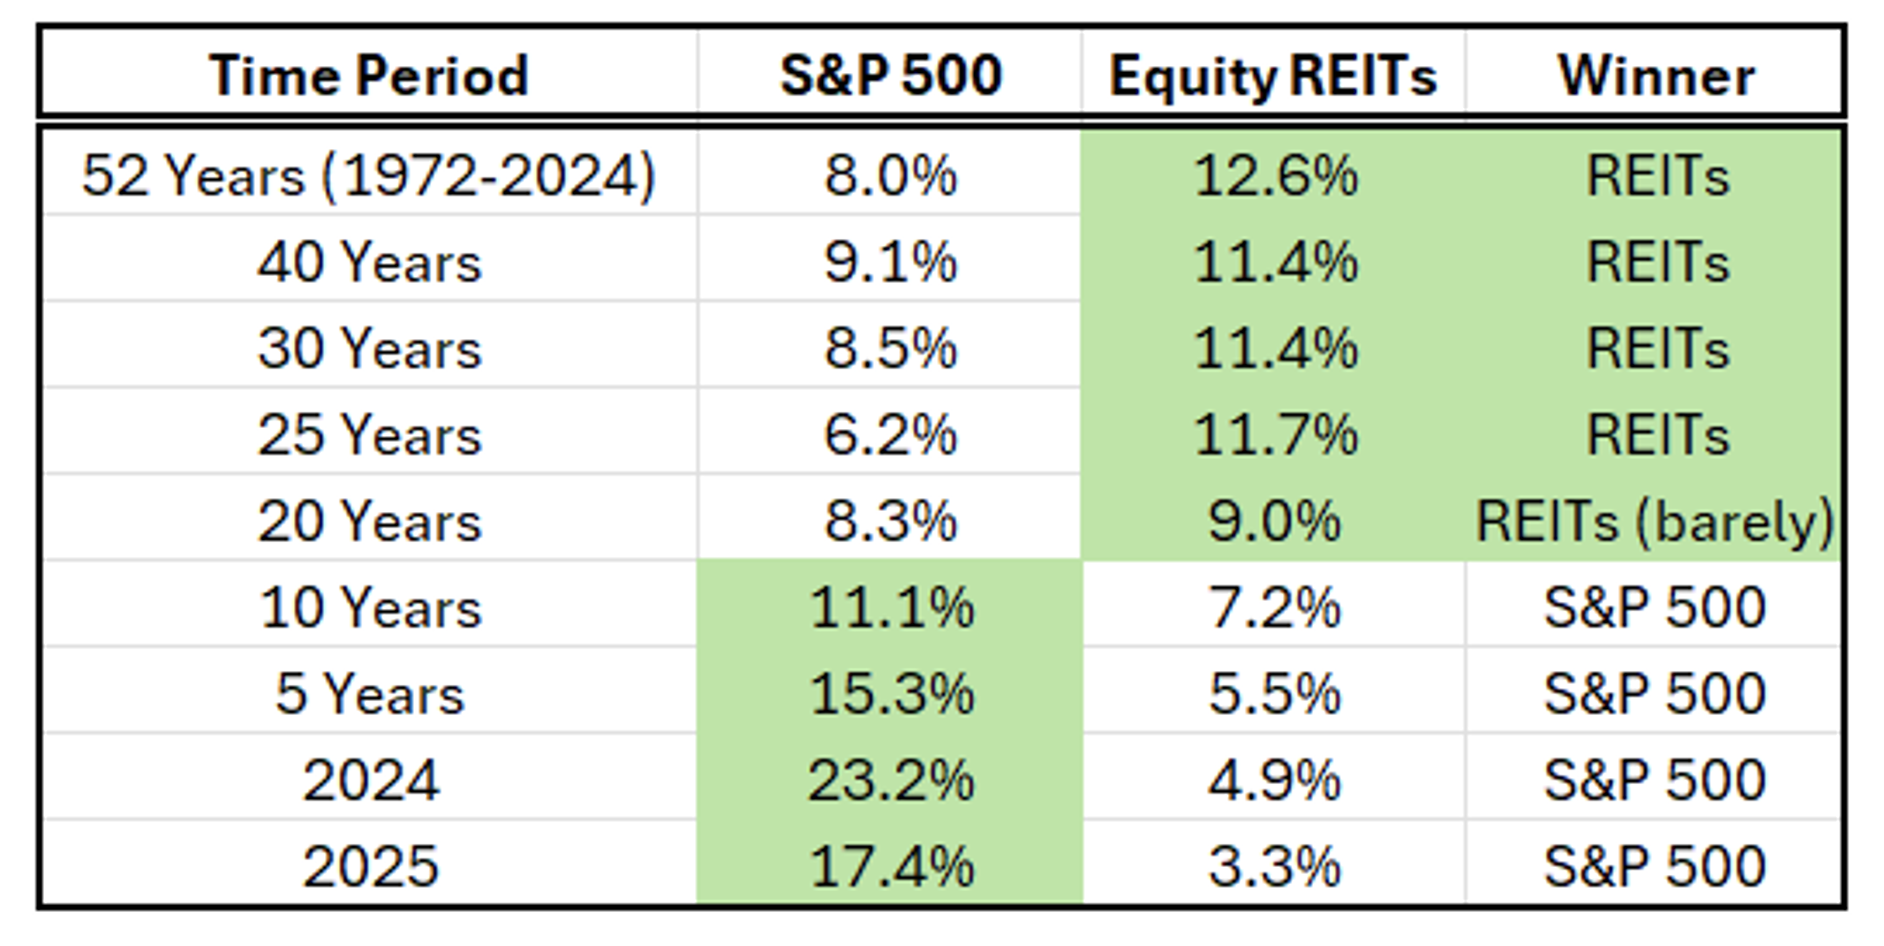
Source: Wide Moat Research
Regardless of what real estate decisions Berkshire makes from here, our team at Wide Moat Research remains laser-focused on REITs – the ones that enjoy durable competitive advantages. So we’ll keep meeting with management teams that create value for their companies, their clients, and their shareholders alike.
To reference Warren Buffett one more time, if you don’t “have $1 million or $10 million” to own “real estate properties yourself”… along with the proper knowledge, wisdom, and time to make that money count…
REITs really can be a great way to own real estate. I’m confident this year will showcase plenty of examples of how worthwhile they can be.
| best sweepstakes casino youtube.com/watch?v=9F8PP_f9F1Ix albafatnowna540@yahoo.com 104.194.153.224 | Howdy would you mind letting me know which webhost you’re using? I’ve loaded your blog in 3 completely different internet browsers and I must say this blog loads a lot faster then most. Can you suggest a good internet hosting provider at a reasonable price? Many thanks, I appreciate it! |
Word Press thru FastHosts
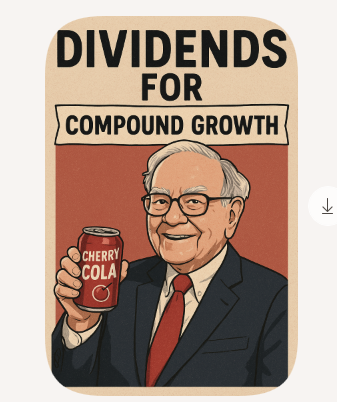
Warren Buffett once called these stocks’ dividend growth “as certain as birthdays.” Here’s how they’re doing.
Story by William Dahl
In his 2022 annual letter to Berkshire Hathaway shareholders, Warren Buffett had no shortage of good news to tout. Since he took the helm of Berkshire in 1964, the conglomerate had notched a 3,787,464% gain, compared to 24,708% for the S&P 500 — enough to turn every $1 initially invested into $37,875.
Yet the first number he brought up, apart from calling his capital allocation decisions in his 58-year tenure “so-so,” was to cite two investments that he said were central to Berkshire’s success.
These two companies, each of which Berkshire coincidentally had invested $1.3 billion into, now paid annual dividends amounting to almost half of Berkshire’s initial investment. This yield on cost was, Buffett predicted, highly likely to grow thanks to dividend hikes.
A line of hundred dollar bills seemingly sprout from the ground.© Getty Images
Of course, this was more than three years ago. What were the two dividend stocks that Buffett felt deserved a special mention? And was his confidence in them well-placed?
Buffett established his position in soft drink giant Coca-Cola (NYSE: KO) over a seven-year period, buying his 400 millionth share in August 1994.
He hasn’t bought a share since, but neither has he sold. And there’s a good reason.
In 1994, Berkshire was receiving $75 million a year in dividends from Coca-Cola. During the next 28 years, as the dividend increased each year, that number swelled to $704 million in 2022.
Today, Coca-Cola shares yield 2.8%. But while the $1.3 billion Buffett paid for his investment remains fixed, the annual dividend’s continued growth pushed his yield on cost up to almost 50%. That’s a remarkable feat considering that the S&P 500 has averaged annual returns of 10.5% during the past 70 years.
And since Buffett’s 2022 letter, the dividend had been boosted each year as he predicted. Those 400 million shares now pay Berkshire $206 million a year in dividends, at least until this March, when the company’s next quarterly dividend will go out after its expected 64th annual dividend increase.
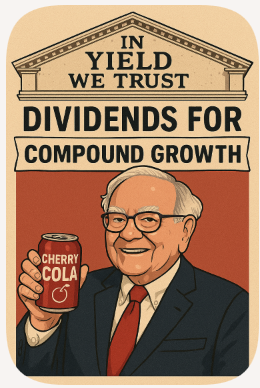
Today, American Express shares yield less than 1%, as a 191% gain in share price during the last five years has pushed the yield down. But to Buffett, I suspect his yield on cost is far more important. Annual dividends, which totaled $302 million in 2022, have now grown to $577 million, or almost half of Buffett’s initial investment.
Coca-Cola’s management doesn’t release dividend forecasts. However, with more than 50 years of dividend growth to its name, it has won the title of Dividend King, which barely one in 1,000 companies have achieved. Because management will be loathe to give that up, it’s very likely to announce yet another dividend hike next month, especially since it achieved robust earnings growth of 30% year over year last quarter.
Cruise Deals – We Won’t Be Beaten On Price – Cruise 118 | Cruise Holidays
In the case of American Express, the company increased its annual card fees for the 29th consecutive quarter in Q3, and we’ll see if the trend persists in its Q4 earnings call scheduled for Jan. 30. With earnings up 19% year over year, the company should have no difficulty raising its dividend, especially considering how its $2.3 billion in share repurchases means that the company will be mailing checks on fewer shares
With fundamentals and track records like these, you can see why Buffett highlighted Coca-Cola and American Express as examples of “the secret sauce” behind Berkshire’s stunning success. And as in 2022, their payouts look highly likely to rise in the years ahead.
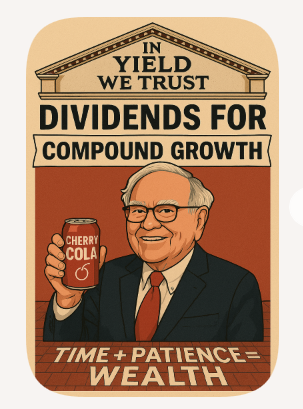
If you haven’t got 40 years to your retirement, investing in shares that yield 1.8%, will not pay for that cruise you promised yourself, so you will have to take a higher risk and buy shares that have a higher starting yield.
Story by Holly Mead
Activist investors takeover concept investment trust© Getty Images
Investment trusts are popular among DIY investors but activist investor Saba Capital Management may have rattled some nerves as it starts the new year with a bang.
Already it has initiated a second attempt to oust the board of Edinburgh Worldwide, but the proposals were rejected. It has also revealed a 5.3% stake in GCP Infrastructure, and seemingly got its way on converting Smithson to an open-ended fund.
Saba, a New York-based hedge fund group, launched its unprecedented campaign in December 2024 and is only gaining momentum. It has proposed to replace boards, narrow discounts and shake-up strategies.
While some experts have questioned Saba’s motives, others say some kind of intervention was overdue: boards had become complacent, with discounts too wide, performance lacklustre, and fees uncompetitive.
Could Saba pursue more close-ended funds ?
Saba, run by former Deutsche Bank trader Boaz Weinstein, has stakes in 46 of the 305 UK-listed investment trusts, with positions of at least 10% in 16 of them. Its biggest stakes are in Herald Investment Trust (30.7% as of mid-January) and Edinburgh Worldwide (30.1%).
But it is not the only activist in town. Allspring has stakes in 46 investment trusts, and 1607 Capital Partners in 40, according to wealth manager AJ Bell. Plenty more are operating on a smaller scale.
A wide discount is often likely to pique an activist’s interest. Investment trusts trade at two prices: the net asset value (NAV) is the value of its underlying assets divided by the number of shares, and the share price, which is what investors actually pay to buy and sell shares.
When the share price is higher than the NAV, the trust is trading at a premium. When it is below the NAV, it is trading at a discount. At a 10% discount to NAV, investors can effectively purchase 100p worth of assets for 90p. If the discount closes, they make a profit – this is often the main goal of an activist.
There may be reason to worry about trust discounts. Look out for trusts that have persistently underperformed their peers and are trading on a wider discount than their sector average. For example, the average discount in the Global sector is 8%, but Lindsell Train’s is 21.3%. Over three years, the trust has returned -27.7% versus a sector average of 37.9%, Trustnet data sh
Consider sectors, too. Just three of the 19 trusts in the UK Equity Income sector have beaten the market over ten years. This could make the group a target as investors may be more likely to ditch underperforming active investments in favour of passive ones that track the market.
Dan Coatsworth, head of markets at AJ Bell, suggests Scottish American as potentially vulnerable; an underperformer trading at a 9.2% discount, significantly wider than the 3.1% average for its Global Equity Income sector. Coatsworth says: “The trust is managed by Baillie Gifford, which runs various other trusts already subject to campaigns by Saba. The activist might feel compelled to turn the screws on Baillie Gifford given the latest Edinburgh Worldwide defeat.”
Some infrastructure trusts are being targeted because their assets are in demand but the sector is not popular with investment trust users.
Thomas McMahon, head of investment companies research at Kepler Partners, says: “In this scenario, a better return can be made by selling the assets or buying back large amounts of stock, rather than investing in the portfolio. Sometimes external activists can see this more clearly, while the manager may have their head in the sand.”
Watch for notifications. A trust must alert the stock exchange if their holding in a company passes 3%, and then each time that stake moves up or down by 100 basis points. That should mean the arrival of an activist doesn’t come as a surprise.
This can be more difficult to gauge if the shares are owned through other vehicles or derivatives, says McMahon, but investment boards and market commentators can help decipher these holdings.
While the arrival of an activist can cause a stir, it isn’t necessarily a sell signal. Depending on their motivations, activist investors can be a force for good.
James Carthew, co-founder of Quoted Data, says: “When you have a strategy that isn’t working and investors are selling but the board isn’t taking action, then someone pushing for change can be a good thing.”
He points to Alliance Trust as one example. After the activist Elliott appeared on its register, major changes were made to the running of the trust, which eventually merged with Witan. “That was a catalyst for positive change,” says Carthew.
Even if an activist’s proposals are not passed, their presence can jolt a board into action. That can be seen in the industry’s behaviour since Saba emerged. The average discount has narrowed from 15% at the end of 2024 to 12% today, according to the Association of Investment Companies (AIC), an industry body.
Annabel Brodie-Smith, communications director at the AIC, says: “Boards have been taking steps to protect themselves. Last year saw a record 27 deals, including mergers, acquisitions and liquidations. It was also a record year for share buybacks and fee changes.“
But Saba has been accused of trying to make a quick buck, rather than pushing for meaningful changes in the long-term interests of shareholders. Carthew says: “Normally activists don’t buy enormous stakes and try to force things to happen. They buy smaller stakes, suggest ideas and take other shareholders along with them.”
To determine whether an activist has shareholders’ best interests at heart, look at their track record to see what they have done before. Read their proposals and the response from the investment trust board to get a feel for both sides.
Weigh up their motivations against your own and don’t get distracted by a potential short-term gain. Look at CQS Natural Resources, says Carthew: the trust announced a tender offer last May, giving investors the option to sell at NAV. Its discount had already narrowed from 15% to 5%, but many investors exited. But the share price has since doubled, giving those who stayed a far more significant gain.
Consider why you hold the trust. If your original reasons for investing still stand, don’t get side-tracked, and be sure to vote on any proposals. Brodie-Smith says: “Remember that investment trusts are not for a quick buck, they provide a long-term approach to investing, and many offer consistent and rising income over time.”
With so much drama surrounding the industry, some investors could be tempted to eschew trusts altogether. Carthew believes that would be a mistake. Activists are a normal and healthy part of the market and, while they create a lot of noise, they are a relatively small piece of the pie.
Investing in potential activist targets could even be a good strategy, says McMahon, if their goal is to unlock value. Coatsworth adds: “Boards have realised that trusts cannot limp along and hope for the best – when something isn’t working, the alternatives must be explored.”
Maybe a Trust that pays you a dividend ? Just in case Mr. Market doesn’t care about your research

Can regular investment in income stocks be the rocket fuel for someone’s dreams of building wealth? Christopher Ruane explains why it may be.
Posted by Christopher Ruane
Published 2 February
You’re reading a free article with opinions that may differ from The Motley Fool’s Premium Investing Services.
Every week, FTSE 100 income stocks pay out well over a billion pounds on average to shareholders as dividends.
That is just the FTSE 100. Lots of smaller British companies also pay out hefty amounts in dividends.
So, could someone aim to build serious wealth over the long term simply by investing in carefully chosen UK income stocks?
I think the answer is yes, for three main reasons.
The first reason is the benefit of long-term regular investment.
Even with relatively modest amounts, drip feeding money into an investment over the long term can mean things soon add up.
A second factor is how much the dividends can add on top of the money invested. Dividends are never guaranteed, but they can be substantial.
If they last, then someone who buys one share in a company today could potentially be earning dividends from it for decades – perhaps as long as they live, if they hang onto it.
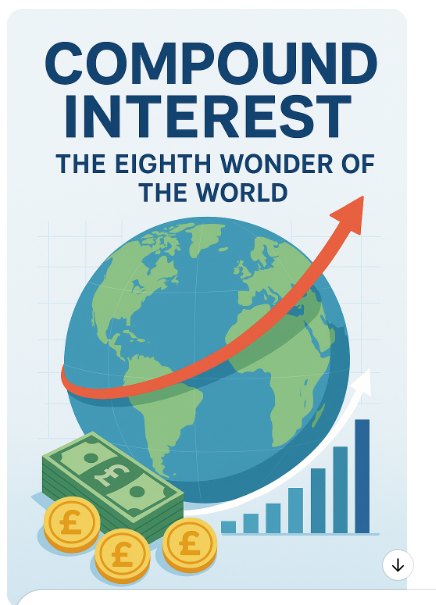
A third factor is what is known as compounding. That means dividends being reinvested and so in turn earning more dividends.
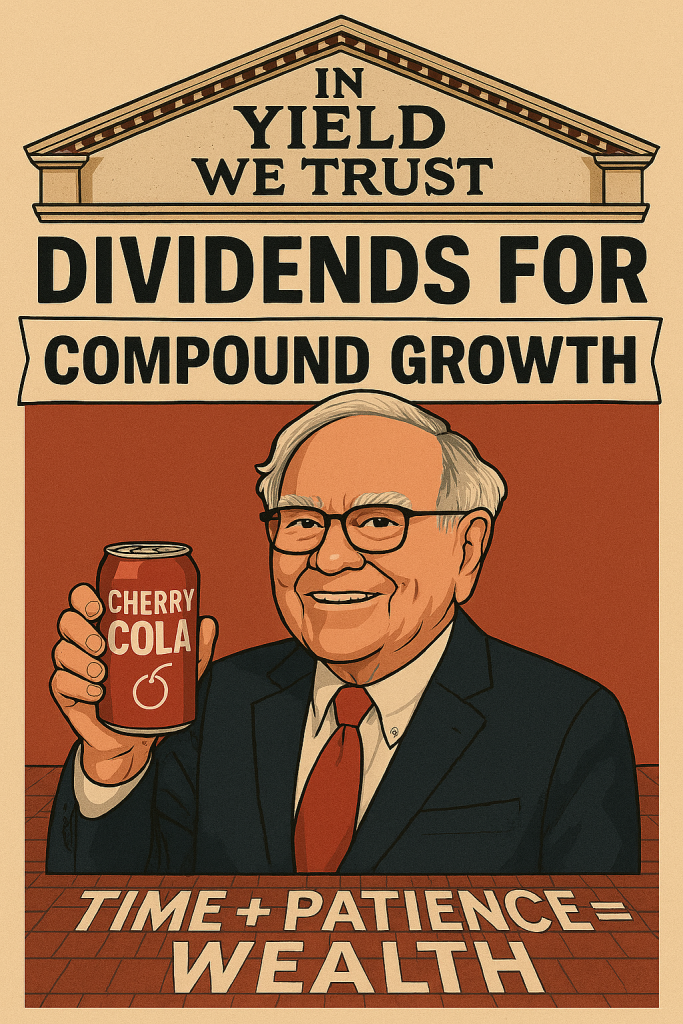
Billionaire Warren Buffett compares an income stock compounding to pushing a snowball downhill. As it rolls, the snowball gets exponentially larger because snow picks up more snow and so on. In the stock market, that snow can be dividend income!
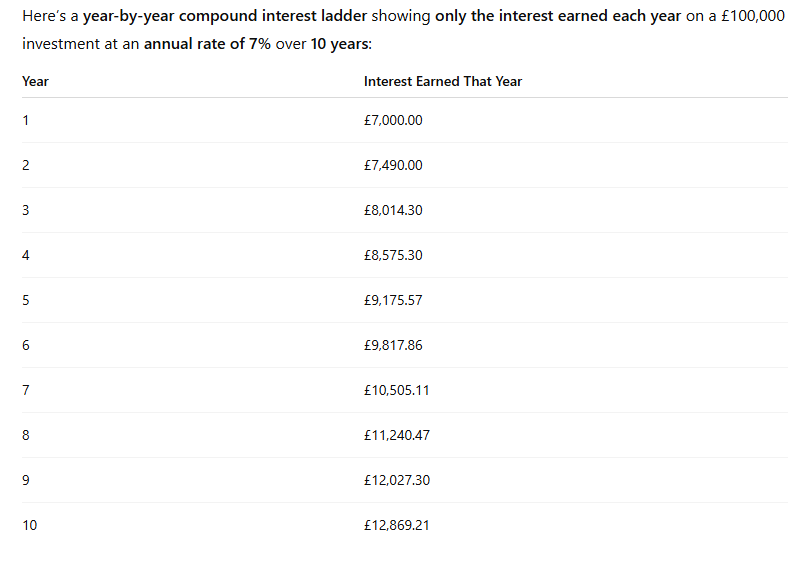
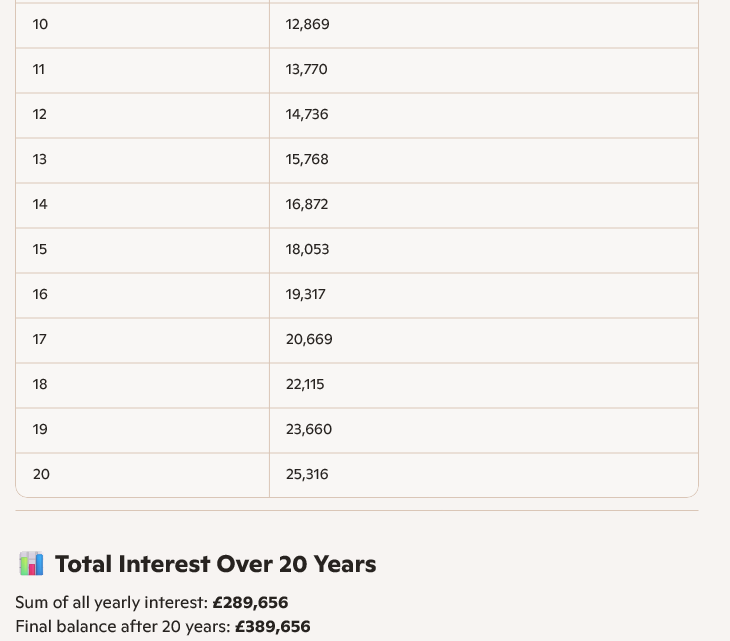
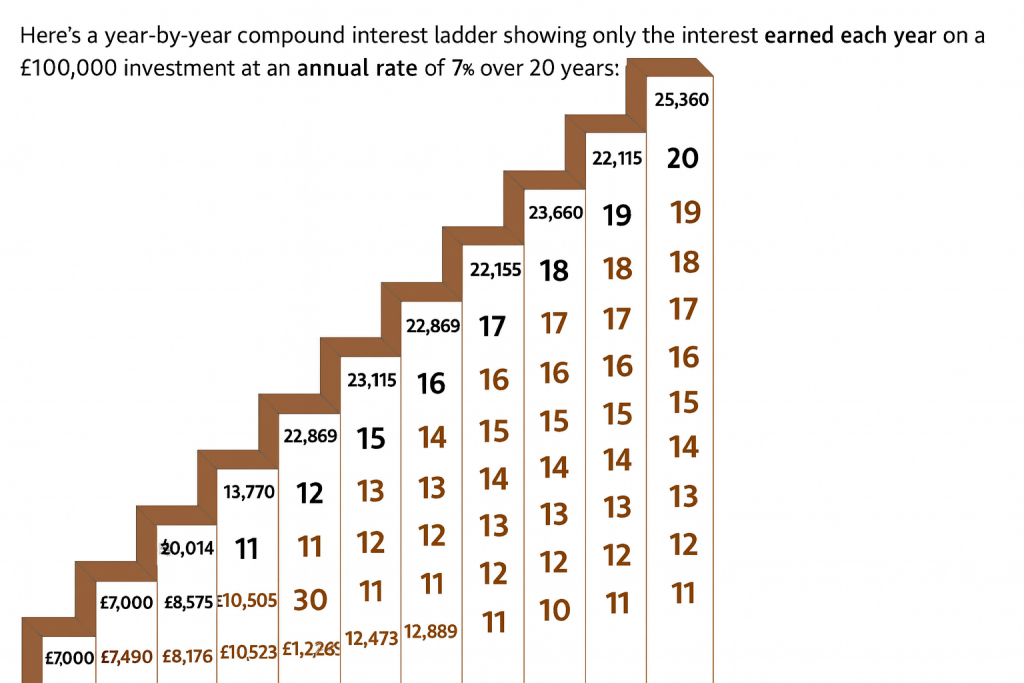
Over a long period of 20 years, you may not be able to re-invest the dividends at 7% but with compounding and with the table the interest is only added at the end of the year, where your dividends will be buying more dividends every month.
As an example, say someone starts with nothing today then invests £500 a month and compounds their portfolio at 5% a month.
5% is well above the current FTSE 100 yield of 2.9%, but there are plenty of blue-chip UK income stocks that offer a yield of 5% or higher.
At the end of the 35-year period, the portfolio should be worth over £554,000.
So the investor would be over half way to becoming a millionaire, on the back of investing £500 a month.
Dunedin Income Fund
11 December 2025
Third Interim Dividend
· Third interim dividend of 4.25p per share.
· Total dividend for the year to 31 January 2026 of at least 19.10p per share, representing an increase of 34.5% compared to the previous year.
· Notional dividend yield of 6.0% on NAV and a share price dividend yield of 6.4%.
On 9 September 2025, the Board announced that it would significantly increase dividend distributions to shareholders and, for the year ending 31 January 2026, the Board has already stated its intention that the Company’s dividend will be increased to a minimum of 6.0% of the NAV as at 31 July 2025, offering an attractive yield compared to cash, the FTSE All-Share Index and peers in the UK Equity Income sector. This amounts to a total dividend for the year of at least 19.10p per share, an increase of 34.5% compared to the total dividend of 14.20p for the year ended 31 January 2025. Based on the share price of 297.0p as at 10 December 2025, this represents a notional dividend yield of 6.4%.
A first interim dividend in respect of the year ending 31 January 2026, of 3.20p per share, was paid on 29 August 2025 and a second interim dividend of 4.25p per share was paid on 28 November 2025.
The Board has today declared a third interim dividend in respect of the year ending 31 January 2026, of 4.25p per share, which will be payable on 27 February 2026 to shareholders on the register on 6 February 2026 with an ex-dividend date 5 February 2026.
The remaining dividend for the financial year is expected to comprise a final dividend of at least 7.40p per share payable in May 2026. A formal dividend announcement will be made in advance of this payment.
It is the Board’s intention to continue with a progressive dividend policy with growth in absolute terms in future years from the increased level, and for future financial years the Board anticipates three equal interim dividend payments followed by a balancing final dividend.

You may be thinking of adding DIG to your Snowball.
If you buy before the xd date, you will earn the dividend of 4.25p, with the final dividend being 7.4p. You could receive another 3 dividends of 4.25p in just over a calendar year, total a yield of around 8%. If the share has made a capital gain you could flip it and buy another high yielder of continue to hold for its dividend.
Thursday 5 February
Aberforth Geared Value & Income Trust PLC ex-dividend date
AEW UK REIT PLC ex-dividend date
Bluefield Solar Income Fund Ltd ex-dividend date
CQS Natural Resources Growth & Income PLC ex-dividend date
CVC Income & Growth Ltd EURO ex-dividend date
CVC Income & Growth Ltd GBP ex-dividend date
Dunedin Income Growth Investment Trust PLC ex-dividend date
Polar Capital Global Healthcare Trust PLC ex-dividend date
Residential Secure Income PLC ex-dividend date
Starwood European Real Estate Finance Ltd ex-dividend date

You may be considering buying BSIF for your Snowball.
The current yield is 12% and the dividend 2.25p.
The first check is to see if the company intends to pay future dividends.
Update on Formal Sale Process
The Strategic Review and Formal Sale Process announced by the Company on 5 November 2025 continues in line with the Board’s expectations. The Company will provide a further update when it issues its interim results in early March 2026 unless there are any material developments in the meantime.
The company is for sale, so future dividends are not guaranteed.

The current discount to NAV is 35%. In the current market it’s unlikely anyone will buy at the NAV but there could be a bid premium, so the SNOWBALL continues to bank the dividends and awaits corporate news.
© 2026 Passive Income Live
Theme by Anders Noren — Up ↑