Marks & Spencer
Figure 12: Marks & Spencer (GBp)

We have discussed Marks & Spencer in our previous notes (see page 19 for a list of these). Its share price has been volatile, but recent performance has moved it back into the list of the 10 largest holdings.
Last year’s damaging cyber-attack has been put behind it, the store refreshment programme is bearing fruit, and the food division is taking share from rivals. TMPL’s managers highlight 4.6% margins on food for the financial year to the end of March 2026 as particularly pleasing.
TMPL’s managers still see more upside in the share price, which they feel is not yet fully reflecting the evident turnaround in the company.
GSK
GSK has also moved into the top 10 following a recovery in its share price. This is not a fast-growing business, but it is delivering revenue growth of about 3% per annum, which is feeding through into double digit organic earnings growth. TMPL’s managers had felt that positive story was not reflected in its rating.
Figure 13: Barclays price/book (x)

TMPL’s financials exposure has been a big driver of its recent returns, and the managers have been taking profits from this area. The managers observe that almost everything has gone right for TMPL’s bank holdings, for example. Even a couple of years ago, these stocks were very lowly rated. However, rising interest rates opened up net interest margins, costs have been taken out – latterly with the help of AI (there is more to go for on this front), and loan losses have been kept under control.
However, another significant factor in the re-rating of financials stocks has been the considerable share buybacks that these companies have undertaken, which is feeding through into their EPS growth.
Diageo and other consumer staples
Figure 14: Diageo (GBp)

One sector that Redwheel has been adding to is consumer staples. The managers observe that this is an area that was once the highly-rated preserve of growth-style managers, but a severe de-rating has brought many of these companies into TMPL’s orbit. Stocks in the portfolio include Kraft Heinz, Carrefour, J.M. Smucker, and Diageo.
Diageo’s derating has been savage, with the shares more than 60% below their peak. New CEO, Sir Dave Lewis (ex-Tesco) joined at the start of 2026. One part of his turnaround plan for the company was to halve the dividend, conserving cash to invest in leading brands. He is also focused on cutting costs, decentralising the business to make it more dynamic, refreshing the leadership team, and selling off non-core assets.
Guinness (and Guiness Zero) is delivering sales growth, as is its emerging markets business. However, TMPL’s managers are unsure whether falling spirits sales in North America reflect a structural trend for the drinks industry rather than a stock specific or cyclical issue. That uncertainty is reflected in the position size.
BP
Figure 15: BP (GBp)

BP is another self-help story in the portfolio. Aside from the impetus given to the stock by the recent oil price increases, the main catalyst has been the shake-up led by its new CEO, Meg O’Neill, who took over on 1 April 2026. Meg was previously CEO of Woodside Petroleum and prior to that spent over 20 years at ExxonMobil. The TMPL managers have met her and were impressed.
TMPL’s managers believe that a key priority will be to unwind the low-return energy transition investments the company made under Bernard Looney (who was the CEO between 2020 and 2023). That process is already underway, and disposals will be used to reduce debt. There is also a need to stabilise the ship after a run of changes at the top of the company, including the recent dismissal of its chair.
ITV
In September 2020, when we wrote about ITV in our first note on TMPL, we commented that TMPL’s managers felt that all of the company’s market capitalisation could be accounted for by its studios business, and in their view, the broadcast business was “in for free”. On 6 July 2026, Sky announced that it would pay up to £1.6bn for ITV’s media and entertainment business. Surprisingly, ITV’s share price fell on the day and is currently lower than it was back in September 2020. It is hard to fathom why this might be, but TMPL’s managers suggest that investors might be unwilling to price in a deal that looks unlikely to complete before H2 2027. In the meantime, it may be that a soon-to-be standalone studios business attracts attention from another bidder; Netflix, for example.
Software and IT services
TMPL has very little exposure to the IT sector currently, but recent falls in the share prices of software and IT stocks have encouraged the managers to have a closer look at some of these companies.
For the moment, the software-as-a-service stocks that have seen sharp share price falls are still too highly-rated to be attractive to TMPL. However, amongst the IT services stocks, many are now on low double-digit or even single-digit earnings multiples. The analyst team is delving into some of these names in more detail.
Performance
Figure 16: Total return performance over periods ending 31 July 2026
| 3 months (%) | 6 months (%) | 1 year (%) | 3 years (%) | 5 years (%) | |
|---|---|---|---|---|---|
| TMPL share price | 8.8 | 11.6 | 31.0 | 101.9 | 149.8 |
| TMPL NAV | 8.5 | 10.8 | 28.4 | 87.2 | 124.0 |
| MSCI UK | 5.2 | 8.5 | 23.6 | 58.1 | 90.3 |
| MSCI UK Value | 8.8 | 13.1 | 36.9 | 84.4 | 131.6 |
| MSCI World | 5.2 | 9.8 | 18.2 | 57.4 | 75.4 |
| Peer group1 NAV median | 7.5 | 8.6 | 19.6 | 49.7 | 61.4 |
| Peer group1 share price median | 8.4 | 8.3 | 21.2 | 44.9 | 64.1 |
Source: Bloomberg, Marten & Co. Note: 1) The constituents of the peer group are listed below
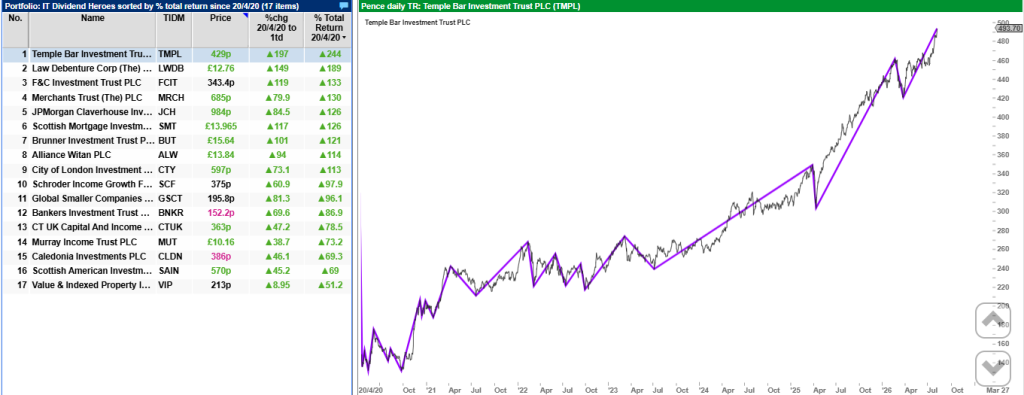
TMPL’s three-year and five-year returns remain comfortably ahead of its benchmark and, as we discuss below, peer group averages.
TMPL’s returns relative to the MSCI UK Value Index are skewed by the high levels of concentration within that index. At 30 June 20216, HSBC was 19.1% of the index, Shell 12.8%, Unilever 7.7%, and BAT 7.3%, which limits its usefulness as a comparator. HSBC’s share price is up about 70% over the past 12 months.
TMPL’s impressive recent track record owes much to its financials exposure, which we discussed on page 9. Redwheel says that notable contributions to TMPL’s returns have come from stocks such as Standard Chartered, Barclays, NatWest, and Aberdeen Group.
Figure 17: Temple Bar NAV relative to MSCI UK (sterling total return) to 31 July 2026

WPP
Figure 18: WPP (GBp)

The only meaningful detractor from returns has been WPP; however, this is a stock that the managers feel has a lot of potential. Under Martin Sorrell, WPP was built – through a series of acquisitions – into one of the world’s largest advertising agencies and the leading media buyer. A market cap that peaked at around $30bn is now around $4bn. While other big global advertising agencies have been seeing modest top line growth, WPP has seen like-for-like revenue falls over the past couple of years and that is feeding through into declining EPS. TMPL’s managers see this as a sign that WPP’s problems are specific to it rather than a structural issue with the industry.
A new CEO – Cindy Rose, ex Microsoft – took on the job in September 2025. TMPL’s managers have met her and believe that she can turn WPP around. They think it may help that she has a background in technology. One obvious issue is that the individual businesses within WPP were not integrated and often ended up competing with each other for the same business. There is scope to take out complexity and cost from the business, which should help improve cost control.
It might be enough to simply stabilise the business. The managers say that the market is valuing WPP on about 5x earnings, whereas a rating of 10x might be ascribed to a stable business. If the new CEO can grow earnings on top of this – TMPL’s managers think organic revenue growth of 3% p.a. over the medium term, with an operating profit margin of 16~17% is achievable – then the potential for a rerating is considerable.
Redwheel is a significant shareholder in WPP, with about 10% of the company held across its range of funds and mandates, and is content to give the new CEO room to deliver on her planned transformation of the company.
Peer group
You can find up-to-date information on TMPL and its peers on our website
TMPL is one of the larger of the 16 funds in the AIC’s UK equity income sector, and its running costs are below the sector median. The shift to an enhanced dividend helped move TMPL’s yield closer to the sector median. TMPL’s strong long-term track record – which is evident in Figure 19 – is reflected in its rating and regular share issuance.
Figure 19: Snapshot of UK equity income sector as at 31 July 2026
| Premium/ (discount) (%) | Yield (%) | Ongoing charges (%) | Market cap (£m) | |
|---|---|---|---|---|
| Temple Bar Investment Trust | 1.3 | 3.7 | 0.59 | 1,283 |
| Aberdeen Equity Income Trust | 1.5 | 5.0 | 0.84 | 367 |
| BlackRock Income and Growth | (13.0) | 3.4 | 1.15 | 42 |
| Chelverton UK Dividend Trust | (6.6) | 7.0 | 2.25 | 32 |
| CT UK Capital and Income | (4.2) | 3.6 | 0.66 | 334 |
| CT UK High Income | (3.2) | 5.1 | 1.03 | 105 |
| Dunedin Income Growth | (7.8) | 6.1 | 0.57 | 368 |
| Edinburgh Investment Trust | (7.6) | 3.8 | 0.52 | 1,057 |
| Finsbury Growth & Income | (6.5) | 2.5 | 0.62 | 805 |
| JPMorgan Claverhouse | (1.4) | 3.7 | 0.62 | 530 |
| Law Debenture Corporation | 1.9 | 2.9 | 0.56 | 1,668 |
| Lowland Investment Company | (9.0) | 3.6 | 0.71 | 400 |
| Murray Income Trust | (6.2) | 4.0 | 0.48 | 952 |
| Schroder Income Growth Fund | (5.7) | 4.0 | 0.78 | 242 |
| The City of London Investment Trust | 2.0 | 3.7 | 0.36 | 3,057 |
| The Merchants Trust | (5.1) | 4.5 | 0.54 | 983 |
| Peer group median | (5.4) | 3.8 | 0.62 | 465 |
| TMPL rank | 4/16 | 10/16 | 7/16 | 3/16 |
Source: QuotedData website
TMPL’s long-term track record is good, ranking at the top end of the table over most time periods. That reflects the success of its value-driven approach. Many trusts drifted away from value investing over the period when the style was underperforming. Many of those that focused on “quality” instead were exposed to software stocks caught in the agentic AI sell off earlier this year (most notably Finsbury Growth & Income).
Those that have a bias to small-cap stocks have also been laggards in recent years.
Figure 20: Total return NAV performance over periods ending 31 July 2026
| 3 months (%) | 6 months (%) | 1 year (%) | 3 years (%) | 5 years (%) | |
|---|---|---|---|---|---|
| Temple Bar Investment Trust | 8.5 | 10.8 | 28.4 | 87.2 | 124.0 |
| Aberdeen Equity Income Trust | 8.9 | 12.4 | 32.9 | 74.2 | 63.9 |
| BlackRock Income and Growth | 5.6 | 4.0 | 15.3 | 38.6 | 55.0 |
| Chelverton UK Dividend Trust | 7.9 | 7.8 | 10.5 | 25.4 | (7.5) |
| CT UK Capital and Income | 6.2 | 4.9 | 10.2 | 39.1 | 36.8 |
| CT UK High Income | 7.1 | 7.2 | 20.6 | 61.1 | 54.5 |
| Dunedin Income Growth | 7.5 | 7.8 | 12.3 | 27.5 | 33.3 |
| Edinburgh Investment Trust | 7.6 | 7.8 | 10.4 | 41.6 | 68.1 |
| Finsbury Growth & Income | 6.2 | 7.1 | (9.9) | (1.0) | 2.4 |
| JPMorgan Claverhouse | 8.1 | 9.4 | 22.2 | 61.6 | 68.6 |
| Law Debenture Corporation | 6.5 | 10.2 | 24.6 | 70.9 | 93.6 |
| Lowland Investment Company | 9.4 | 10.7 | 29.4 | 73.7 | 77.5 |
| Murray Income Trust | 10.3 | 11.4 | 18.5 | 33.4 | 38.6 |
| Schroder Income Growth Fund | 6.8 | 7.0 | 18.7 | 50.3 | 58.9 |
| The City of London Investment Trust | 7.5 | 10.3 | 24.9 | 70.0 | 92.6 |
| The Merchants Trust | 11.6 | 10.2 | 24.9 | 49.0 | 79.3 |
| Peer group median | 7.5 | 8.6 | 19.6 | 49.7 | 61.4 |
| TMPL rank | 5/16 | 3/16 | 3/16 | 1/16 | 1/16 |
Source: Bloomberg, Marten & Co
Enhanced dividend
TMPL pays dividends quarterly. Since the AGM in 2025, it has used reserves to top up the dividend that it would have paid from net revenue earnings by an additional 3p per annum (0.75p per quarter). This represents a contribution to payouts in lieu of the money that companies have been spending on buying back shares rather than maximising their dividend payout ratio. In the last annual report, the chair observed that according to Computershare’s UK Dividend Monitor, share buybacks represented 42.1% of the total distributions by UK listed companies in 2025.
That change in policy is reflected in the step change in the dividend for 2025 over 2024. The chair has cautioned that the pace of TMPL’s dividend growth going forward is unlikely to match the significant increases seen in the past few years.
The dividend target for the current financial year is 15.6p, payable in four instalments of 3.9p. This represents a 4% increase on the dividend for 2025.
Figure 21: TMPL’s recent dividend record

Premium/(discount)
Figure 22: TMPL discount over five years ended 31 July 2026

As investors became more convinced of TMPL’s ability to outperform over the long term and memories of the extended period of underperformance from value strategies faded, the shares re-rated over the course of 2025. Over the 12-month period that ended on 31 July 2026, TMPL’s shares have traded between a discount of 10.7% and a premium of 1.8%, averaging a discount of 4.6%. As of publishing, the company was trading on a premium of 1.3%.
The board is committed to an active policy to manage TMPL’s share price relative to its NAV
The board is committed to an active policy to manage TMPL’s share price relative to its NAV. That includes both issuing shares at a premium as well as buying back shares at a discount. Both have the effect of enhancing the NAV for ongoing shareholders. At the AGM on 5 May 2026, shareholders authorised the directors to issue up to 20% and buy back up to 14.99% of the then shares in issue.
Over the past 12 months, thanks to strong demand, particularly from retail investors, no shares have been repurchased, and 21.13m shares have been reissued from treasury.
Figure 23: Shares issued and repurchased

Gearing and hedging
TMPL has a £50m 4.05% private placement loan which is repayable on 3 September 2028, and a £25m 2.99% private placement loan which is repayable on 24 October 2047. The two loans are secured by a floating charge over the assets of the company. TMPL’s net gearing was 3.7% as of 31 May 2026.
TMPL does not currently hedge its currency exposure.
Financial calendar
The trust’s year-end is 31 December. The annual results are usually released in March (interims in September), and its AGMs are usually held in May of each year. TMPL pays quarterly dividends in April, June, September, December each year.
SWOT and Bull versus bear analysis
Figure 25: SWOT analysis for TMPL
| Strengths | Weakness |
| Good performance track record in both NAV and share price terms, over the medium-to-long term. | As a fund with a clear focus on value investing in the UK market, TMPL is exposed to a shift in investor sentiment, which could depress returns even with good stock picking. |
| Rebuilding its track record of progressive dividend payments, helped by a change in policy of enhancing the payout through its distributable reserves, reflecting the importance of share buybacks by its portfolio companies. | |
| Opportunities | Threats |
| Despite a strong 2025, the UK market remains undervalued when compared to peers. TMPL’s stocks are even cheaper than the UK market average. | A more pronounced deterioration in the UK economy or renewed concerns about UK government finances could unnerve investors. |
| The current environment of higher for longer inflation and interest rates is better suited to value rather than growth stocks. | |
| The market is becoming less convinced of the AI capex trade. |
Source: Marten & Co
Figure 26: Bull versus bear analysis for TMPL
| Bull | Bear | |
| Performance | TMPL can boast strong performance – at or close to the top of peer group tables over one, three and five years. | The period since the outbreak of war in the Gulf has been less favourable to TMPL. |
| Dividends | Payouts to shareholders have risen every year for five years and we see no reason why this trend should not continue. This is supported by TMPL’s policy of enhancing these through distributable reserves. | There is no guarantee of these increases being maintained, if payouts and buybacks from the underlying companies come under pressure. |
| Outlook | UK stocks remain undervalued relative to peers and the economic environment ought to be favourable, provided that the new UK government does not jeopardise this. | Both value investing and the UK market could move out of favour with investors, potentially quickly. |
| Discount | TMPL moved to a premium during 2025 and has been reissuing stock at a small premium (which is beneficial for existing investors). | Sentiment might turn against value investing once again (although we see nothing on the horizon currently to trigger that). |
Source: Marten & Co