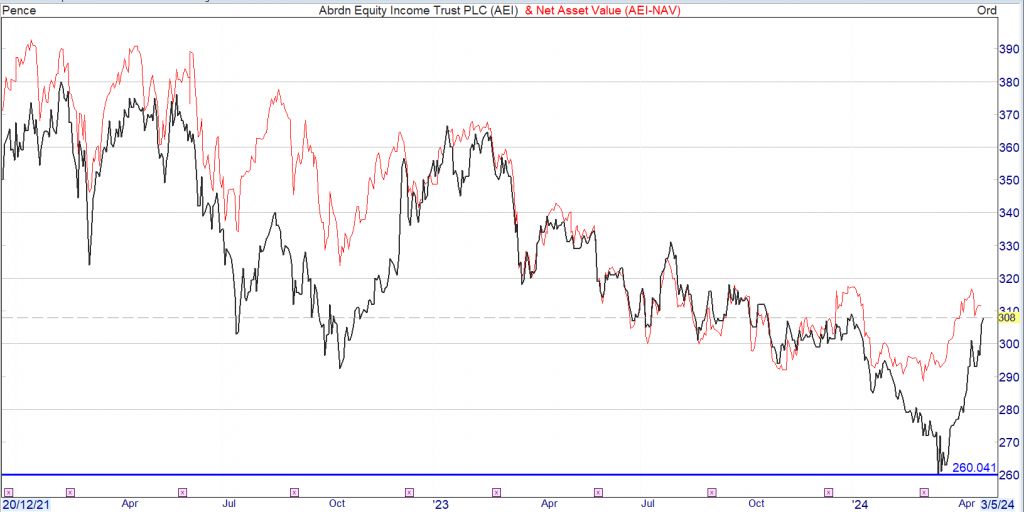
A share I allowed the market to chase me out because of FTSE weakness. As the discount to NAV has closed I would sell today, if I hadn’t but I can’t because I have already sold. Always easier in the rear wing mirror.
Investment Trust Dividends
A share I allowed the market to chase me out because of FTSE weakness. As the discount to NAV has closed I would sell today, if I hadn’t but I can’t because I have already sold. Always easier in the rear wing mirror.
Thursday 25 April
abrdn Asian Income Fund Ltd ex-dividend payment date
AVI Japan Opportunity Trust PLC ex-dividend payment date
Bankers Investment Trust PLC ex-dividend payment date
City of London Investment Trust PLC ex-dividend payment date
CQS Natural Resources Growth & Income PLC ex-dividend payment date
Foresight Solar Fund Ltd ex-dividend payment date
Henderson Far East Income Ltd ex-dividend payment date
Invesco Select Trust PLC Global Equity Income ex-dividend payment date
Invesco Select Trust PLC UK Equity ex-dividend payment date
JPMorgan Claverhouse IT PLC ex-dividend payment date
Murray International Trust PLC ex-dividend payment date
Schroder Oriental Income Fund Ltd ex-dividend payment date
Seed Innovations Ltd ex-dividend payment date
Shaftesbury Capital PLC ex-dividend payment date
Why buying dividend stocks could be a no-brainer for passive income
We all have our own ideas on how to invest to generate some long-term income. Here, I explain why I go for dividend stocks every time.
Alan Oscroft
Motley Fool
The content of this article was relevant at the time of publishing. Circumstances change continuously and caution should therefore be exercised when relying upon any content contained within this article.
When investing, your capital is at risk. The value of your investments can go down as well as up and you may get back less than you put in.
There are countless ways to try to earn some extra income. Everyone will have their own approach, but buying dividend stocks looks like the no-brainer way for me. Here’s why.
What do I look for when I want to top up my income? I want three key things.
What I want
I don’t want to have to do too much work. If I can put in an hour or so when I feel like it, and not leave the comfort of home, that would be great.
Then I need to be able to invest as much or as little as I like, when I like. I just don’t have big lump sums to plonk down. And I can’t commit to any fixed monthly outgoings.
And I want a method that has a long track record of success. I don’t need to take the income now. No, my aim is to build a good pot over the long term. And then I’ll start to draw down the cash when I retire.
Long-term success
Over the past 10 years, Stocks and Shares ISAs have earned an average of 9.6% a year. That even beats inflation right now, and not many savings schemes can do that.
But in the 2019-20 year, we would have lost 13.6% on average. So cash in shares for a year can mean pain. But for 10 years, it looks a lot better.
Years like 2020 do come along. But already, UK shares are back to where they were before the pandemic.
And research by Barclays has shown that the longer we leave our cash in the stock market, the more chance we have to beat other forms of investment.
Why dividend stocks?
For the long term, any stocks that generate good total returns can do just as well. But I prefer ones with good dividend yields.
When I see cash, I know it’s the real test of a company performance. That is, if it’s covered by earnings. Even if I buy more shares with the cash, I think I get more safety from mature dividend payers.
And if I should need a bit of cash one year, maybe for a bit of holiday spend, I can keep it back from my dividends.
Easy and cheap?
I do have to put in a bit of effort to work out my strategy. But since I’ve gone for top quality dividend stocks, I don’t have to do much work to make my choices. So it’s easy enough for me.
To make sense of trading costs, I buy with at least £500 a time, and £1,000 or more is better. But I can put small sums of cash into my Stocks and Shares ISA and save it there until I have enough to buy.
Do you like the idea of dividend income?
The prospect of investing in a company just once, then sitting back and watching as it potentially pays a dividend out over and over?
If you’re excited by the thought of regular passive income payments, as well as the potential for significant growth on your initial investment…
Individual choice
Stocks and shares won’t be for everyone, and each of us has to work out our own approach to risk. But for me, to build a long-term passive income pot, I don’t see anything better.

The Motley Fool
Christopher Ruane
A lot of people reach a point in life where their savings fall short of what they would like to have. However, even at 30, 40, or 50 it is still possible to start building wealth by getting into good investment habits.
I would draw inspiration from hugely successful investors like Warren Buffett in doing that.
Get rich slow
One key lesson from Buffett’s long career is that time can be the friend of the patient investor.
Some people think of the stock market as a get-rich-quick scheme. But long-term investment in high-quality companies is not a sudden fix for personal finances.
Buffett has bought shares in major businesses like American Express, then held onto them for decades hoping that over time their business quality will lead to share price growth.
Dividend income
Share price growth is not the only way an investor can make money from the stock market however. Dividends are also an important source of regular income for many investors.
Buffett receives billions of dollars a year in dividends. Rather than withdraw them from his business (for example by paying his own shareholders a dividend), he leaves them inside to fund more growth.
Compounding is reinvesting dividends, so that in turn they also start to earn dividends. Over time, compounding can be a significant source of income.
Focus on quality
Another hallmark of Buffett’s approach to investing is his relentless focus on quality. He sticks to proven companies with business models he understands. He also looks for some sort of competitive advantage that can help a company make profits.
Interestingly, many such shares are well-known and have been around for decades. The ‘Sage of Omaha’ is not trying to uncover a business few investors have yet discovered, hoping to beat them to it. Rather, he is happy to invest in large, well-known businesses hiding in plain sight.
But one thing he does focus on is cost. Even a great business can make a poor investment at the wrong price. So Buffett tries to buy great businesses – at a fair price.
Getting started
Having no savings and not knowing where to start, it can be a bit daunting knowing how to begin.
Buffett started his investment portfolio as a schoolboy, saving some money from a paper round and buying a few shares.
As an adult, I think a similar approach can work well. I would start small, while I learnt about the stock market and share valuation. I would also save money regularly that I could put into my investment portfolio to help me grow it over time.
£££££££££££££
I realised a long time ago I would never be the next Warren Buffett, that’s why I only invest in Investment Trusts and let someone more qualified invest my hard earned.

VPC Specialty Lending Investments PLC
(the “Company”)
MONTHLY NET ASSET VALUE PER SHARE
Net Asset Value
The Company is pleased to provide its monthly net asset value per share (“NAV”) update.
As at 29 February 2024, the unaudited estimated NAV (Cum Income) per Ordinary Share (ISIN GB00BVG6X439) was 78.09 pence.
This NAV has been calculated by CITCO Fund Administration (Cayman Islands) Limited.
With Q1 coming to a close we take a look at which Investment Trusts, stocks and sectors have caught the eye.
ByFrank Buhagiar•17 Apr, 2024

Phew, that was quick – anyone else think Q1 2024 flew by in the blink of an eye? With the first quarter of the year done and dusted, that can mean only one thing – it’s time for our Q1 round-up of the movers and shakers in London’s investment trust space. Which funds had a good quarter? And which trusts had one to forget?
JPMorgan provides an overview for the year thus far: “2Q24 was generally a good one for stock markets, with the US a key driver, with the S&P500 up 11.8% (all figures in £), also driving the MSCI World Index, which was up 10.2%. Growth outperformed value, with the MSCI World Growth up 11.5% and MSCI Value up 8.7%. Japan was also a notably strong performer, with TOPIX up 11.1%, and Europe outperformed EM and Asia ex Japan with a 6.8% return from the FTSE Europe ex UK. The UK, as measured by the FTSE All Share, was up 3.6%, with large caps outperforming mid and small (FTSE 100 +4.0% vs FTSE 250 +1.6% and Numis SC ex ICs +0.2%).”
A positive quarter for markets then, but was it a positive quarter for investment companies?
Back to JPMorgan: “The overall sector, as measured by the FTSE Closed End Investments sector (which does not include 3i), was up 2.3% over the quarter.” So, positive performance for the sector, although not enough to match the All Share, let alone the double-digit returns seen in the US or the MSCI World Index.
As for the discounts at which share prices traded at compared to underlying net assets, Numis reports a marginal widening of discounts during Q1: “Our figures, show that the average discount of the universe, excluding 3i Group, widened slightly in Q1 from 13.9% at December to 16.0% at 31 March. This included discounts on Equity ICs widening marginally from 10.1% at December 2023 to 11.5% at 31 March, whilst Alternative Asset ICs, excluding 3i, widened from 19.6% to 23.1%.”
Where does an average discount of 16% fit historically? Numis provides the graphic below:
Investment Companies Universe – Long-term discount history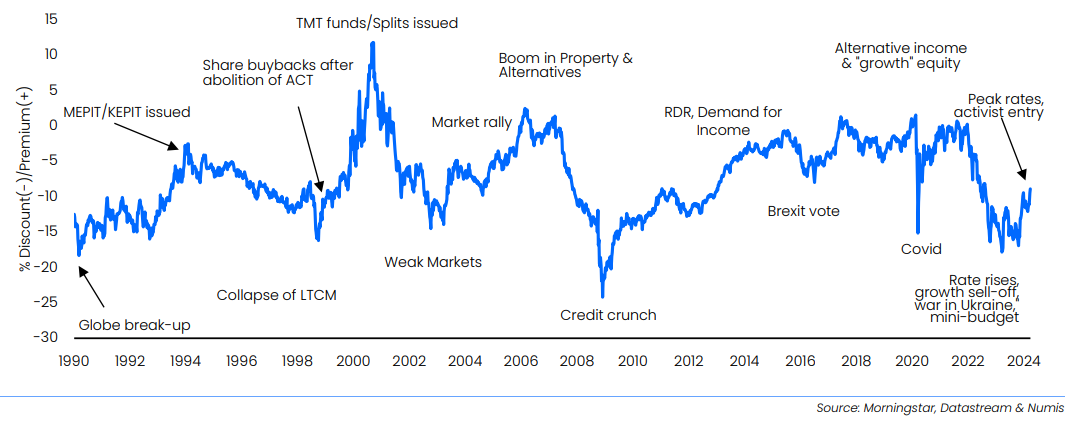
A 16% discount, nothing like the depths seen during the Credit Crunch, but equally some way off the premia that prevailed in the early 2000s.
The 2.3% generated by the closed-end index over the quarter is just a headline, one that masks a wide dispersion of returns at the sub-sector level – as Numis writes, “we caution that the universe is so diverse that aggregated figures are of limited use.” To see what the broker means, look no further than the winners and losers at the sector level.
Winners first, funds with tech exposure stand out – no surprise given the continued strong showing by the US tech mega caps. Numis notes: “Technology ICs continued to lead the pack, with the technology exposure also benefiting North American ICs and Global ICs in absolute terms, albeit most ICs lagged benchmarks, which remain concentrated on a few mega-cap stocks.”
At the other end of the scale, Numis writes: “The expectation of higher for longer rates impacted sentiment towards Infrastructure ICs, including Renewable Energy ICs, where investors were also wary of lower power prices. Battery Storage funds were notable laggards as the challenging revenue environment led to dividend suspensions.”
The graphic below from JPMorgan adds some colour in the form of the relevant numbers for all subsectors:
AIC Sector price TR (%) 1Q24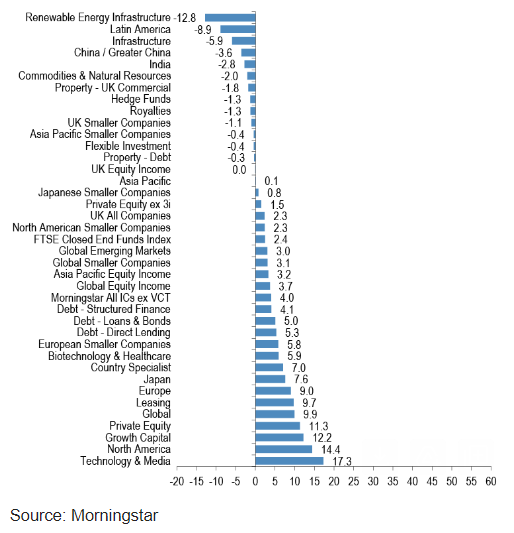 Renewable Energy Infrastructure off 12.8% during the quarter, Technology & Media up 17.3% – the two bookends. In between, a wide range of returns.
The same is true at the stock level. The worst performing fund in Q1 declined -62.4%, the best performer rose 43%. Among Q1’s worst performers, unsurprisingly, renewables, specifically battery storage investment companies, feature heavily in the below list from JPMorgan:
Q1 24 Worst performance (% price TR)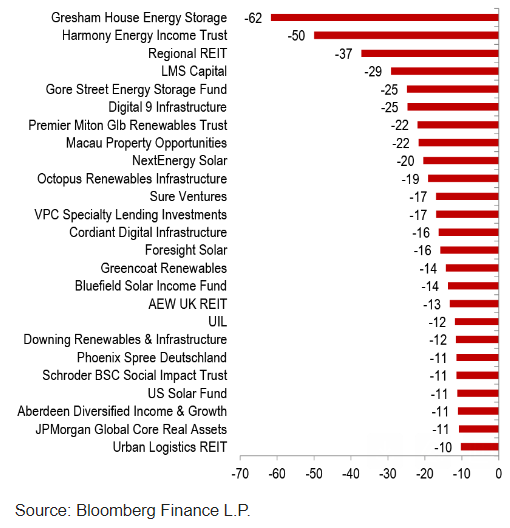
Similarly, tech-focused names such as Manchester & London, Polar Cap Technology and Allianz Technology feature in JPMorgan’s below graphic for Q1’s top-performing trusts:
Q1 24 Best performance (% price TR)
 Interestingly, last year’s top-performer 3i Group (III) follows up this year with a 16% Q1 gain, enough to place the private equity giant in joint ninth.
Eagle-eyed readers will have no doubt noticed the clumsy crossing out of the name of Q1’s top-performing investment company. No accidental spilling of ink here. Instead, a clumsy attempt to build up a little suspense. The big reveal though cannot be put off any longer. The top-performing investment company in Q1 2024 is none other than space investor, Seraphim Space (SSIT) courtesy of an eye-catching 43% gain.
Question is, after such a stellar opening three months of the year, can SSIT kick on
from here and consolidate top spot? It’s a question that’s been on broker Winterflood’s mind too if the title of their recent note is anything to go by.
Firstly, hats off to Winterflood for including SSIT in its 2024 Recommendations List. SSIT’s inclusion was “based on the structural tailwinds benefiting the SpaceTech sector, tangible progress at the portfolio company level and a share price which roughly implied that all but the fund’s top two holdings were worthless.” Following the strong share price performance, Winterflood used the release of SSIT’s interim results in March to ask, “is it time to take profit, or does substantial runway remain (either from a ratings or underlying performance perspective)?”
In terms of numbers, SSIT reported a 1.8% increase in NAV per share. In terms of words, Chair Will Whitehorn sounded cautiously optimistic in his statement, “Indications of inflation being tamed and interest rates having peaked has resulted in some evidence of improved sentiment in both the private and public markets. We continue to believe that SSIT’s current cash reserves are sufficient to meet the near-term capital needs of the portfolio”.
Winterflood found the results encouraging: “There are certainly encouraging signs in these results, with portfolio company fundraising clearly illustrating investor demand. Sector tailwinds remain intact, with satellite imagery in high demand across applications such as national defence and sanctions compliance. This is reflected in the market, with VC investment in SpaceTech flat YoY in 2023 vs -35% for VC investment overall. In particular, the guidance on c.40% of the portfolio (by value) showing positive EBITDA by year-end is constructive, and with 60% of the portfolio funded to profitability, concerns around cash constraints should be eased.”
So, even though Winterflood “can see how locking in profits on SSIT may be tempting at this stage, particularly if the position was initiated recently”, the brokers “point out that the SSIT discount remains relatively wide at 36%”. What’s more, “we see room for further tightening as the year progresses, alongside the potential for valuation uplifts as portfolio companies raise funds and execute on their targets and partnerships. We therefore reiterate the fund’s inclusion in our 2024 Recommendations.”
Winterflood thinks SSIT can kick on from here then. But will it be enough to hold onto top spot? Or will III manage to chip away at the lead? Perhaps another fund will come from nowhere to finish top of the tree? After all, the race to be the year’s best is only just beginning.
The Results Round-Up – the week’s Investment Trust results
By Frank Buhagiar
Schroder Japan Trust (SJG) partying like its 1989
SJG posted a +10.3% NAV total return for the six months to 31 January 2024. That’s comfortably above the benchmark’s +9.1% increase. Share price couldn’t quite match that though, returning +5.8% over the period. In his statement, Chairman Philip Kay puts the outperformance down to “strong stock selection across machinery, glass and ceramics, and information and communication. From a style perspective, holdings of value stocks outperformed the growth portion of the portfolio. The use of financial leverage was also helpful to performance over the period.”
Looking ahead, Kay notes: “The Japanese equity market has enjoyed a strong start to 2024 and, symbolically, the Nikkei 225 Index has recently exceeded its previous high achieved in 1989. The Board remains very positive on the long-term equity market outlook because corporate Japan is in the middle of a major transformation which is already resulting in improved shareholder returns.” Now it’s true “there have been many false dawns when the performance of the Japanese equity market has failed to live up to investor expectations. But your Board believes that, this time, there are real positive structural shifts in motion.” Because of these, “we remain very positive on the long-term outlook for the Japanese market and are firmly of the view that the Company is the best vehicle through which to capitalise on the opportunities presented by corporate change and an improving fundamental backdrop.”
Winterflood: “Board will propose 25% tender offer at prevailing NAV less costs if SJG’s NAV TR fails to exceed benchmark by 2% p.a. over 4 years to 31 July 2024. From 1 August 2020 to 31 January 2024, SJG has returned +4.4% above the benchmark on an annualised basis.” A handy buffer then with three or so months to go.
HydrogenOne Capital Growth (HGEN) focusing on what it can control
HGEN’s NAV and share price had very different years. According to the hydrogen investor’s Annual Report, NAV “increased by 5.8% from £125.4 million at 31 December 2022 to £132.7 million at 31 December 2023 due to valuation uplifts in multiple portfolio companies. NAV per share increased to 102.99p at 31 December 2023”. By contrast, “the share price fell from 79.30p to 49.65p and the discount to NAV increased from 18% to 52% as rising interest rates put pressure on investment trust discounts”. Chairman Simon Hogan “had hoped to report an improved share price this year. However, the share price remains at a steep discount, despite an increase in NAV in 2023, as is the case for many listed funds presently.”
Hogan however remains upbeat: “The outlook for the clean hydrogen sector remains positive and we believe that the portfolio can generate attractive returns over time. We fully support the Investment Advisor’s strategy of investing in a diversified portfolio of hydrogen assets, across the value chain.” In the meantime, the focus is on what can be controlled “Whilst macro-economic factors are outside of our control, we believe that selective investment, stewardship of the portfolio, and divestments can positively impact our NAV, and improve the share price over time.”
Winterflood: “NAV per share +5.8% to 102.99p driven primarily by valuation uplifts to private assets as a result of roll-forward of DCF valuations and improving financial performance. Seven of the portfolio’s ten private companies are revenue generating. HGEN had cash of £4.7m and £2.3m invested in listed hydrogen companies at the period-end.”
Fair Oaks Income 2021 (FAIR) looks set fair
FAIR reported a +12.98% NAV Total Return for the year ended 31 December 2023. The share price FAIRed even better, generating a total return (with dividends reinvested) of +30.94%. For comparison, the total return for the JP Morgan US leveraged loan index in 2023 was +13.17%, the JP Morgan US high yield returned +13.77% and the JP Morgan US CLO B rated index +26.77%. The Investment Adviser believes, “the focus on originating and controlling CLO (Collatorised Loan Obligations) subordinated note investments has resulted in superior fundamental performance.” Lower fees have also helped: “Lower fees in primary investments also allowed the construction of more conservative portfolios with no need to ‘stretch for yield’. As a result, the Master Funds have benefited from below-average exposure to sectors such as retail or energy.”
And the Investment Adviser thinks FAIR is “well positioned to generate attractive risk-adjusted returns in 2024” Reasons cited include: “Interest rate expectations: Fed and ECB rate cuts may support investor demand for risk assets, potentially supporting CLO liabilities. The potential for lower CLO financing rates will support new CLO equity investments and the optimisation of the capital structure of existing CLO equity investments”. And the “Existing, high-quality portfolio: all CLO equity and debt investments made their scheduled distributions in 2023.” Because of the above, the Adviser continues to “believe that the high-quality portfolio of primarily first-lien, senior secured loans with attractive term, non-mark-to market financing represents one of the most attractive risk-adjusted opportunities available to investors in the current market environment.”
Liberum: “The shares trade close to par now and we believe the return outlook remains attractive. The underlying loans that fund the CLO equity and CLO liabilities are senior secured bank loans that sit above high yield debt and preferred stock. We are BUYers with a target price of $0.66.”
Numis: “Fair Oaks Income is an attractive investment for investors that are seeking to generate a high yield and have a relatively high-risk tolerance. We believe that the future looks positive for Fair Oaks Income, owing to its conservative, high quality portfolio with strong fundamentals, which results in a lower default rate relative to the market.”
Middlefield Canadian Income’s (MCT) doubling discount
MCT’s NAV Total Return for the year ended 31 December 2023 came in at -1.4%, a little way off the benchmark’s +3.9%. The North American equity income investor’s share price fared worse – total return of -10.7% as the discount more than doubled to 16.8% from 7.5%. Better news on the dividend front – the full-year payout came in at 5.2p, a 0.1p increase on 2022’s 5.1p. Okay, the smallest of rises but a rise is a rise. And MCT plans another for 2024, dividend per share for the year is expected to be 5.3p.
Winterflood: “Stock selection within Energy sector was biggest detractor. Utilities also detracted. Positive contribution from underweight exposure to Communications Services and stock selection in Real Estate”.
This week’s Discount Watch sees another big drop in the number of investment companies trading at 52-week high discounts – down nine to 18 from 27.

ByFrank Buhagiar•15 Apr, 2024

We estimate there to be 18 investment companies whose discounts hit 12-month highs over the course of the week ended Friday 12 April 2024 – nine less than the previous week’s 27.
True, big drop at the headline level from 27 to 18, but no change in terms of which sector accounts for the lion’s share of funds trading at year-high discounts – renewable energy infrastructure. Once again, seven renewables-focused Trusts make it onto the list. On the positive front, UK Equity Income funds appear to be over their bad case of discountitis. It was only Week 12 when the sector contributed seven names to the list. Week 15 and the tally is down to just one fund.
The top-five discounters
| Fund | Discount | Sector |
|---|---|---|
| Gresham House Energy Storage GRID | -72.42% | Renewables |
| LMS Capital LMS | -68.93% | Private Equity |
| Downing Strategic Micro-cap DSM | -53.70% | UK Micro-cap |
| EJF Investments EJFI | -43.91% | Debt |
| Downing Renewables & Infrastructure DORE | -37.28% | Renewables |
The full list
| Fund | Discount | Sector |
|---|---|---|
| Scottish Oriental Smaller Cos SST | -18.48% | Asia Pacific Smaller Cos. |
| NB Global Monthly Inc NBMI | -31.55% | Debt |
| EJF Investments EJFI | -43.91% | Debt |
| Develop North DVNO | -1.36% | Debt |
| Templeton Emerging Mkts TEM | -16.45% | Emerging Markets |
| Apax Global Alpha APAX | -35.88% | Private Equity |
| LMS Capital LMS | -68.93% | Private Equity |
| Greencoat Renewables GRP | -25.40% | Renewables |
| Octopus Renewables Infrastructure ORIT | -35.06% | Renewables |
| Gresham House Energy Storage GRID | -72.42% | Renewables |
| Bluefield Solar Inc BSIF | -28.39% | Renewables |
| Downing Renewables & Infrastructure DORE | -37.28% | Renewables |
| Foresight Solar FSFL | -31.23% | Renewables |
| NextEnergy Solar NSFL | -34.90% | Renewables |
| Shires Income SHRS | -15.70% | UK Equity Income |
| Downing Strategic Micro-cap DSM | -53.70% | UK Micro-cap |
| BlackRock Throgmorton THRG | -10.94% | UK Smallers |
| Henderson Smallers HSL | -15.36% | UK Smallers |
© 2026 Passive Income Live
Theme by Anders Noren — Up ↑