Alliance Trust PLC ex-dividend payment date BlackRock World Mining Trust PLC ex-dividend payment date Canadian General Investments Ltd ex-dividend payment date Downing Renewables & Infrastructure Trust PLC ex-dividend payment date Fair Oaks Income Ltd ex-dividend payment date Great Portland Estates PLC ex-dividend payment date Henderson EuroTrust PLC ex-dividend payment date JPMorgan European Growth & Income PLC ex-dividend payment date JPMorgan Global Growth & Income PLC ex-dividend payment date Law Debenture Corp PLC ex-dividend payment date Premier Miton Global Renewables Trust PLC ex-dividend payment date Regional REIT Ltd ex-dividend payment date Temple Bar Investment Trust PLC ex-dividend payment date Triple Point Social Housing REIT PLC ex-dividend payment date
We argue a position in bonds should be diversified with alternatives…
Thomas McMahon
Disclaimer
KEPLER
This is not substantive investment research or a research recommendation, as it does not constitute substantive research or analysis. This material should be considered as general market commentary.
Let’s get one thing clear: in bond land, ten bps is a lot. That is one-tenth of a percent to you. A bond fund manager who can outperform his peers by ten bps is a king. In this world, the 19,000 extra bps (190% to me and you) that have been earned by being in high yield bonds rather than equities since the great financial crisis (GFC) are the riches of Croesus. Following three successive months in which IA funds saw net outflows across equity, fixed income and mixed asset, March 2024 saw a huge surge of cash jump back into bonds. Net retail sales of fixed income funds hit £809m in the month, while equity funds saw just £149m flow in and mixed asset funds saw outflows. Given how strongly fixed income performed after the last crisis, are investors right to be buying back into bonds, and could they repeat their stunning performance?
Do bonds offer attractive returns ?
They say a picture paints a thousand words, so let’s start with a chart. The graph below shows returns to UK high yield bonds and UK equities from the bottom of the 2007/2008 great financial crisis. If you had gone 100% into UK high yield bonds in March 2009, you would be up 500% since then, and have about 60% more money than if you had invested 100% in UK equities. You would have actually outperformed the S&P 500 Index until August 2017 too.
UK EQUITIES VS UK HY BONDS
Source: Morningstar Past performance is not a reliable indicator of future results
The cumulative relative return chart shows that much of this outperformance was earned at the start of the period. After a brief retrenchment, high yield outperformed equities by around another 20 percentage points up to mid-2020, before adding even more to relative returns by the start of 2021. Some of these gains have been given back since.
RELATIVE RETURNS OF UK EQUITIES VS HY
Source: Morningstar Past performance is not a reliable indicator of future results
So, is this an investment strategy? Equity markets are now off their post pandemic lows, but bonds have double dipped. Investors have been increasingly positive on fixed income, with the IA recording massive inflows in March from both retail and professional investors. Anecdotally, we hear that wealth managers have also been adding to fixed income in recent months.
We think there are three reasons that this time is likely to be different, investors should be wary of chasing yield in bonds, and a fixed income bucket should probably remain diversified.
1) The first point is that credit spreads were the source of a greater proportion of the return on offer from bonds in 2009 than they are today. UK rates had been cut from 5.75% at the end of 2007 to 2% at the end of 2008, and were at just 1% when our period starts, so almost all the yield on offer in sterling bonds was from credit spreads. Today, UK rates sit at 5.25% and high yield bonds yield around 7% at the index level, so are only offering an additional 175bps return a year for credit risk. In the US market, the picture is even worse, with the USD market offering less than 100 bps of additional spread over short-term rates. In other words, there isn’t a lot of scope for an improving picture for the economy or for corporate earnings to be reflected in bond fund returns. This time round, a vastly greater proportion of returns are likely to be due to duration – i.e. movements in interest rates. The picture is even worse in the sterling investment grade sector which retail investors are currently favouring (going by IA data). Here yields are only around 5.4%, meaning only a few bps are on offer for taking the credit risk of lending to a company rather than HMG. Even a bond fund manager would struggle to get excited about that. Our first point is that bonds don’t offer much extra return over short-term money market funds, i.e. cash.
2) The second point is that the rate outlook looks bumpy. A cut seems more likely than a raise at the next BoE meeting, but even that is now less certain in the US, after some strong data. Better economic data would be good for credit spreads, but as discussed above, there is more limited scope for these to tighten and deliver returns. Better economic data would suggest higher inflation, which would see rates stay high or be hiked, which would see a greater, negative impact on bonds through duration. Your author suggested that central banks were underestimating the persistence of inflation in early 2022 by anchoring on the past cycle. Now there is a danger that investors are anchoring on the secure glide path down in rates developed market rates saw after the debt binge of the 2000s. Keeping monetary policy as loose as possible worked well in the deflationary world in the 2010s, but inflation is proving more persistent in this cycle. Rearmament, massive spending on net zero initiatives, those initiatives’ vast demand for metals and minerals and the huge costs of reorganizing supply chains in the light of geopolitical tensions are all inflationary. The political climate is also different. In the 2010s, austerity was a message that plenty of people were listening to, but these days it is about as popular as a country that has apparently won two world wars and one world cup at a camp song contest.
3) There is another reason why returns are likely to be lower in this cycle, for high yield in particular. At the height of the GFC, many banks were forced to issue debt at eye wateringly high yields. This subordinated debt was essentially emergency funding, with lenders taking a massive mark-up for taking the risk of being last in the queue to get paid back, while the solvency of developed world banks was in doubt. To take an extreme example, Barclays Bank issued £3bn in debt which paid a 14% coupon, in perpetuity. As the banking system settled down and these bonds de-risked, they helped deliver outstanding returns to those managers who were brave enough to buy in (and enough bps of alpha to buy a lambo in some cases). This dynamic is absent from the current market, as our recent crisis was caused by the impact of the pandemic and the subsequent inflation rather than any issues in credit markets. In fact, the banking industry looks pretty healthy, and is benefitting from a higher net interest margin thanks to high short-term rates.
How can we protect ourselves against the risks in the bond market?
For these reasons, we would be wary of committing exclusively to the conventional bond market, and would want to diversify this exposure with shorter-duration assets or those with less credit risk. In our view, the current rate outlook makes taking a punchy position in duration questionable. The UK corporate bond market has a duration of c. 6 at the time of writing, meaning that a loss of 6% would be expected for a 100 bps parallel shift in the yield curve. This is down from pre-crisis, thanks to the effect of the sell-off in prices, but means there are significant downside risks in the event of a resurgence in inflation. If inflation is accompanied by high nominal GDP growth, then this could be good for credit spreads, but they are already extremely narrow, so there is little to be gained there, and any rate hike effect should be far greater. On the other hand, if we end up with runaway inflation and a recessionary environment, there is the potential for bonds and equities to sell off together as they did in 2022. While this danger seems to have receded, it has not gone away entirely, and in particular the ever-worsening geopolitical situation, and the current conflicts in Ukraine and Israel, offer one route to this outcome.
We think that investors could profit by being diversified in the bond sleeve of their portfolio. This can be done through more unconventional fixed income products. For example, M&G Credit Income (MGCI) invests in private as well as public debt markets, generating a very high yield without taking on the credit risk of a high yield fund. The portfolio is majority floating rate, meaning that investors effectively earn the UK short-term interest rate plus a spread. This spread is wider than it would be for a portfolio of public investments of similar credit risk, typically due to the extra yield that can be earned for the illiquidity and complexity of the private deals. We explain the model in full in our recent note. Key points to note are that any rate hikes would actually boost the yield on offer from the fund without seeing much impact at all on the price. We think the trust offers an attractive way to hedge the risks to the current recovery narrative. Annualising the last quarterly dividend, the historical yield is c. 9.3%, achieved without the use of any gearing, while trading on a discount of 1.4%.
Sequoia Economic Infrastructure Income (SEQI) also operates in the private debt space. SEQI owns a highly diversified portfolio of loans made to infrastructure projects. These are spread across digital infrastructure, power and renewables projects, transport and other sectors. These loans are mostly bilateral or made with a small group of lenders, allowing the management team to negotiate attractive terms to both parties. It has c. 40% in floating rate loans which helps reduce the duration, although the managers have been increasing fixed rate debt at the margin as they can lock in higher rates than in the past. Duration is nonetheless very low, at 2.2 years versus 1.2 years for MGCI. The high yield is one factor that reduces the duration: the current ‘yield to worst’ on the portfolio (which includes an early capital return baked in, assuming borrowers take advantage of any early repayment options) is 10%, and this is without the use of gearing. SEQI’s shares currently yield 8.6% on a historical basis and trade on a 14% discount. We will be publishing a full note on the trust in the coming weeks; click here to be notified.
Another way to diversify the bond sleeve of a portfolio is via alternatives. Greencoat UK Wind (UKW) is the largest trust in the AIC Renewable Energy Infrastructure sector, and is large enough to have generated 1.5% of UK electricity demand in 2023. UKW owns wind farms, and takes on debt at the fund level to help generate an attractive yield, which is currently c. 7%. The board seeks to raise its dividend by at least the growth in RPI over any year, and has achieved this even through the recent inflationary surge. We think this could be an attractive feature if inflation proves more persistent. The managers model a 10% levered portfolio IRR, made up of a c. 6% dividend yield on NAV and real NAV preservation by reinvesting excess cash flows. This offers a considerably higher spread over the base rate than bonds, albeit for taking more specific industry risk. UKW’s shares trade on a 10.6% discount to NAV at the time of writing, which also adds to the total return potential. There is effective duration to consider, as rising rates would reduce the discount rate used to value the assets. But in our view the positive sensitivity of the NAV to inflation and rising power prices offsets this and means the trust offers an interesting diversification element to a bond or bond-plus sleeve. Key risks to consider in the coming years are the need to re-gear, and with rates higher this will likely be a slight headwind to the economics of the fund.
A more diversified option, albeit with a slightly lower expected returns, is The Renewables Infrastructure Group (TRIG). In our latest note we explain how TRIG has an expected NAV return of c. 8%. This is with some significant inflation-linkage however, meaning that a good proportion of returns should be considered real, unlike conventional bonds. The portfolio is highly diversified and getting more so. It is spread across six European countries (including the UK), bringing exposure to different subsidy regimes, with assets across offshore wind, onshore wind and solar. Rising interest rates have hit the NAV over the past two years, but this has been offset to some extent by the impact of high inflation on asset values – over the next ten years, 51% of expected portfolio returns have an inflation link. It is worth noting that the inflation expectations TIG is using are currently lower than those of in the market, so this suggests prudence and the potential for write-ups should the market be right. Like UKW there are risks to the NAV should we see further rate hikes, but like UKW we think the offsetting features to bonds (which have this risk in spades) are highly attractive.
Conclusion
Bonds add a lot of value to a portfolio, and if they are bought when the conditions are right, can deliver exceptional returns. Their generally lower volatility than equities means that improvements to a portfolio’s risk-adjusted returns can be particularly striking. However, we think investors would be mistaken to commit entirely to conventional fixed income at this juncture – especially high yield, or long duration bond portfolios. The outlook for rates and the pricing in the market means that significant risks abound and we think bonds are unlikely to perform as well as they did post GFC. On an income basis, we think there is a strong case to be made for diversification to avoid the heavy duration risk in conventional bond markets, while credit markets seem to have already baked in an economic recovery. Bond-like alternatives look like attractive components of a diversified bond-like sleeve in a portfolio. In particular, the discounts they are currently trading on make them look cheap in our view, and add to the long-term return potential.
The de-accumulation chart shows the dividends earned but not re-invested.
The accumulation chart shows the dividends earned and re-invested.
You have stuck to your plan and re-invested your dividends in MRCH, thru thick and thin and there has been plenty of thin. But u know that in a falling market u get more shares for your money.
If u had invested 25k u would be near to having shares worth 100k, by sitting, you would need to have been comfortable that the dividends were repeatable.
If u now want to start spending some of your profits, (de-accumulation), u could sell some of your shares as the current yield is 4.91% and re-invest in a higher yielder and then hope to do it all again with the remaining shares.
Or simply sell part of your holding and spend some of your profits. GL
The Richest Man in History Reveals His Simple Wealth Generating Secret
Introducing the Man Who Knew The Secret of Making Big Money Don’t take my word for it. The guy who claimed “I have ways of making money that you know nothing of” is the richest man in human history.
Who better to have said this than American business tycoon John D. Rockefeller, founder of American Oil Behemoth: Standard Oil.
He once remarked:
Do you know the only thing that gives me pleasure? It’s to see my dividends coming in.
That’s right. Rockefeller was a dividend investor.
How Can You Use This Secret? So how can you use Mr Rockefeller’s secret to become extremely rich?
Tip #1: Guard yourself against people’s opinion about dividend investing.
Almost everyone in the stock market is programmed to make quick money. Very few have the patience to follow the correct process that ensures riches in the stock market.
Believe me, even though waiting around and collecting dividends sounds simple, I bet you it isn’t easy to follow.
Tip #2: Reliable dividends come from companies with predictable revenue streams.
Henderson European Focus and Henderson EuroTrust dish out a handful of merger sweeteners. Pantheon International moves to Step 2 of its Capital Allocation Policy and abrdn Equity Income offers one of the highest yields of any equity-orientated investment trust.
By Frank Buhagiar
Henderson European Focus and Henderson EuroTrust merger sweeteners
Henderson European Focus and Henderson EuroTrust merger sweeteners Henderson European Focus (HEFT) and Henderson EuroTrust (HNE) have added a few sweeteners to their merger proposals. According to HEFT’s press release, the two companies have agreed the following revised merger terms:
Cash exit option limit upped to 15% of each company’s issued share capital (5% previously)
Manager Janus Henderson contributing £1.55m to the deal’s costs to ensure the merger is cost-neutral for remaining shareholders
A further reduction in the second management fee tier from 50 bps p.a. to 47.5 bps p.a. – fees will now be charged at 60 bps p.a. on net assets up to £500 million; 47.5 bps p.a. on net assets equal to and in excess of £500 million; and up to 45 bps p.a. on net assets equal to and in excess of £1 billion
As well as the previous commitment of a 5-yearly performance-related tender, the combined trust will consider additional opportunities to realise some of its investment.
Winterflood: ‘We noted at the time of the initial announcement that the proposed merger between HEFT and HNE made a lot of sense and offered a number of benefits to remaining shareholders. As such, any further improvements in terms are naturally welcome.’
Pantheon International moves to Step 2 of Capital Allocation Policy Pantheon International (PIN) provided an update on its three-step Capital Allocation Policy (CAP). Step 1: Repurchasing up to £200m of its own shares, is nearing completion with £189.6m shares bought back at the last count. Step 2: PIN investing a portion of future cash-flows (after capital calls, ongoing charges and expected near-term cash outflows such as debt repayments) in its own shares as well as new investment opportunities. The amount set aside for repurchases under Step 2 will depend on the discount the shares are trading at – for 50%+ discounts, 51%-75% of cashflows will go towards buybacks; for 30%-49% discounts, 26%-50%; and for 20%-29% discounts, up to 25% will be used. Step 3: Upping marketing efforts.
Numis: ‘We believe Pantheon International’s approach to buybacks and capital allocation has been a positive development to shareholders. Pantheon International has returned c.£40m through buybacks and £150m via a tender since August 2023. This is reflected in a consistently narrower discount than HVPE, its closest and largest peer, since the adoption of the capital allocation policy.’
Dividend Watch
BlackRock Smaller Companies (BRSC) maintains Dividend Hero status. As per the recent finals, BRSC announced a final dividend of 27p per share which, when combined with the 15p interim payout, represents total dividends of 42p per share for the year. That’s a 5% increase compared to the previous year and maintains the run of increasing the annual dividend every year since 2003 as well as BRSC’s status as one of the AIC’s Dividend Heroes – investment companies that have increased their dividends for 20+ consecutive years. For the record, the annualised increase in dividends paid since 2003 stands at 10.9%.
abrdn Equity Income (AEI) sees dividend yield hit 8.3%. According to Chair, Sarika Patel’s, Half-year statement, AEI remains on track to pay out minimum total dividends for the year of 22.9p per share. Based on the 31 March 2024 share price of 277.0p, this equates to a dividend yield of 8.3%, ‘amongst the highest of any investment trust invested in equities.’
NextEnergy Solar (NESF) ups dividend target. The title of the company’s 15 May 2024 press release pretty much covers it – 11th Dividend Target Increase – but a couple of fillers: 8.43p per share dividend target for the year ending 31 March 2025; a 1% increase on the year; dividend cover forecast to be between 1.1x-1.3x; and NESF has now declared £345m dividends or 67.8p per share since inception.
Week 20 and the number of investment companies trading at a 52-week high discounts continues to follow a similar pattern to 2023. The latest Discount Watch reveals all.
ByFrank Buhagiar
It is our estimation that seven investment companies saw their discounts hit 12-month highs over the course of the week ended Friday 17 May 2024 – five less than the previous week’s 12.
Week 20 and the number of investment companies trading at 12-month high discounts is close to year lows. Of the seven 52-week high discounters, six come from alternative sectors – two funds each from debt, property and private equity. The only equity-focused investment company – Invesco Perpetual UK Smallers (IPU).
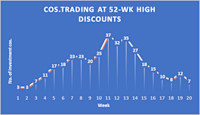
We’ve previously highlighted how 2024’s weekly discount tracker appears (so far at least) to be following a similar path to the one observed in 2023 – see below 2023’s discount tracker covering the first 20 weeks of the year.
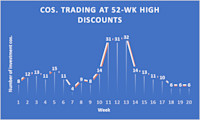
Let’s hope the similarities end at Week 20 because from Week 21 2023 onward, the number of year-high discounters steadily increased – by Week 44 2023 there were 56 funds trading at record discounts for the year.
The top-five discounters
FundDiscountSectorGround Rents Income GRIO-70.10%PropertyCeiba Investment CBA-68.99%PropertyVPC Specialty Lending Investments VSL-43.10%DebtJPEL Private Equity JPEL-40.67%Private EquitySchroder British Opportunities SBO-36.17%Growth Capital
Schroder British Opportunities SBO-36.17%Growth Capital
JPEL Private Equity
JPEL-40.67%Private EquityGround Rents Income GRIO-70.10%Property
Ceiba Investment CBA-68.99%
PropertyInvesco Perpetual UK Smallers IPU-16.25%
Funds mentioned in this article:
Ground Rents Income Fund OrdVPC Specialty Lending Investments OrdSchroder British Opportunities OrdJPEL Private Equity OrdInvesco Perpetual UK Smaller Ord
The Results Round-Up – The Week’s Investment Trust Results Which fund’s investment managers are sticking with their conservative approach as they think markets may take a hit? And which fund has generated a NAV per share total return of +381.9% over the last 10 years?
By Frank Buhagiar
Schroder Asia Pacific (SDP) goes bargain hunting SDP beat the benchmark over the half year – with a +5.7% NAV per share total return compared to the benchmark’s +5.3%. Chairman, James Williams, puts the outperformance down to stock selection and a significant underweighting to China. According to the investment managers, Chinese stocks had a miserable year – avoiding the laggards just as important as picking the winners.
SPD see reasons for thinking China can have a better year. Chief among these, ‘consensus expectations are now very low and this is reflected in lower valuations than a year ago.’ The managers are on the lookout for high-quality names they can pick up the cheap.
Numis: ‘The fund has an impressive long-term track record, with NAV returns of 9.8% pa over the past decade compared with 7.8% pa for the MSCI AC Asia ex Japan.’
Caledonia’s (CLDN) in control CLDN’s three investment pools all contributed to the fund’s +7.4% full-year NAV total return: Public Companies (+12%); Private Capital (+12.3%); Funds (+2.2%). The fund has a long-term approach and CEO, Mat Masters, believes the global investor’s diversified portfolio and strong balance sheet can keep on delivering despite the uncertain external environment. Masters has got the team ‘focused on what we can control.’
Winterflood: ‘NAV TR +7.4% vs CPIH +3.8% and FTSE All Share TR +8.4%. Return was therefore within long-term target of inflation +3%-6%.’
Numis: ‘Caledonia has a strong long-term track record, delivering NAV total returns of 164% (10.1% pa) over the last ten years compared with 83% (6.2% pa) for the FTSE All Share Index and 228% (12.6% pa) for the MSCI World Index.’
JPMorgan “We think Caledonia remains an attractive proposition for investors seeking long-term real investment returns and a diversified portfolio.”
Investec: ‘The onset of the pandemic ignited a sharp de-rating. We would regard a fair value discount level, in normal market conditions, to be around the 20% level. We initiate with a Buy recommendation.’
HICL Infrastructure (HICL) sends a message HICL’s full-year results included, as you’d expect, a flurry of numbers but perhaps ‘New dividend guidance of 8.35pps for FY 2026 and reaffirmed guidance of 8.25pps for the year to 31 March 20251’ best sums up the message. The £509m raised during the year via asset divestments at a weighted average 11% premium to carrying value also sends a message: the sale proceeds paid off the Revolving Credit Facility and funded a £50m share buyback programme. The sales added c. 2.5p to NAV per share although overall this came in 6.7p lower at 158.2p due to an increase in the weighted average discount rate to 8.0%.
Chairman, Mike Bane, believes HICL’s diversified portfolio, which includes over 100 high-quality, inflation-linked assets, offers shareholders attractive risk-adjusted value today and exposure to powerful infrastructure megatrends for tomorrow. A case of jam today and tomorrow.
Investec: ‘The portfolio continues to perform well operationally, and we reiterate our Buy recommendation.’
Numis: ‘We continue to view the rating as undemanding.’
Liberum: ‘Overall, we remain BUYers of the fund with a target price of 160p.’
JPMorgan: ‘We are Overweight HICL which is a constituent of our model portfolio.’
STS Global Income & Growth (STS) sticking to its guns STS’ total assets increased c. 50% during the full year – the acquisition of former stablemate Troy Income & Growth Trust added £118 million so that by year end, total net assets stood at £314.4 million. Full-year share price/NAV total return came in at +6.1%/+4.8% respectively compared to the benchmark’s +11.5%. The Managers did not buy into the economic recovery narrative that buoyed global markets. ‘Investors anticipated an economic recovery – about which we are sceptical – leading the best performing sectors to be more cyclical areas such as extractive industries, banks and industrial companies.’ The managers’ quality focussed, conservative approach may have lagged the market but they continue to believe market exuberance may take a hit if the economy slows.
Numis: ‘The portfolio is managed using Troy’s distinctive style, with a focus on quality companies that generate high returns on capital through sustainable competitive advantages. As a result, it is heavily focused on defensive sectors, including Consumer Staples which have trailed behind other areas of the market in recent years.’
Scottish Mortgage’s (SMT) managers are excited SMT Chair, Justin Dowley, described the fund’s latest full year as challenging yet rewarding. Dowley said, ‘the macroeconomic and geopolitical factors driving market anxiety are too numerous to mention’. The portfolio’s holdings of ‘resilient companies that possess the potential to shape the future of the modern economy’ have continued to ‘deliver strong operational performance and remain in robust financial health.’ After a two-year hiatus, share price and NAV returns were positive –share price up +32.5% (discount narrowed from -19.6% to -4.5% courtesy of that £1bn buyback programme); NAV up +11.5%. The FTSE All-World Index fell between the two – up +21%.
10-year track record still stacks up. NAV per share up +381.9% compared to +218.2% for the FTSE All-World index (total return). Portfolio Manager, Tom Slater, is ‘confident there’s more to come’ thanks to long-running themes such as artificial intelligence, digitalisation, scientific and engineering progress and the energy transition.
Jefferies: ‘The results provide the financial backdrop for the recent share buyback programme, highlighting both lower gearing and lower private asset exposure that offer the headroom to make very extensive use of buybacks in support of once again trading close to NAV.’
Numis: ‘The shares closed last night on a c.10% discount and we believe this offers significant value.’
Schroder Oriental Income’s (SOI) stock pickers get it right again SOI outperformed over the half-year period – NAV per share up +7.5, while the MSCI AC Pacific ex Japan Index was up +1.9%. Over three years, NAV total return has now outperformed the index by +23.6% and since inception in 2005 the fund has generated total returns of +489.0% compared to the index’s +288.5%. The secret of SOI’s success? The Investment Manager’s focus on identifying quality companies. As Chairman, Paul Meader, explains, ‘Fundamentally, we are stock pickers and do not seek to predict macro-economic trends or geopolitics.’
Numis: ‘The fund benefits from an experienced fund manager, Richard Sennitt, who has run open-ended Asian Income mandates at Schroders for over 20 years, having joined in 1993. Schroder Oriental Income pays a dividend yield of c.4.5% and dividend growth has been strong since inception.’
Shires Income (SHRS) waiting for interest rates to fall SHRS’ full-year NAV and share price total returns moved in opposite directions – NAV per share up +5.1, share price down -5.7%. The benchmark beat them both, returning +8.4%. Chairman, Robert Talbut, is not surprised, ‘the performance for the year is in line with what we would expect, given the defensive and income focused nature of the portfolio’. On the corporate front, it was a busy year. Combining with abrdn Smaller Companies Income increased SHRS’ size by more than a third. That’s one way to grow.
Looking ahead, the investment managers believe as interest rates fall this will increase the relative appeal of the proposition. The managers explain that investors can currently earn a decent risk-free return from cash but, as rates come down, they believe SHRS’ 6.5% dividend yield will become more appealing again.
Winterflood: ‘At 31 March, 80% of portfolio was invested in equities and 20% in preference shares.’
Capital Gearing Trust (CGT) goes seismic CGT’s +1.8% full-year NAV total return was described by Chair, Jean Matterson, as far from satisfactory – the flexible investor failed to match the Consumer Price Index’s +3.2% rise. Rising interest rates, widening investment trust discounts and a strong sterling all held back performance. However, all is not lost. With nearly 70% of the portfolio invested in high-quality bonds, the major reset seen in fixed income markets has been a headwind these past two years. But with the fund’s bonds now ‘yielding well in excess of inflation’, future returns should be well underpinned from here on.
Matterson ends her statement with a little seismology, ‘As the tectonic plates of macro-economic fragility and technological change grind against one another, no one can tell when or where the next earthquake will occur. This Company exists to protect its shareholders from just these sort of disruptions.’
Numis: ‘Capital Gearing’s results show a period of muted returns, which is largely unsurprising given the fund’s defensive positioning. The managers point to the exceptional value in investment trusts where exposure has been increased. We agree. The average sector discount remains close to post GFC lows, with many alternative asset ICs in particular offering exceptional value.’ Well said.