Foresight Solar, the fund investing in solar and battery storage assets to build income and growth, announces its unaudited net asset value (NAV) was £543.0 million at 31 March 2026 (31 December 2025: £545.9 million). This results in a NAV per Ordinary Share of 99.2 pence (31 December 2025: 99.2 pence).
Summary of key changes to NAV
Item
p/share movement
NAV on 31 December 2025
99.2
Interim dividends paid
-2.0p
Time value
+1.9p
Project actuals
-0.3p
Power price forecasts
+0.1p
Inflation assumptions
+0.4p
Share buyback programme
+0.2p
Other movements
-0.3p
NAV on 31 March 2026
99.2p
Lower-than-expected irradiation in the UK in January and February led to below-budget electricity generation. However, better weather in March improved production, and the associated revenues will be recognised after the period end due to the timing of cash receipts. Curtailment in Spain also weighed on output. Taken together, these factors reduced NAV by 0.3 pence per share (pps).
Power prices increased during the period, reflecting the impact of the conflict in the Middle East. Updated forecasts from independent consultants captured these changes, with higher price expectations in the UK to 2028. In Spain, the record hydro availability and the high share of renewables in the energy mix led to lower short-term price forecasts. Overall, these movements contributed 0.1pps.
Short-term inflation assumptions also moved higher, with RPI and CPI now expected to be 4.0% and 3.0% for 2026, respectively. This resulted in a positive NAV impact of 0.4 pence per share. Longer-term assumptions remain unchanged: RPI is forecast at 3% between 2027 and 2030 and 2.25% from 2031, while CPI is expected to be 2.5% between 2027 and 2030, easing to 2.25% from 2031.
The Company continued to buy back its shares, adding 0.2pps to NAV in the first quarter of 2026. Approximately £55 million of the £60 million programme has been deployed, delivering a cumulative NAV uplift of 3.3pps since repurchases began.
Other movements, including foreign exchange, power price hedges and minor portfolio adjustments, resulted in a net negative impact of 0.3pps.
Policy changes
The investment manager reiterates its expectation that the removal of the Carbon Price Support (CPS) mechanism will have a limited effect on NAV, estimated between 0.5pps and 1.0pps. A more precise assessment will be available once independent forecasters update their power price assumptions in the second quarter. The move has, therefore, not been adopted in this update.
The UK government’s announced changes to the Electricity Generator Levy do not impact Foresight Solar’s NAV since the net power price the Company expects to receive for its electricity production is lower than the established threshold.
The investment manager awaits details on the Wholesale Contracts for Difference mechanism and will continue to assess the potential for further revenue optimisation, as well as engage with industry groups and the government to deliver the best possible outcome for shareholders.
As previously announced, the policy changes as stated so far are not expected to affect Foresight Solar’s 8.10pps dividend target or its anticipated 1.1x dividend cover for 2026.
Trading update
Lower irradiation in the UK during the first quarter – a seasonally weaker period for generation – was partly offset by better weather and above-budget output in Australia. Overall, global production was 11.2% below forecast, with solar resource 5.9% under expectations.
The investment manager continued to actively manage the Company’s power price hedging strategy during the period. Global contracted revenues are now 87% for 2026, 75% for 2027 and 63% for 2028 of forecast total revenues for each year, with average UK prices at £75.76/MWh, £70.51/MWh and £74.27/MWh for those years, respectively.
Stockwatch: why ‘Sell in May’ could genuinely apply this year
Global stock markets remain near record highs but are volatile and vulnerable to shifts in the global geopolitical landscape. Analyst Edmond Jackson shares his new investment outlook.
5th May 2026
by Edmond Jackson from interactive investor
In King Lear, the phrase “all shall be well” represents a desperate, ironic, or deluded hope for peace amid overwhelming tragedy and madness.
Perhaps this, together with a collective willingness to “buy the drop” after authorities provided stimulus through financial crises since 2008, explains the social psychology propelling markets to record highs – despite the International Energy Agency (IEA) declaring the closure of the Strait of Hormuz to be the biggest energy security threat in history.
There was also the experience of equities rebounding strongly from April 2025 after US President Donald Trump imposed reciprocal tariffs.
But for how long can complacency run? With no sign of either the US or Iran blinking first over the oil deadlock, analysts predict a tipping point in four weeks as stocks of oil and commodities run down.
While UK government messaging reassures about petrol supply (chiefly to avert panic buying), as I cruised down the M40 on Sunday the gantries displayed “Beaconsfield Services: No Fuel”. It seems 20p or so on a litre of fuel is just a taste of things to come. And pick your own number as to where oil prices could go. At least crude markets sense what is happening, with Brent up from around $90 a barrel on 20 April to over $113 now.
Stock markets remain in happy-go-lucky mode
Besides “all shall be well” (by way of a Middle East settlement despite no real negotiations) traders have also assumed the “Trump Always Chickens Out” (TACO) rationale; that he would back down in the face of US discontent with high fuel prices ahead of mid-term elections. Most have underestimated the resilience of the hardline Revolutionary Guard now in effective control of Iran, with its fresh sense of power over the US and its allies via control of the Strait.
Last Thursday, the Bank of England left interest rates unchanged at 3.75%, but said the UK may need to brace for increases later this year given that “higher inflation is unavoidable” and would probably peak at 6% by the start of 2027 – in a worst-case scenario of oil over $130 and remaining high. Unemployment would rise to 5.6% and interest rates to 5.25% to combat this.
Interestingly, several housebuilders saw share prices bounce as much as 10% in response to “in line” trading updates – as if builders had already fallen so far this year that they’re pricing in a worst-case scenario for confidence among home buyers and industry operating costs.
Yet as with many shares currently, a happy consensus remains for moderate earnings growth in 2026 and 2027, which is at odds with the rising risk of mild recession. Without a resolution over the Strait, forecasts need a dose of realism. Even if it was to promptly reopen, economists say 2026 growth would be half what was previously expected. But longer closure implies a recession.
Iran has this morning warned the US against being “dragged back into the quagmire” after a day of attacks in the Strait, with Monday having seen the start of Trump’s “Project Freedom” where the US military supposedly guides stranded cargo ships out of the waterway. Of around 2,000 such ships, the US says two US-flagged vessels were able to leave yesterday.
I doubt the US will be able to walk away as TACO traders assume. Israel and United Arab Emirate (UAE) states will likely be pushing to “finish the job” militarily, although it’s unclear how realistic that is given an entrenched and resilient Iran.
A chief hope would appear to be Iran facing its own crisis as oil storage capacity fills up and the flow of money to its military may soon start to dry up.
Perhaps the stalemate will persist another month until another big jump in oil prices forces a decision by the US.
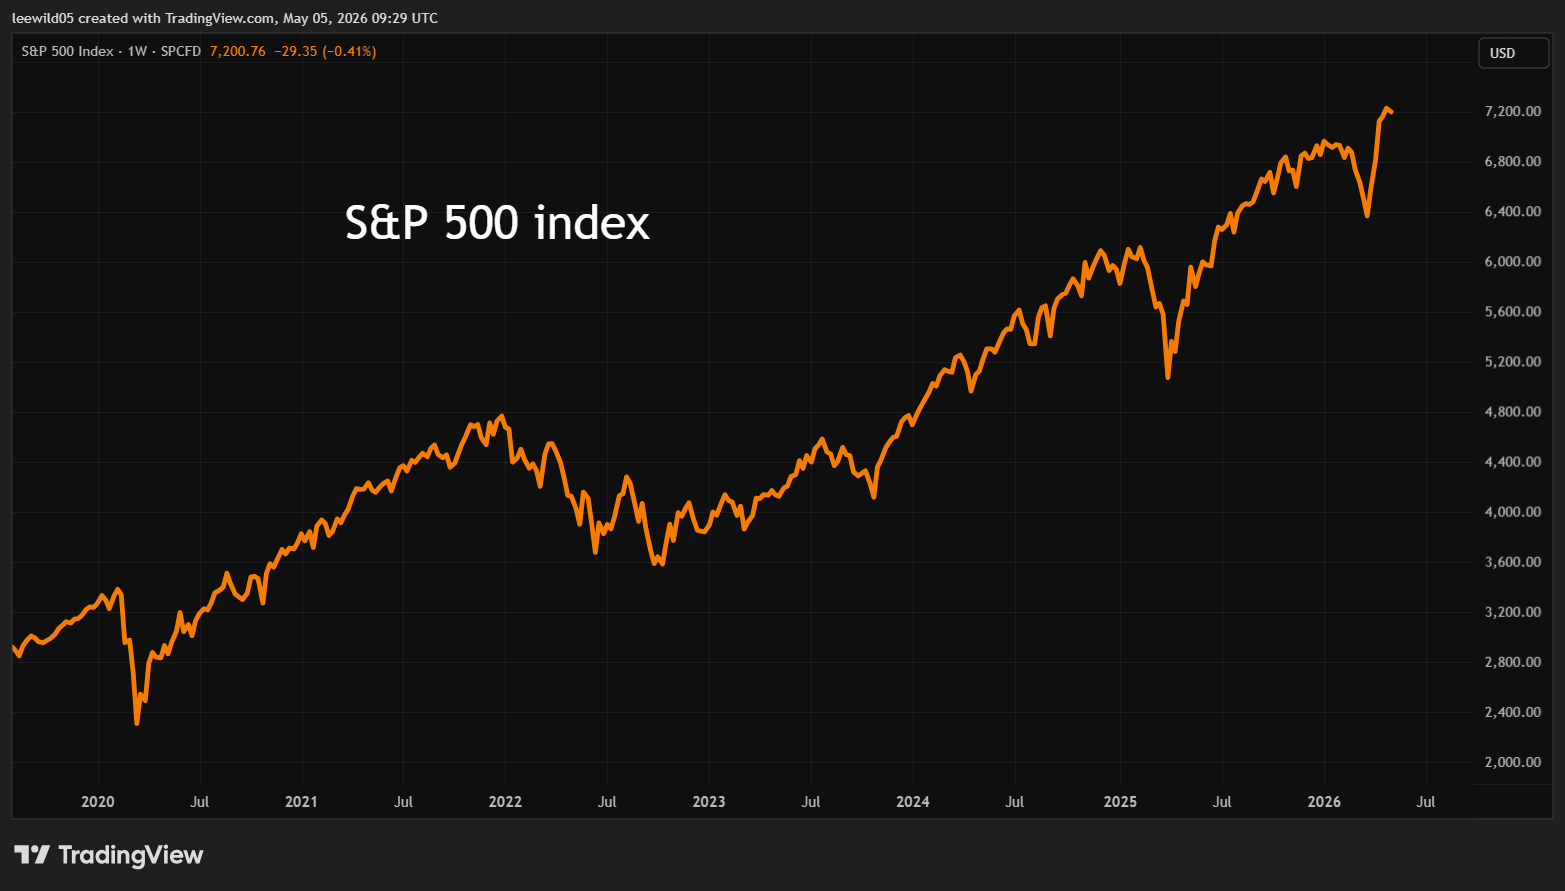
Meanwhile, US shares have continued to rally, aided by strong first-quarter earnings, but the S&P 500 looks exposed on a price/earnings (PE) ratio around 28-30x versus an historic mean average of 16-18x.
Source: TradingView. Past performance is not a guide to future performance.
Rising economic and political risk in the UK
While the government continues to reassure on fuel supply, a significant risk is US oil imports constituting nearly a third of the UK’s imported primary oil. If shortages continue to force US fuel prices up, then it seems to me that Trump’s America First agenda could see the US restricting exports. We have to hope the recent “soft diplomacy” of King Charles’ visit carries some influence, yet Trump is notoriously mercurial and it seems hard to envisage the UK being made a special case under export restrictions.
This Thursday’s local elections are an important test of the Labour government under Keir Starmer, where a drubbing will renew calls for a replacement prime minister. Andy Burnham, Labour mayor of Greater Manchester, has reportedly identified several seats where MPs are prepared to step aside, enabling a by-election for his return to Parliament. A formal challenge could therefore manifest shortly. The gilt market might see him as preferable – being relatively soft-left – than Angela Rayner, who still has to resolve her property tax affairs with HMRC.
If, therefore, Starmer is forced to step down by his Cabinet, it would create near-term uncertainty, but I do not think as serious a concern as, for example, the way Labour has run up welfare benefits ahead of income tax receipts (according to the Office for Budget Responsibility data in respect of the 2025-26 financial year).
A parallel with early 2020 as Covid spread from China?
If you recall, New Year 2019 already had reports about how the Wuhan virus was inevitably heading our way, yet stock markets continued to rally in January and February to record highs. It took until the week of 9 March 2020 for equities to fall sharply. While the ensuing lockdowns were obviously a starker hit to economic activity than high energy prices and possible fuel shortages, there seems a commonality in “reality postponed” as markets partied on.
It would seem to need price rises – air tickets, food and fuel especially – impacting inflation – to strike truth this time around.
Coincidental is the longstanding adage “Sell in May and go away”, which actually originated from farmers managing their cash flow in decades past, when the US market was dominated by individual investors. Yet various studies suggest it is not a reliable investment strategy despite summer and early autumn producing lower or more volatile returns than winter.
This is chiefly because you are then left with the dilemma when to buy back and may miss intervening rallies and compounding gains.
The same could be said to apply now, although a retreat from adding risk seems wise, if only to ensure cash is available for potential opportunities in what looks a volatile summer ahead.
Edmond Jackson is a freelance contributor and not a direct employee of interactive investor.
A resurgence in inflation driven by energy price spikes from geopolitical tensions has created an environment where passive dividend benchmarks are struggling to maintain real purchasing power.
A diversified mix across the Financial, Industrial, and Utilities sectors provides a defensive “Yield Shield,” built to combat inflation and volatility.
By combining “Strong Buy” Quant ratings with elite Dividend Safety, this trifecta of all-weather leaders offers a 48% income premium over VIG, proving that investors can withstand volatility.
I am Steven Cress, Head of Quantitative Strategies at Seeking Alpha. I manage the quant ratings and factor grades on stocks and ETFs in Seeking Alpha Premium. I also lead Alpha Picks, which selects the two most attractive stocks to buy each month, and also determines when to sell them.
AndreyPopov/iStock via Getty Images
Building a Yield Shield
The first four months of 2026 have delivered an important reminder to income investors: Safety will require an active mindset more often than not. Ending the first quarter, sticky inflation has become a concern once again—bolstered by a 12% spike in energy prices ignited by the U.S. involvement in the Iran War.
For those parked in standard dividend appreciation benchmark ETFs, the results have been less than ideal. While the broad market has remained resilient—with the S&P 500 rising 10.4% in April for its biggest monthly gain since November 2020—income investors searching for yield in traditionally “safe” ETFs have struggled to keep pace with the recent reemergence of inflation.
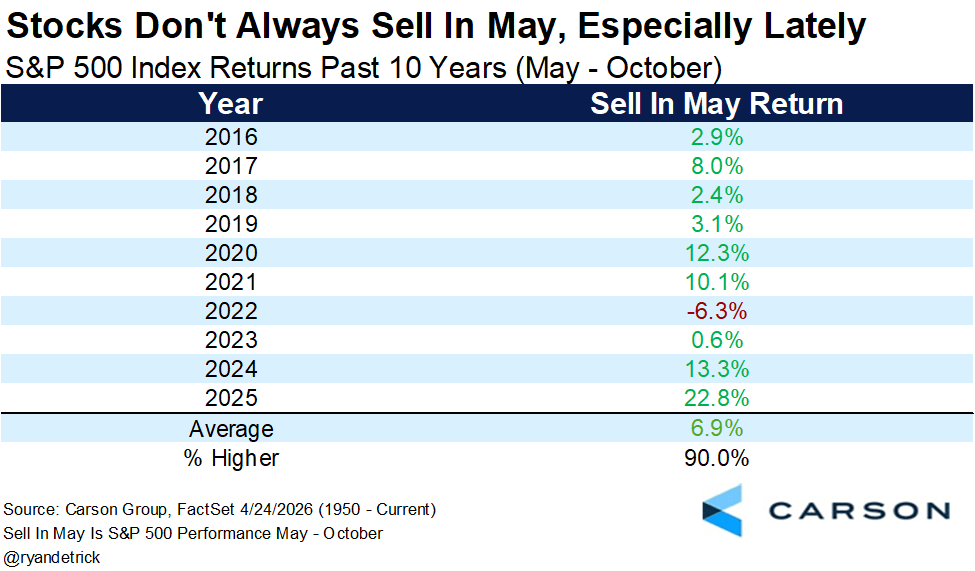
As the calendar turns over and we hit the month of May, financial pundits across the media are likely to dust off their favorite annual warning, “Sell in May and go away.” After all, it’s a midterm year, right?
Recent history writes a different story, though. While the next six months do typically produce weaker gains, it has rarely been negative. In fact, since 2016, only 2022 saw negative performance in May-October.
Carson Group
Skeptics would be right to point out that 2022, the last midterm year, was also fraught with inflation worries. But 2026 is not 2022. The “noise” may continue to echo across Wall Street this summer, which is why investors should be looking for an “all-weather” diversified solution.
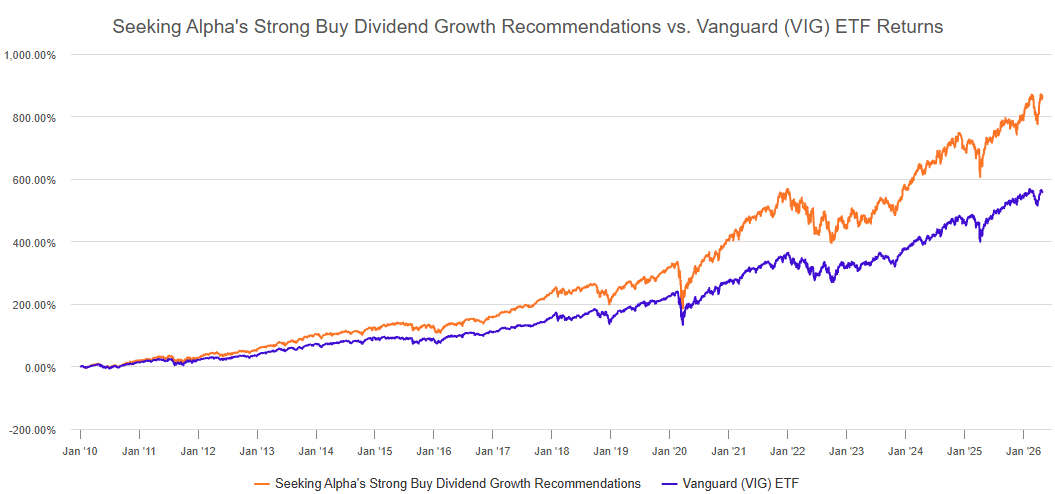
Investors can find signals in Seeking Alpha’s Quant Model, which has consistently outperformed the Vanguard Dividend Appreciation ETF (VIG) over the past decade. The historical chart below illustrates the effectiveness of this quantitative approach and sets the table for the three-pillar strategy we’re discussing today.
Seeking Alpha
Three Sector Pillars
Today, we are looking at a trifecta of income leaders across the Financial, Industrial, and Utilities sectors. Three companies that together can capitalize on sticky inflation, withstand geopolitical shocks, and provide a safe yield cushion.
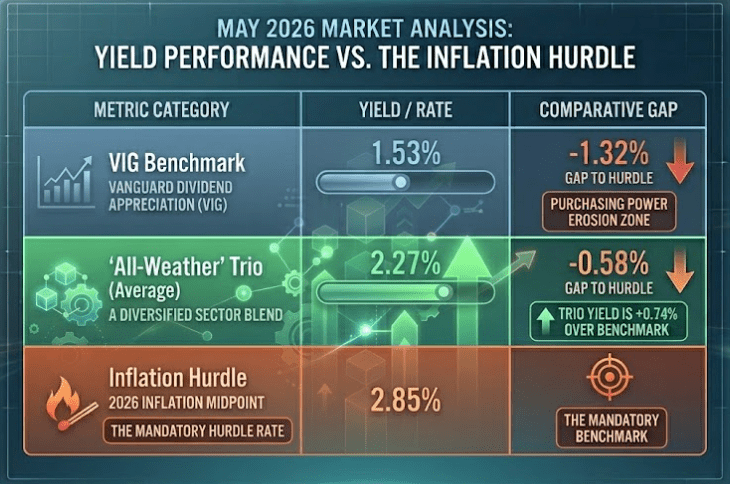
To see why this targeted approach is necessary, let’s compare our selected three stocks to VIG using the Trailing Twelve Month [TTM] Yield.
And to better understand the inflation gap, we have averaged the Pre-War inflation of 2.4% (February) and the Post-War inflation of 3.3% (March) to settle on a “Hurdle Rate” of 2.85%. This smoothes out the “war premium” volatility and provides a baseline for what income investors should be seeking.
Seeking Alpha
VIG’s passive income is no longer within striking distance of the cost of living in the current economic climate. Our All-Weather Trio represents a 48% income premium over the benchmark (when taking the simple average of the trio’s Dividend Yields [TTM] compared to that of VIG), more sector diversification, and a positive spread against pre-war inflation.
To select the best “all-weather” dividend stocks to feature in this article, I used the Seeking Alpha Stock Screener and chose the pre-selected Top Quant Dividend Stocks and filtered for Quant Strong Buys. I then selected stocks that exhibited strong Profitability Factor Grades, high Dividend Safety Grades, and ensured the selections created a sector-diverse group.
The dividend safety grade leverages a sophisticated data-driven approach to offer a reliable assessment of a company’s ability to keep paying its dividends and avoid dividend cuts. Our own Quant System backtesting helped avert 98.1% of Dividend Cuts By Owning Stocks With Dividend Safety Grades from A+ to B-.
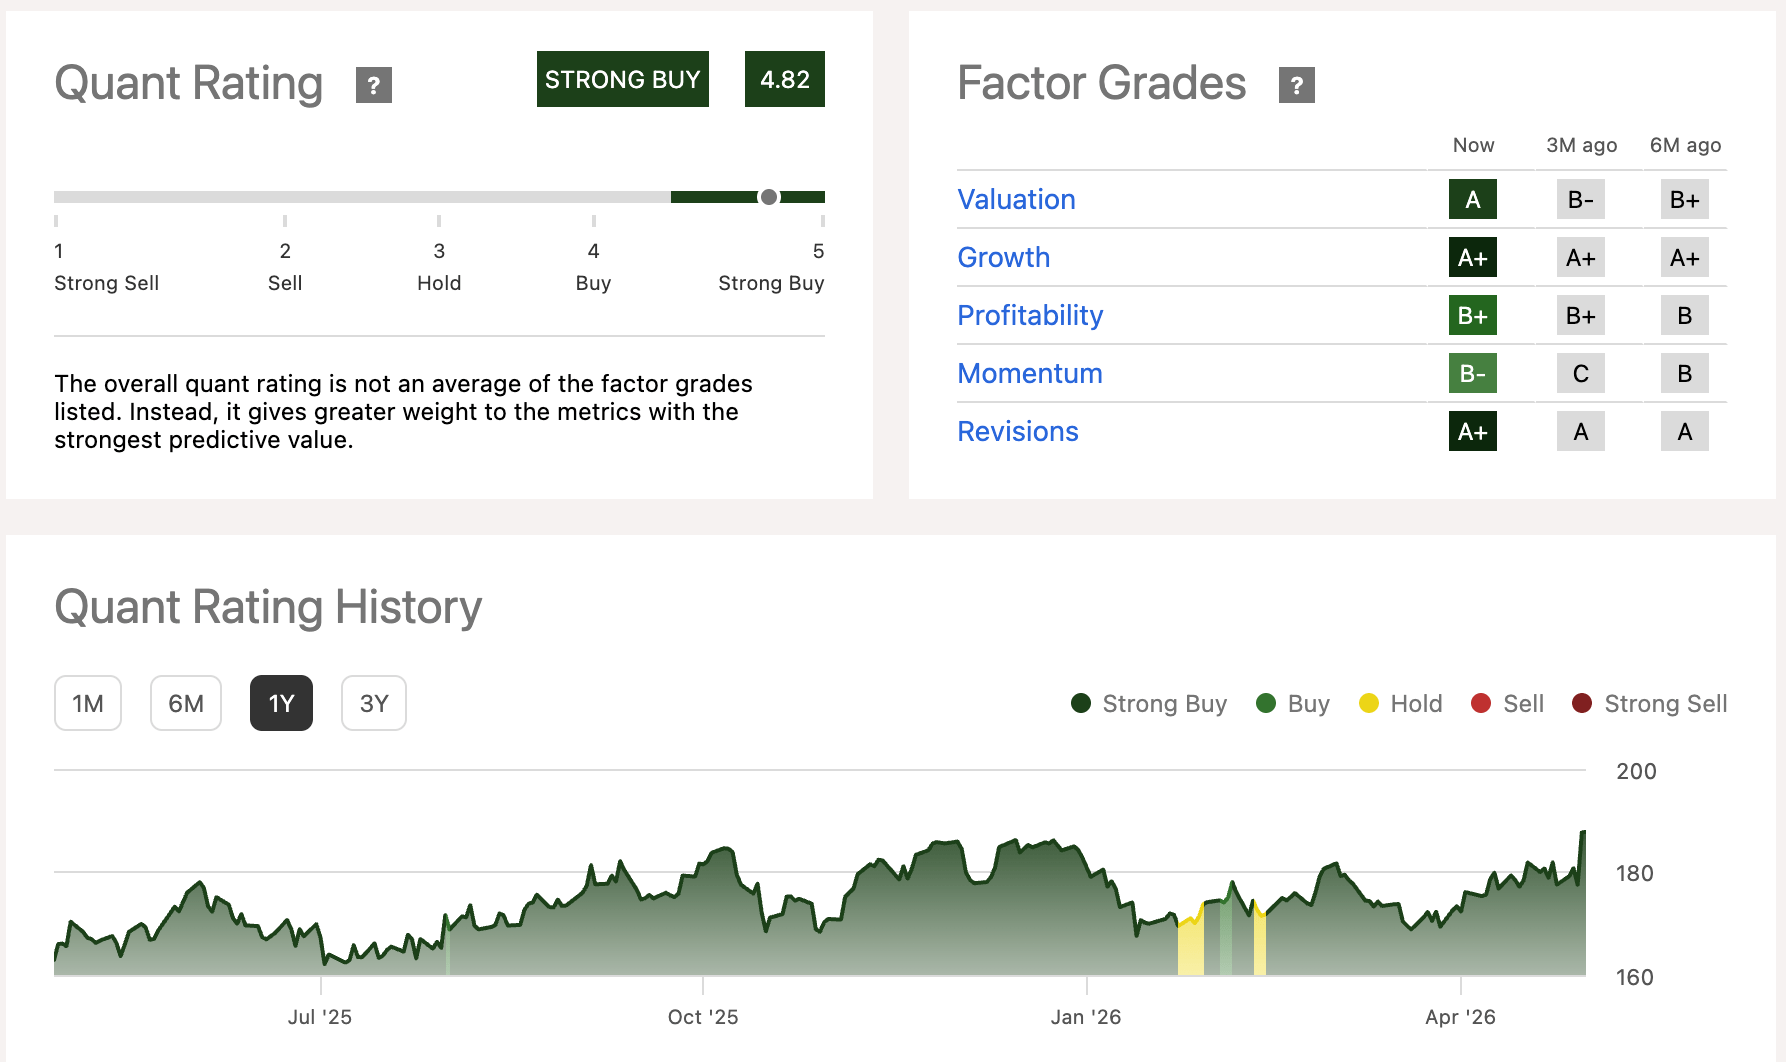
Among my top dividend stock picks for volatile markets in March, the Hanover Insurance Group provides coverage for business, personal, and specialty lines across the U.S.
A diversified portfolio with pricing power has allowed THG to perform across a volatile economic cycle. Insurance is one of the few sectors where the rising costs for consumers can directly translate into widening margins, offering a potential inflation buffer.
On its recent Q1 earnings call, CEO John “Jack” C. Roche said the company “achieved record first quarter performance, including an operating return on equity of 20.3% and operating earnings per share of $5.25…”
Seeking Alpha
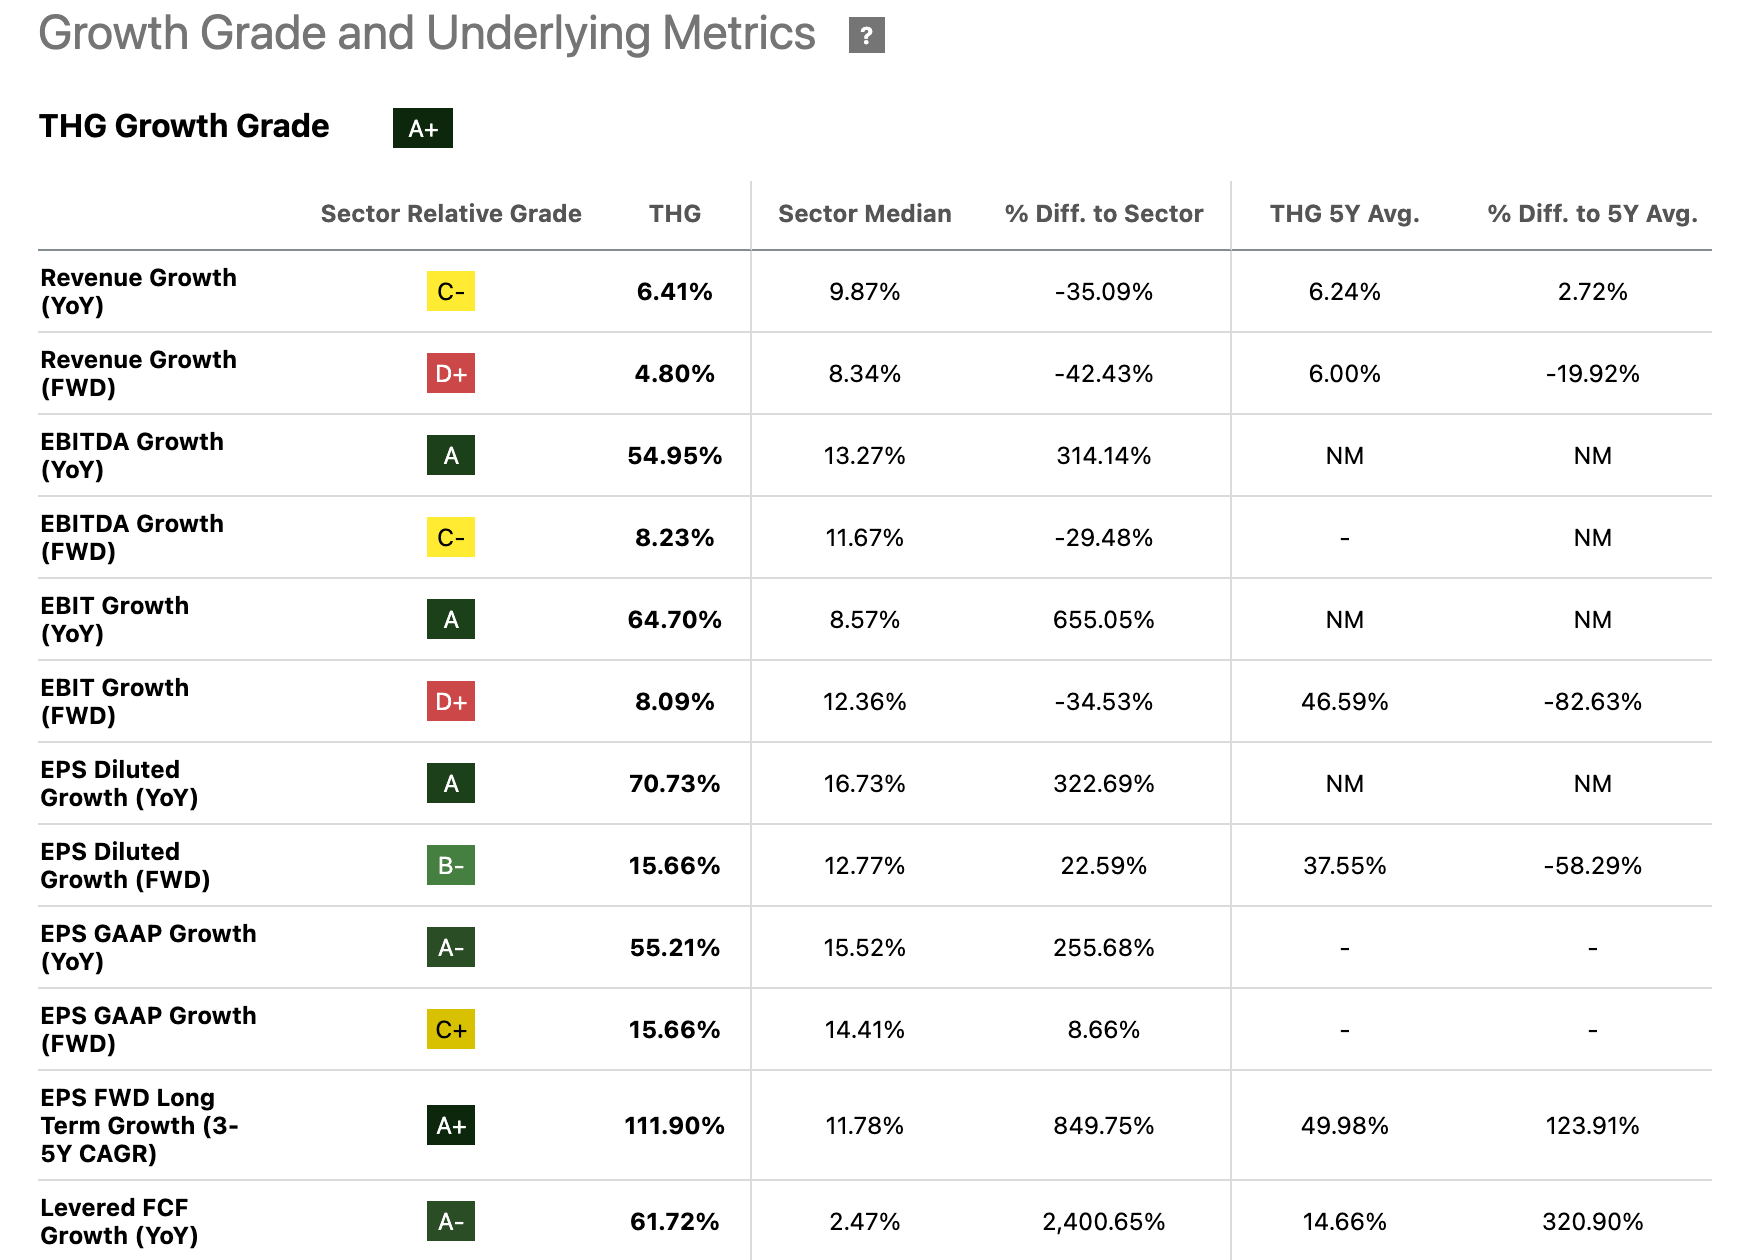
This recent financial success is a pillar of its ‘A+’ Growth Grade and is fueled by management’s expectations that its first quarter growth will continue to accelerate. This is illustrated below by its ‘A+’ grade in EPS FWD Long-Term Growth.
Seeking Alpha
Dividend Grade Scorecard
Seeking Alpha
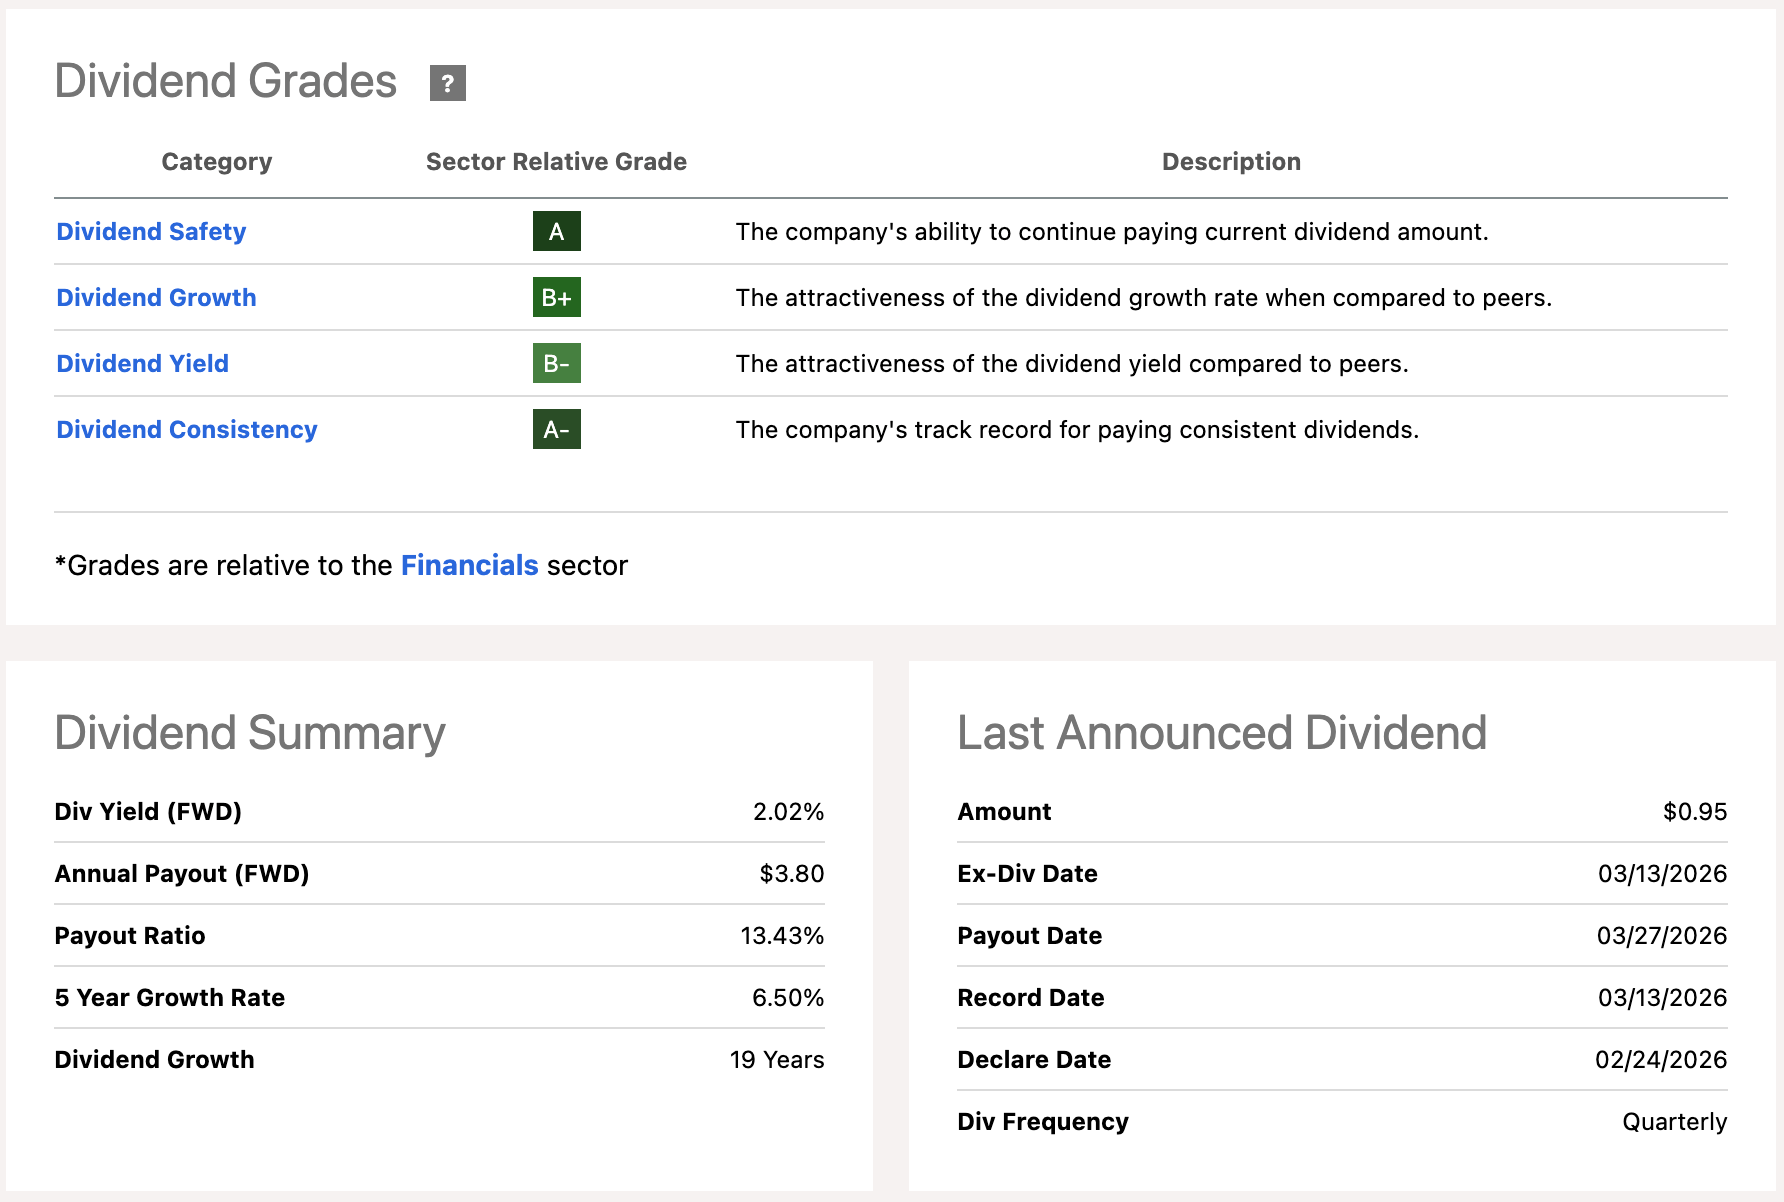
THG’s Dividend Consistency Grade of an ‘A-‘ is backed by its two-decade track record of dividend payments, outpacing this reliable sector’s median of 15.7 years by over 27%. This should give investors prioritizing quality and reliability an appealing opportunity to capitalize on this uncertain inflationary climate.
When global energy markets are the catalyst for increased volatility, the industrial sector may not be the first place you look for value as it often feels the burden of rising energy costs quickly. But FedEx has proven to be an exception to that thinking.
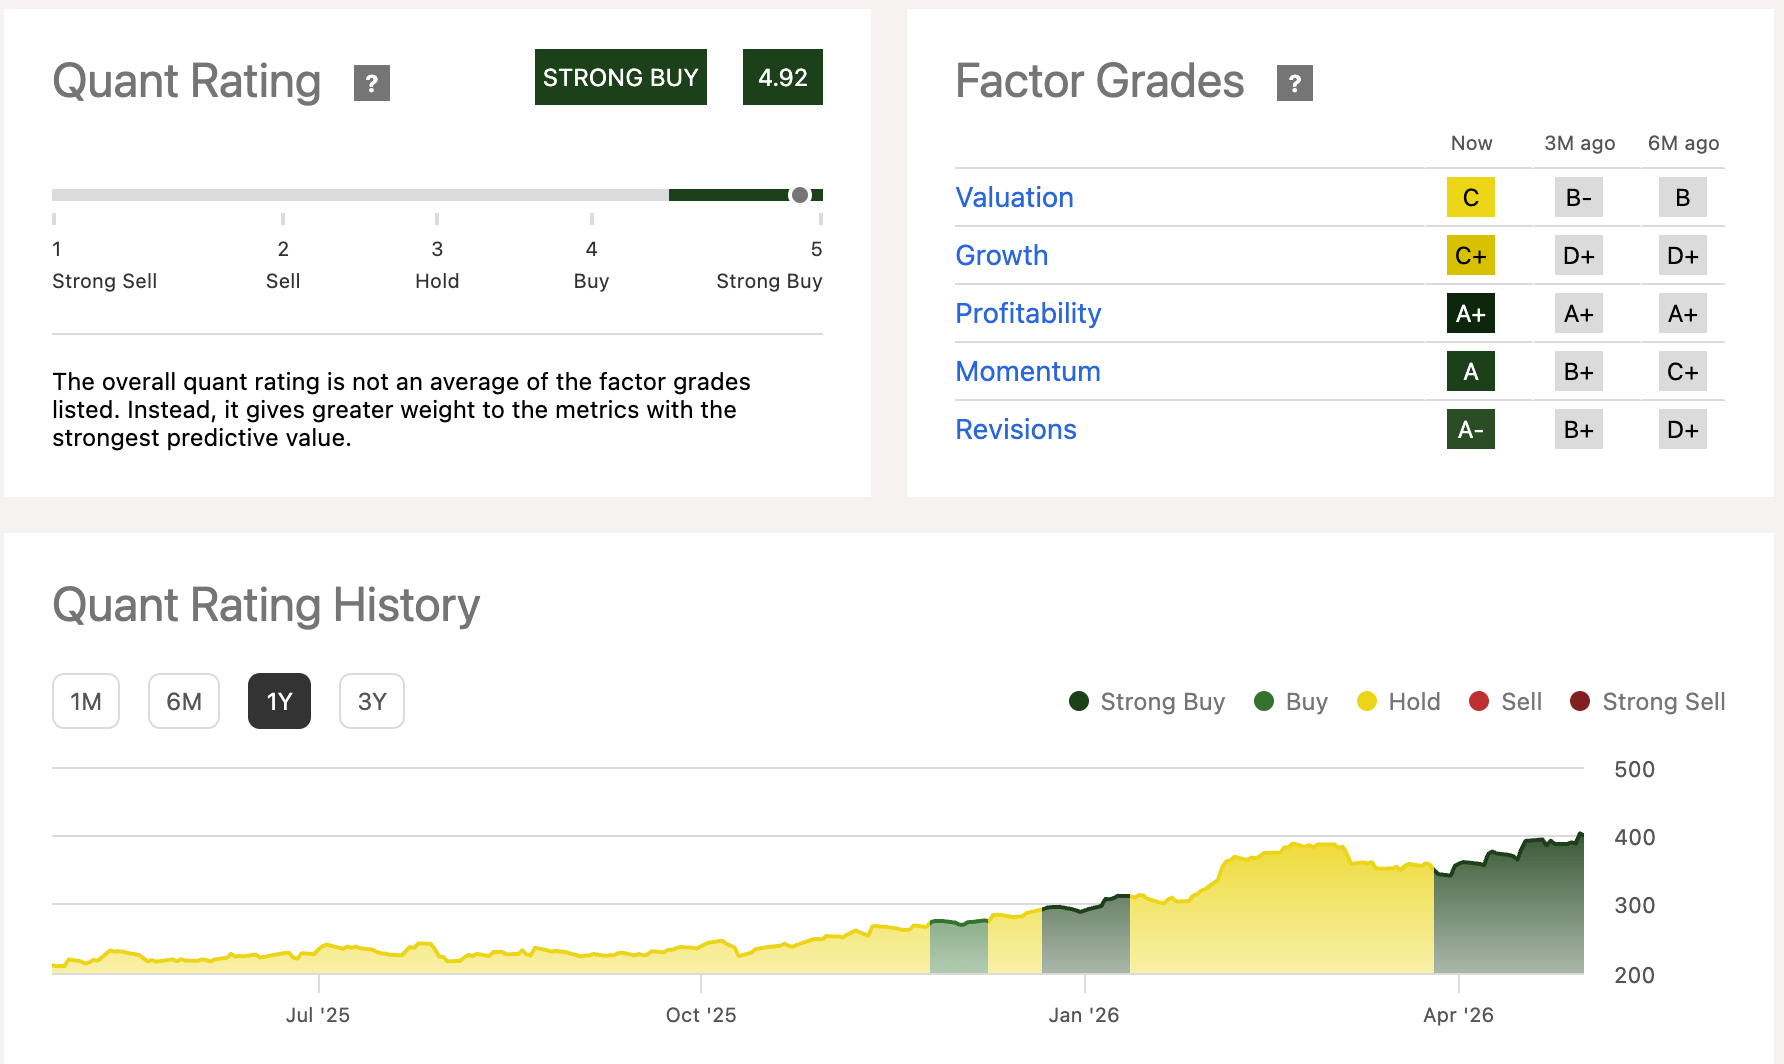
The world’s largest express package provider was able to create internal efficiencies this year, unlocking tremendous value. Our Quant System currently rates FDX a Strong Buy, backed by an ‘A+’ Profitability Grade and an ‘A’ Momentum Grade that has improved consistently over the past year.
Seeking Alpha
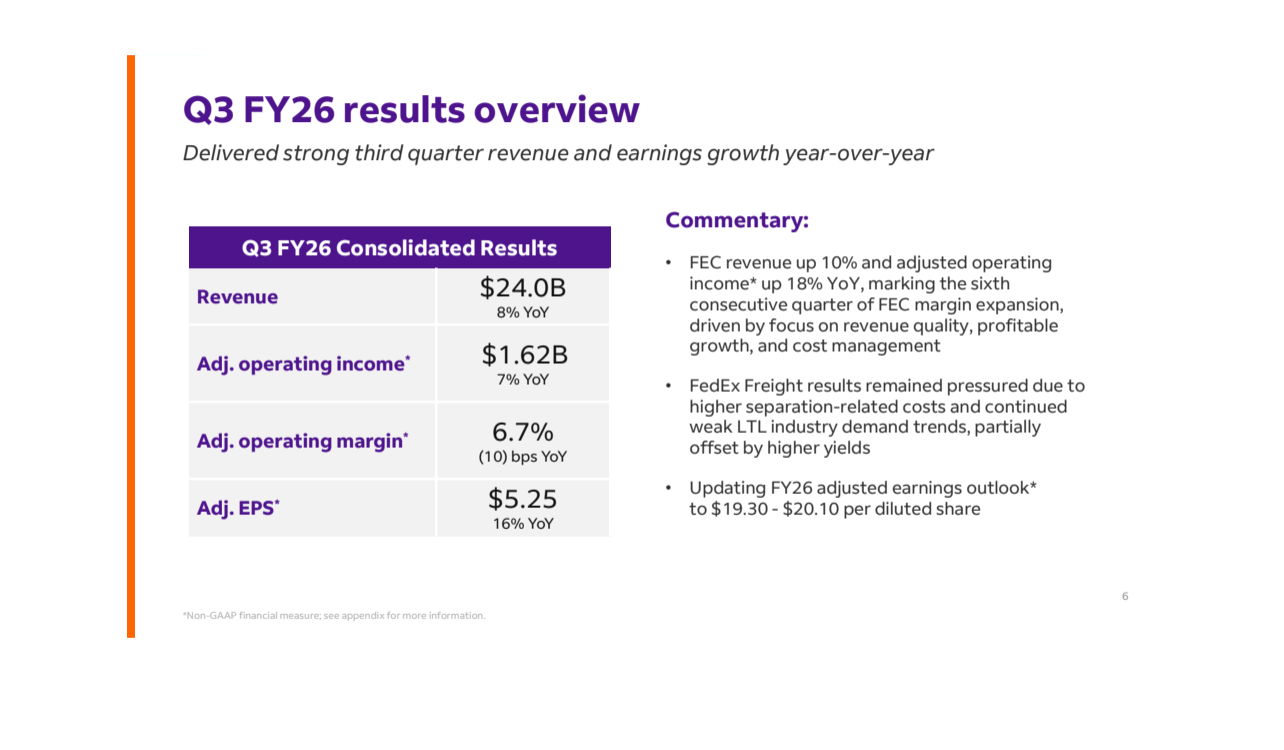
FedEx showed remarkable revenue growth of 8% in FYQ3, with a 5% increase in U.S. domestic package volumes driven by significant account acquisitions resulting in increased market share. This is coupled with the tremendous success of its “DRIVE” program, which met its cost-savings target in FY2025, saving $2.2B.
FedEx FY2026 Q3 Earnings Presentation
Dividend Grade Scorecard
Seeking Alpha
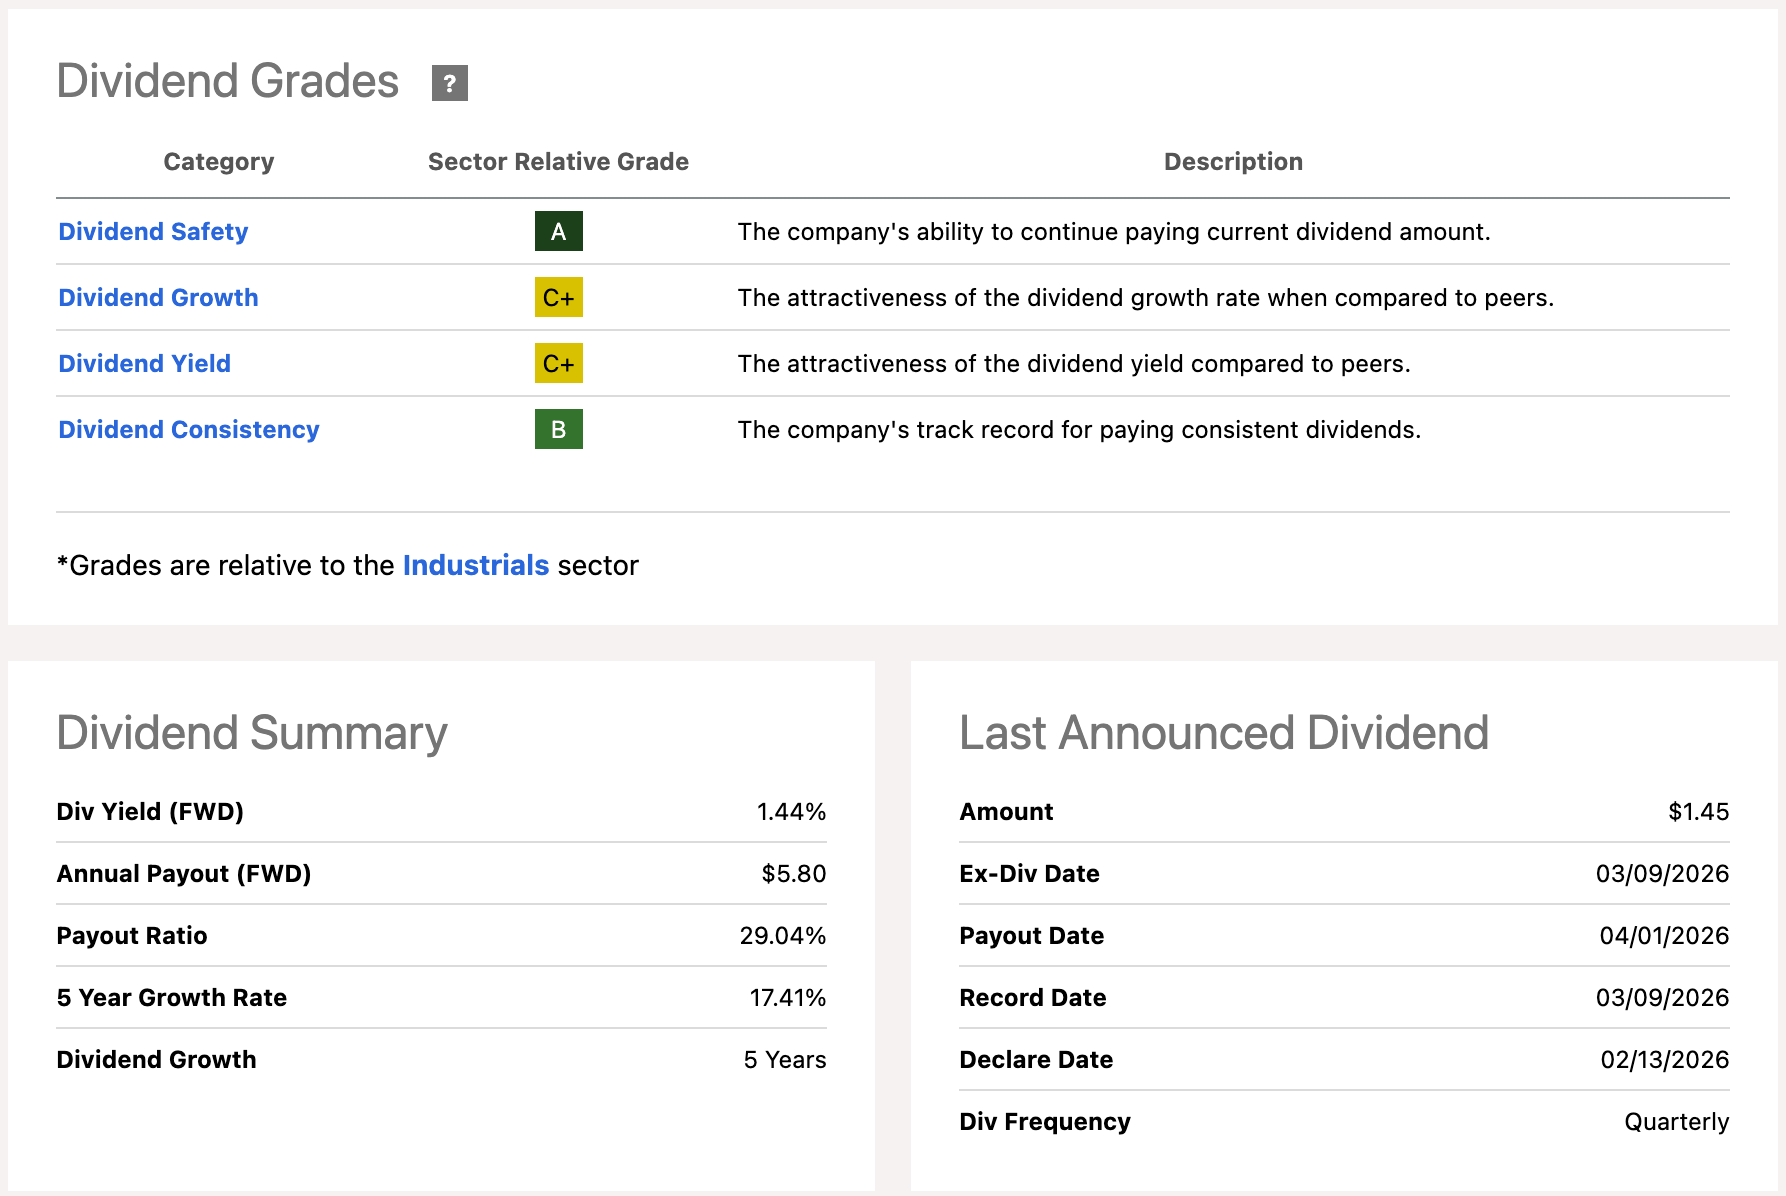
FedEx’s strong Quant Profitability Grade is a primary driver behind its ‘A’ Dividend Safety Grade. Led by its Cash From Operations (TTM) at $8.18B, a figure that trounces the sector median of $416.86M. At about 20x that of its Industrial peers, FedEx’s cash position provides a significant cushion to weather the temporary rise in energy costs while maintaining long-term strategic initiatives.
The final pillar of this VIG-beating trio provides the foundation for our all-weather grouping. New Jersey Resources Corporation (NJR) offers a non-discretionary staple of the utilities industry, securing stable and reliable cash flows that benefit from a supportive regulatory environment. NJR is comprised of five business units:
New Jersey Natural Gas
NJR Clean Energy Ventures
NJR Energy
Storage & Transportation
NJR Home Services
Seeking Alpha
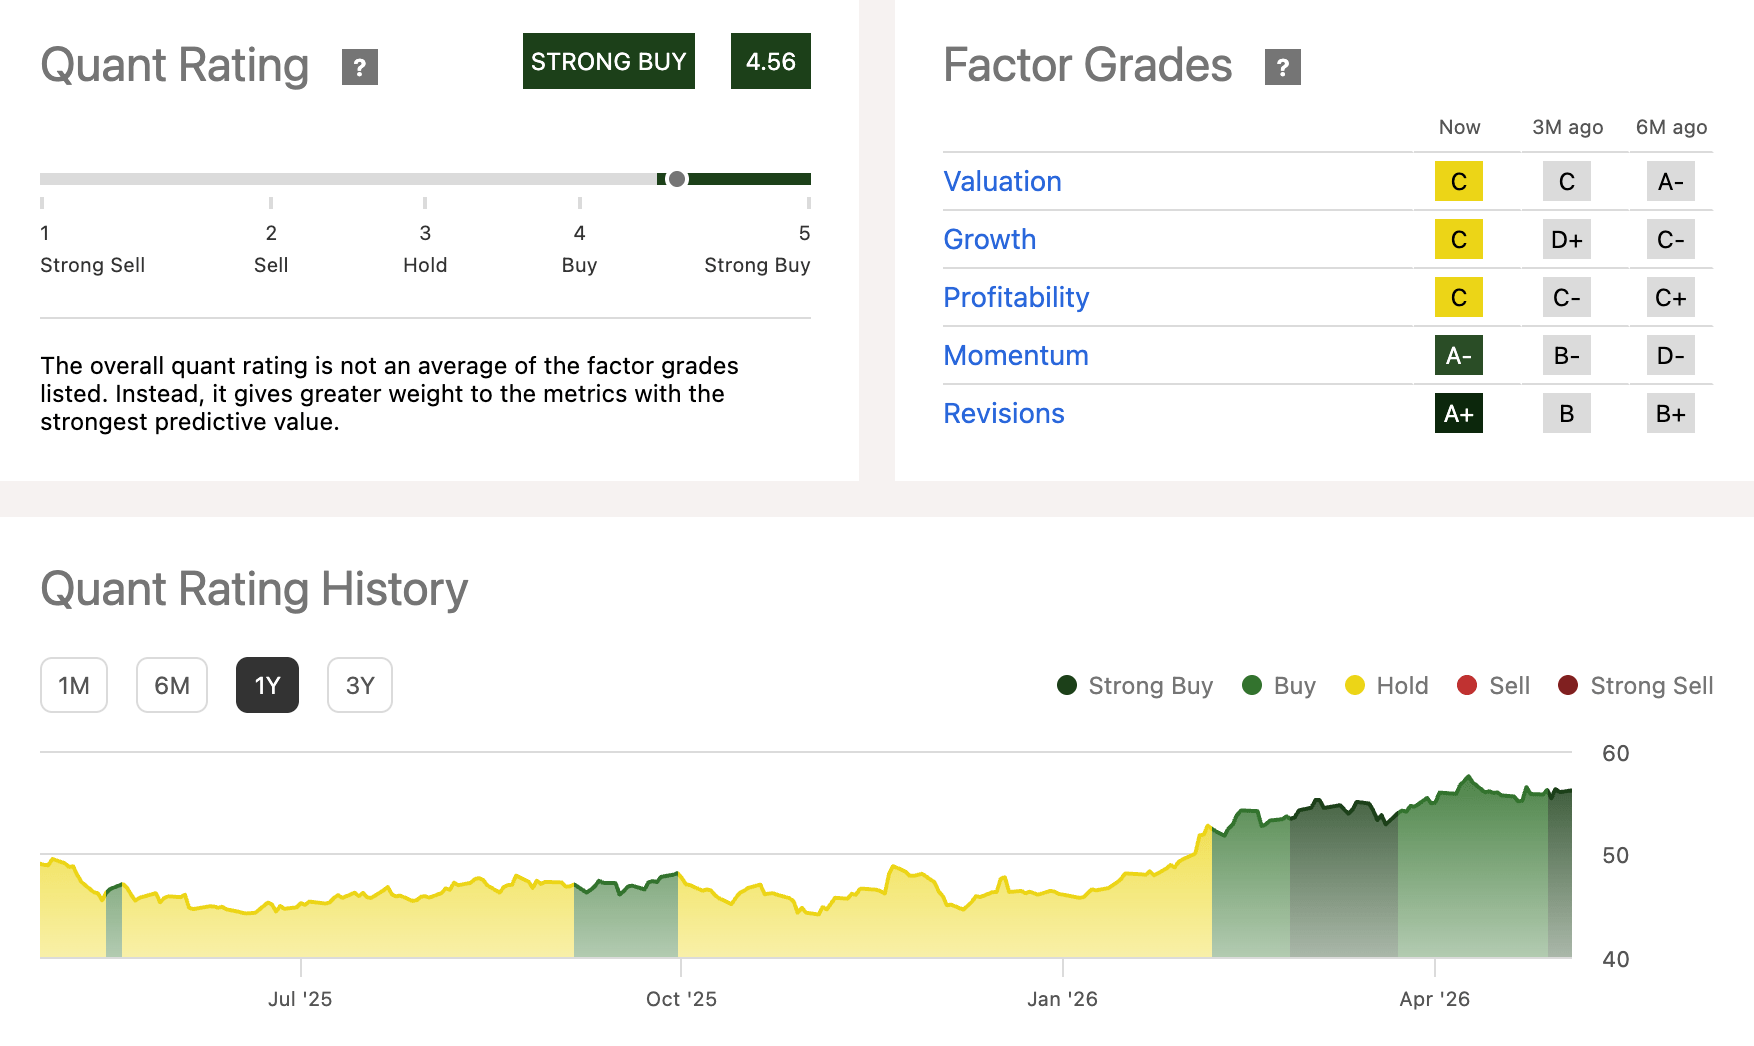
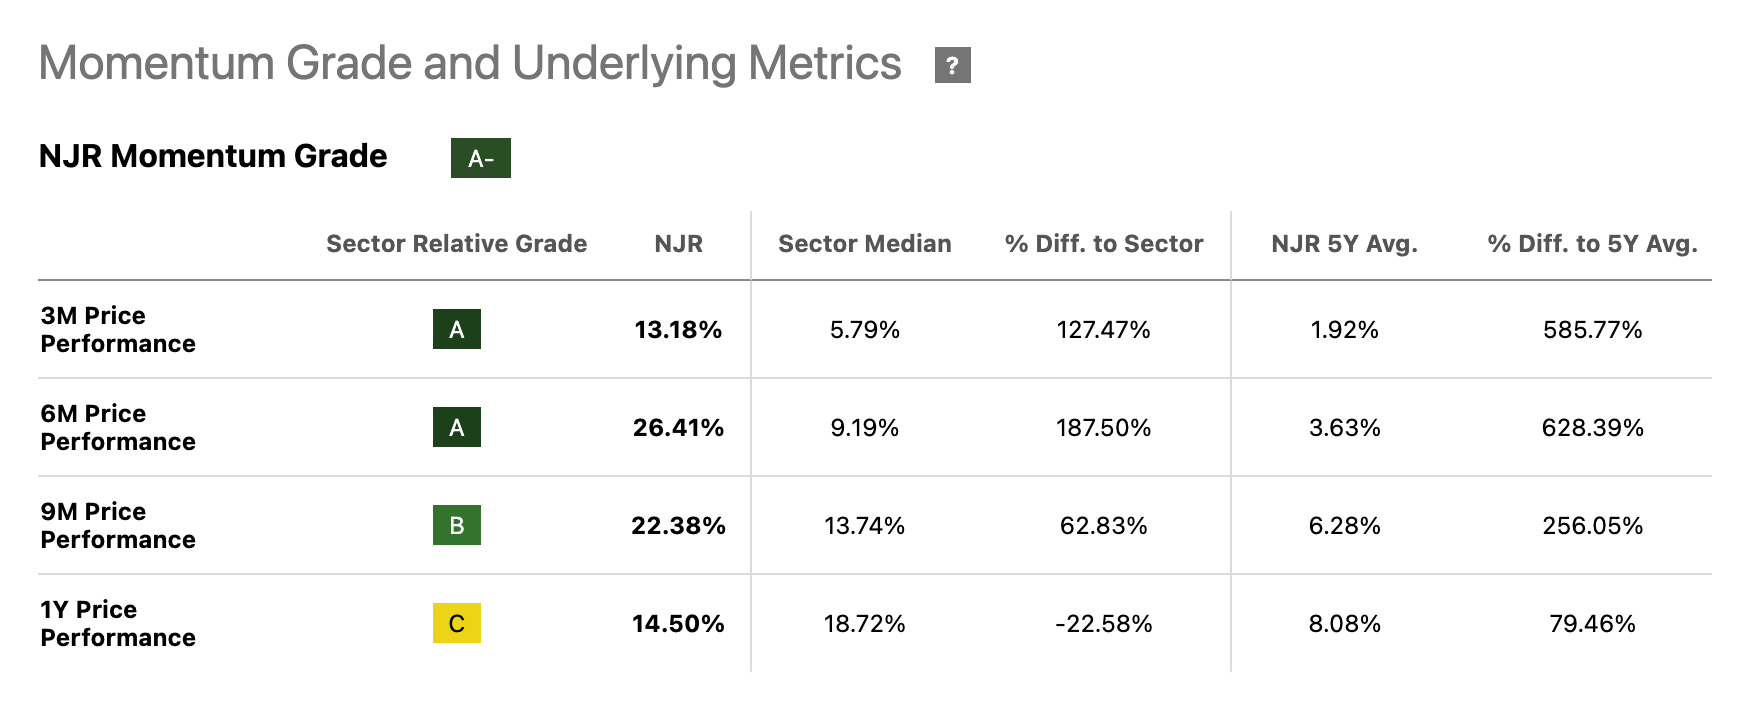
Our Quant System currently highlights NJR’s rapid Momentum Grade increase – currently an ‘A-’, when only six months ago it was rated a ’D-’. Investors should consider capturing this momentum heading into the summer. As shown below, NJR’s 3M and 6M Price Performance both have strong ‘A’ ratings and beat the sector median by more than double. This recent uptrend has also led to six upward revisions to year-end EPS guidance.
Seeking Alpha
Before diving into the dividend grades, I want to address NJR’s low-rated Cash Per Share (TTM) metric. Unlike tech firms that hoard cash to buffer against volatile economic environments, utilities like NJR “hoard” active infrastructure. In this sector, cash not invested is an asset not being utilized for future growth.
Because returns are regulated, cash flows are only generated when infrastructure is active and in the ground. Income investors shouldn’t be concerned about a lean cash balance sheet because this process requires significant, continuous capital investment and is largely a byproduct of putting its capital to work. You don’t have to look very far to find proof of a healthy business model. Just take a look at its dividend payout history…
Dividend Grade Scorecard
Seeking Alpha
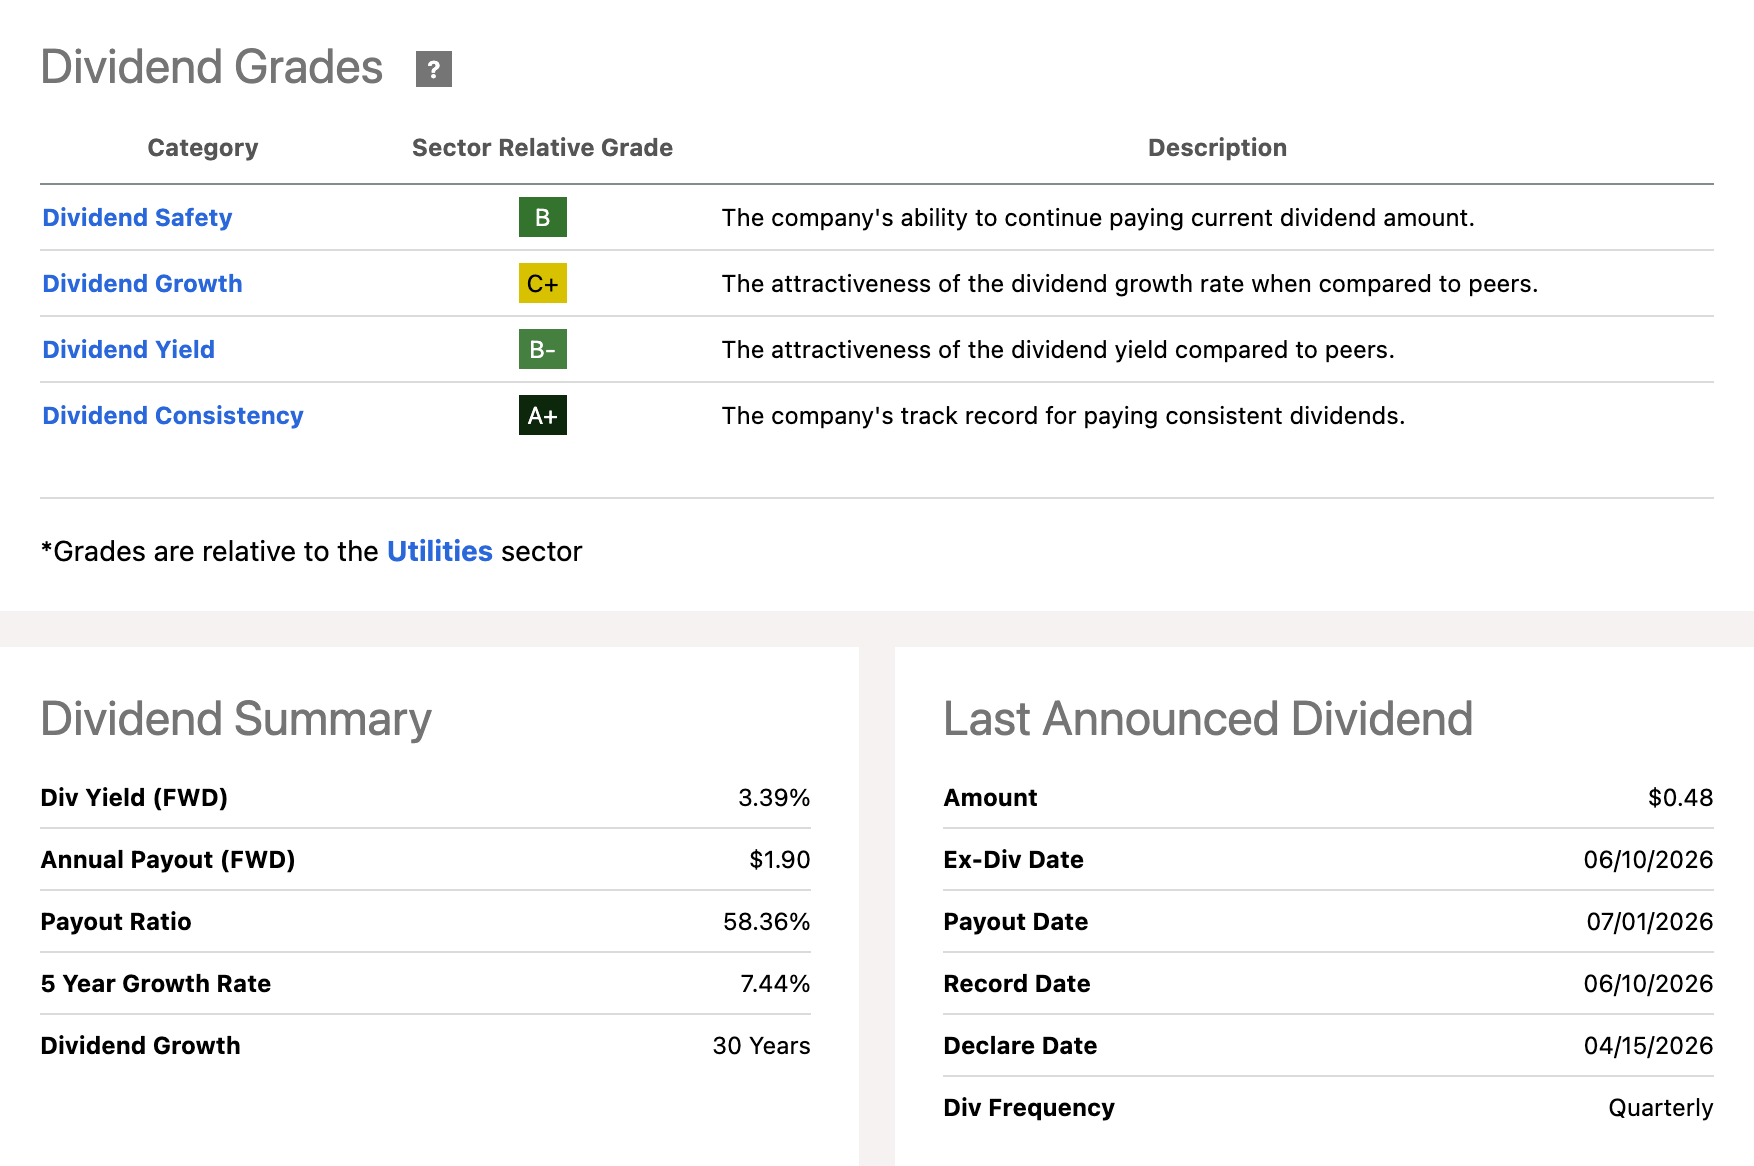
NJR’s reliable track record is underpinned by its strong dividend consistency grade, highlighted by an eye-popping 36 consecutive years of payments—including 30 straight years of growth. This reliability is matched by its strong income potential, with NJR’s Dividend Yield [FWD] standing at 3.39%, topping the sector median by 8.30%.
Looking Ahead: All-Weather Protection
This year has so far presented investors with curveball after curveball. However, you don’t have to sacrifice returns for safety, nor do you have to risk your portfolio for growth. You simply need a balanced, “quantamental” approach to income investing—one that finds the sweet spot of an all-weather portfolio.
While we hope inflation doesn’t stick around, income investors must be prepared for any scenario that comes down the pike later this year. If the first four months are any roadmap, more surprises are likely on the horizon, and this trio of all-weather stocks is ready to shield you from them.
More on my IG service
I am Steven Cress, Head of Quantitative Strategies at Seeking Alpha. I manage the quant ratings and factor grades on stocks and ETFs in Seeking Alpha Premium. I also lead Alpha Picks, which selects the two most attractive stocks to buy each month, and also determines when to sell them.
This article was written by
Steven Cress, Quant Team
Analyst’s Disclosure: I/we have no stock, option or similar derivative position in any of the companies mentioned, and no plans to initiate any such positions within the next 72 hours. I wrote this article myself, and it expresses my own opinions. I am not receiving compensation for it. I have no business relationship with any company whose stock is mentioned in this article
Seeking Alpha’s Disclosure: Past performance is no guarantee of future results. No recommendation or advice is being given that any particular security, portfolio, transaction or investment strategy is suitable for any specific person. The author is not advising you personally concerning the nature, potential, value or suitability of any particular security or other matter. You alone are solely responsible for determining whether any investment, security or strategy, or any product or service, is appropriate or suitable for you based on your investment objectives and personal and financial situation. Steven Cress is the Head of Quantitative Strategy at Seeking Alpha. Any views or opinions expressed herein may not reflect those of Seeking Alpha as a whole. Seeking Alpha is not a licensed securities dealer, broker or US investment adviser or investment bank.
• the Company will invest in equities in order to achieve its investment objectives, which are to provide both income and capital growth, predominantly through investment in mid and smaller capitalised UK companies admitted to the Official List of the UK Listing Authority and traded on the London Stock Exchange Main Market, on AIM or AQSE or traded on other qualifying UK marketplaces.
• the Company will not invest in preference shares, loan stock or notes, convertible securities or fixed interest securities or any similar securities convertible into shares; nor will it invest in the securities of other investment trusts or in unquoted companies. The Company may retain investments in companies which cease to be listed after the initial investment was made, so long as the total is non-material in the context of the overall portfolio; however, the Company may not increase its exposure to such investments.
Financial Highlights
31 October
30 April
Capital
2025
2025
% change
Total gross assets (£’000)
32,718
30,328
7.88
Total net assets (£’000)
32,568
29,867
9.04
Net asset value per Ordinary share
145.07p
133.04p
9.04
Mid-market price per Ordinary share
131.00p6.54%
128.50p
1.95
Discount
(9.70%)
(3.41%)
Six months to
Six months to
31 October
31 October
Revenue
2025
2024
% change
Return per Ordinary share
3.57p
6.41p
(44.31)
Dividends declared per Ordinary share*
5.00p
6.50p
(23.08)
Total return
Total return on Group net assets**1
13.32%
(23.82%)
* Dividend per Ordinary share includes the first interim paid and second interim declared for each of the periods to 31 October 2025 and 2024 and will differ from the amounts disclosed within the statement of changes in net equity.
** Adding back dividends distributed in the period.
1 These are alternative performance measures (‘APM’) (see APM glossary for further information).
Interim Management Report
This half-yearly report covers the six months to 31 October 2025. The net asset value per Ordinary share as of 31 October 2025 was 145.07 up from 133.04p as of 30 April 2025, an increase of 9.0% during the period. As at the 28 November 2025 the NAV per share has decreased to 143.69p.
Since the beginning of the Company’s financial year, the Ordinary share price has increased from 128.5p to 134.0p as of 31 October 2025, an increase of 4.3%. Since the period end the shares have slightly decreased in price to 133.0p and as at 28 November 2025 the shares traded on a discount of 7.4%.
Dividend
As previously indicated, the Board has resolved to use revenue reserves to supplement the income from the underlying portfolio in order to pay a dividend of 10.0p per share for the next three years, subject to market conditions at the time but assuming no increase in underlying portfolio income. In line with this intention, the first interim dividend for the current year of 2.50p per Ordinary share was paid on 10th October 2025. The Board has declared a second interim dividend of 2.50p per Ordinary share payable on 8 January 2026 to shareholders on the register on 12 December 2025, making a total for the half year of 5.0p per Ordinary share.
It is anticipated that the Company will maintain the level of dividend for the third and fourth quarter at
2.5p making a total core dividend declared of 10.00p for the year.
Portfolio
In the last 6 months we have repositioned our portfolio following the ZDP redemption at the end of April 2025. We increased investment in ten of our existing holdings (2024:16), B&M Europe, Chesnara, Conduit Re, Foresight Group Holdings, Gateley Plc, ITV, Polar Capital, Serica Energy, Vesuvius and Zigup.
During the period we also added nine new names to the portfolio (2024: 9). These were British Land Co – real estate investment and development; Bytes Technology Group – IT solutions and services; Hilton Food Group – meat and fish packaging; Hollywood Bowl – leisure; Man Group – investment manager; Next 15 Group – consultancy; Primary Health Properties – healthcare REIT; Taylor Wimpey – housebuilder; and Tristel – hospital disinfection products.
Funds were raised from the outright sale of two of our holdings Bakkavor Group and Epwin Group, both of which were the subject of takeovers.
The following holdings were reduced on yield grounds: Arbuthnot Banking Group, Coral Products, DSW Capital, Kier Group, LendInvest, M.P. Evans Group, One Health Group, Orchard Funding Group, Palace Capital, Personal Group, Ramsdens Holdings, Sancus Lending Group, Smiths News and Stelrad Group.
From a performance perspective there was no real theme to the biggest movers in the period, with our top contributors and detractors largely reflecting individual company circumstances. On the downside Hilton Foods suffered due to an operational issue at its Greek smoked salmon facility, which impacted exports into the US. STV Group suffered from a slowdown in demand for its Studios business and B&M Europe shares fell reflecting a weak trading update, followed by a second update highlighting increased freight costs. On the positive side Serica Energy shares rose over 70% in the period, reflecting accretive M&A activity alongside expectations of a more hospitable regulatory environment for UK North Sea assets. Johnson Matthey reacted well to the disposal of its Catalyst Technologies business at an attractive price, Polar Capital benefitted from strong asset performance leading to increased AuM and Chesnara shares re-rated along with the wider Life Insurance sector as interest rates fell.
Outlook
The past six months have been a volatile period as markets tried to absorb the combined impacts of US trade tariffs, differing trajectories of interest rate cuts across western economies and the ever-evolving effect of the adoption of new technologies. From a UK perspective, a level of political uncertainty rarely seen under a government with such a large majority is adding to the general sense of unease, not helped by the long wait for this year’s “Autumn” Budget. The result of this has been a collapse in both corporate and consumer confidence, delays in business investment and a historically high household savings ratio.
There has undoubtedly been a sense of pessimism amongst investors around UK domestic equities, and UK small and midcap stocks in particular, however it’s not all doom and gloom. The most significant hurdles for the UK economy over the past couple of years have been the intertwined issues of high interest rates and high inflation, both of which we believe are now set to start moving in the right direction.
The Budget has been calmly received, as much of it had already been leaked, and the bond markets have been reassured by the level of headroom created. Unfortunately, there were no initiatives for advancing development and growth which of course would help GDP growth, higher government revenue and a consequent reduction of deficit financing. Our companies will have to manage another significant rise in the minimum wage of 4.1% and even higher increases for younger people.
Inflation is set to fall over the next year as several one-off factors in 2025 fall out of the calculation (national living wage and national insurance increase, energy price rises etc), which should allow the Bank of England to continue its current path of interest rate cuts into next year. We have already seen mortgage rates fall significantly from their peak and banks remain incredibly well capitalised.
As we have commented before, the strength of UK corporate balance sheets is neatly evidence by the scale of buy-back activity currently being undertaken, while consumer balance sheets have been bolstered by wage increases and increased savings. This means the raw material for growth is readily available, what is lacking is the confidence to deploy it.
As we look past the recent budget, a more stable economic environment combined with reducing interest rates and strong corporate balance sheets has the potential to be a powerful combination both for the UK economy at large and UK small and midcap equities.
In the meantime, we continue to be impressed by the resilience of cash flows within our underlying portfolio and the adaptability of our investee companies to the difficult macro environment. Dividend payments remain strong and we are confident that our management teams are positioning businesses to benefit from an uptick in demand when it happens.
Chelverton Asset Management Limited
4 December 2025
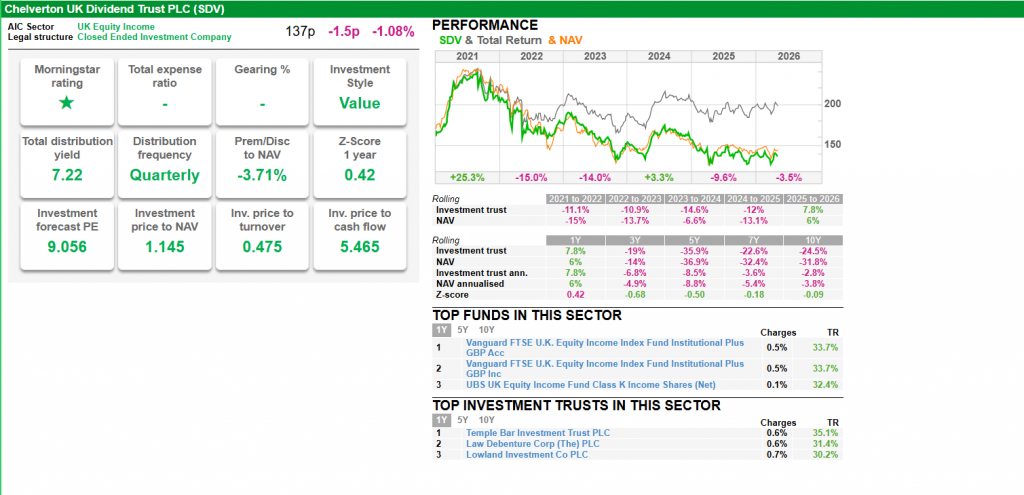
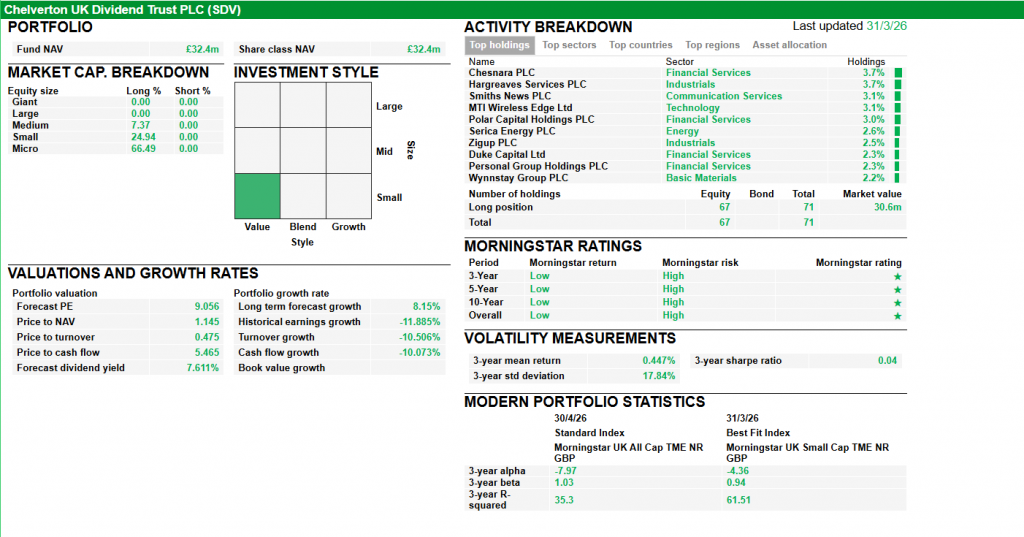
The SNOWBALL has avoided owning SDV as there ZDP’s had first call on any cash in a market crash. Having redeemed the ZDP’s they fill several requirements to be included in the SNOWBALL.
Bull Case
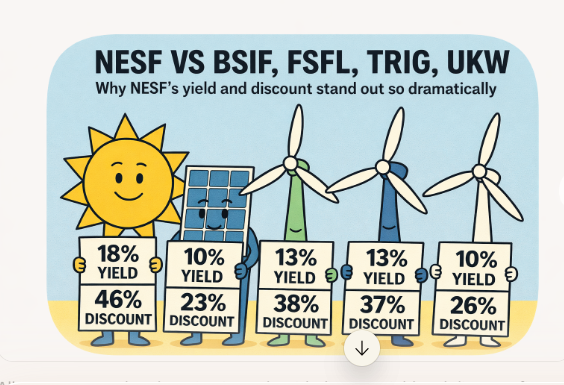
A yield of 7.5%, fcast dividend for the next couple of years, investing in Smaller Companies, where research shows they outperform as Elephants can’t run. Diversification away from Renewables whilst maintaining a higher dividend yield.
Bear Case
Trades at a small discount to NAV
From the commentary inflation is not going to fall but rise
(This article was released on YouTube on May 4th, May the fifth be with you who didn’t tune in)
Bought BSIF Bluefield Solar at 68.2p and May 1st sold at 83.8p. Thanks for being man’s best friend, Bluey.
But it’s time to give you the shoe-y Bluey. Bwooah! May the fourth is not with you Bluey, sorry. Don’t write in or call the RSPCA, no actual dogs were harmed in the making of this article. Not even in a galaxy, far, far, away.
And you can thank Ed Milli for the boot, Bluey. That tinker.
Tinkering with contractual agreements. A deal’s a deal. But not for Milli. The UK government who were elected on a mandate of GROWTH. Deal breaking is a terrible way to support deal making. Ah well. Its supporters will be happy and broad shoulders can bear the burden. Will renewables investors nursing heavy capital losses now bear new income losses too? Exactly. It’s true that voters were promised lower bills due to green energy? Short term – that’s what they’ll get.
But it makes UK renewables uninvestable in my opinion, due to Milli’s measures taken to reduce bills:
Hiked the Electricity Generator Levy to 55% on revenues above £82/MWh. While oil and gas giants get “investment allowances” to offset their windfall taxes, perversely renewable generators have been hammered with a high headline rate that doesn’t offer the same generous loopholes for reinvestment as fossil fuels.
Milli is “strongly encouraging” legacy renewable generators to move off their lucrative old market-linked contracts and onto fixed-price Contracts for Difference (CfD). It’s being framed as a “voluntary” move to de-link from gas and electricity prices, but the subtext is clear: renewables generators who don’t “volunteer” may face even harsher tax treatment or grid-access deprioritisation. It’s effectively a retrospective raid on the profits of projects built a decade ago.
In an embarrassing admission in April 2026, Ofgem and the government admitted they’ve “over-allocated” grid capacity to battery storage, leading to a regulatory freeze. New rules are being fast-tracked to limit or cancel new battery projects unless they already have revenue support. After telling the industry that storage was the “backbone” of the transition, they are now pulling the rug out from under developers who spent millions on planning and land rights, claiming the system is “overwhelmed.”
Blunders and resets. The newly formed NESO (National Energy System Operator) has been forced to “reset” timelines, effectively telling shovel-ready solar and wind farms to get back in line because the previous administration’s “zombie projects” (projects that exist only on paper) weren’t cleared out properly.
What else does he plan to do too?
Good luck to readers continuing to invest and tempted in this area (I’m sure I’ll get some robust rebuttals on this and some harrumphing) but I’ve decided it’s not for me.
Could the sale of BSIF still yield upside? Yes of course, and it’s got an attractive yield. Or had. Could it be harder to sell the portfolio to a new buyer given Milli’s tinkering? I think so. How can international investors invest into the UK when the rules are akin to those of a Banana Republic. I’m happy to take the 22.9% gain.
Current yield 10.6% so still a hold but maybe time for re-investing the dividends outside of Renewables.
I’ve always wondered if you can improve your Snowball by dividend washing, where you buy a share just before it’s xd date and sell just after.
With most shares the price is marked down by the dividend or more but sometimes it’s not.
The market could dump on u if you before too early before the xd date.
You are liable to lose some capital on the transaction, although if you are lucky, you could earn the dividend and make a capital gain. The aim of the SNOWBALL is to increase the yearly income buy buying shares and re-investing the dividends, whilst retaining the capital and slowly increasing the seed capital invested. As the intention is never to kill the golden goose by selling any golden eggs, it’s not the primary aim of the SNOWBALL
I have sold £200 of TRIG, after allowing for costs at break even, as I needed the funds to buy 1k of GCP, ahead of their xd date this week.
Dealing costs of buying 1320 shares in GCP, including the spread £15.28.
The SNOWBALL has 5k of shares in GCP, so I intend to use this position to do some dividend washing.
The parameters is too restrict the loss of capital to £500 and to re-invest the dividends back into the SNOWBALL. A by product of any dividend washing it makes it easier to achieve this year’s fcast.
If you now jump forward ten years, if the earned dividends are £500 and re-invested at 7%, the income will be 1k per year for the rest of your Snowball, against the loss of capital and the income from any capital loss
The biggest danger to the plan is if you buy a clunker, so the plan is not too hold the new position for very long. The amount for dividend washing may be increased to 10k, subject to the outcome of the first few trades.
The earned dividend for GCP will be £118.00
Only a concept at this stage, as more pondering needs to happen.
Artemis UK Future Leaders PLC ex-dividend date Chenavari Toro Income Fund ltd ex-dividend date CT Healthcare Trust PLC ex-dividend date CVC Income & Growth EURO Ltd ex-dividend date CVC Income & Growth GBP Ltd ex-dividend date Dunedin Income Growth Investment Trust PLC ex-dividend date GCP Asset Backed Income Fund Ltd ex-dividend date GCP Infrastructure Investments Ltd ex-dividend date Marwyn Value Investors Ltd ex-dividend date North American Income Trust PLC ex-dividend date Picton Property Income Ltd ex-dividend date Supermarket Income REIT PLC ex-dividend date
If you buy SUPR before Thursday, you will receive 5 dividends in just over a calendar year. The current dividend 1.545p equates to a yield of 7.25%.
The enhanced yield equates to a yield of around 9%.
If interest rates rise, as fcasted, the price may fall but you could use that as an opportunity to re-invest your dividends back into the share, buying more shares and earning more dividends, as you wait for interest rates to start falling again.
10% Dividends (at a 10% Discount) From This “Hated” Stock Rally
Michael Foster, Investment Strategist Updated: May 4, 2026
This has got to be the most “hidden” (maybe hated?) stock-market run I’ve ever seen.
The headlines are all doom and gloom (I think you’ll agree), but behind it all, the stock market is on a roll—returning 31% in just the last year. That’s more than triple the market’s long-term average yearly return of around 10%.
Where does that leave those of us who look to stocks for growth and income? Is there more runway ahead, or is it too late to buy in?
In my opinion, this 31% gain is setting the table for more, and we’ll get into exactly why in a moment. The setup we’ll break down is doubly attractive for investors in closed-end funds (CEFs), where we can get a discount on what we’d pay if we bought stocks through an ETF or directly on the market.
9%+ Yielding CEFs Give Us a Discount No Matter What the Market Is Doing
Our discount opportunity on CEFs exists in part because the CEF market is tiny, containing only about 400 funds. And CEF buyers tend to be individual, conservative investors.
That second point is key because these investors buy and sell predictably—and they always leave a “discount window” open for us somewhere. Plus, with CEFs, we can forget about the 1% dividend your typical index fund pays. CEFs often yield 9% and more, which means we’re getting the bulk of our return in cash.
I bring CEFs up now because I want to take on today’s stock-market setup—and our plan to buy into it—in two tracks.
First, we’re going to look at why this stock-market run is justified and not at all a bubble. Simply put, this means that a 31% gain in the rearview does not preclude a similar rise looking ahead.
For the second track, we’re going to move from the general to the specific, with a CEF seemingly purpose built to get us into this rise at a discount and a 10.3% dividend, too.
Track 1: An Economy Rolling Through Gloom
Before we go further, I know my bullishness on the economy might seem a little out of step right now, with the Strait of Hormuz closed, cutting off vital resources like oil and fertilizer; rising fear of job losses; and consumer sentiment that hit record lows in April.
Let me counter that gloomy narrative by starting where we always need to start when we’re talking about stocks: earnings.
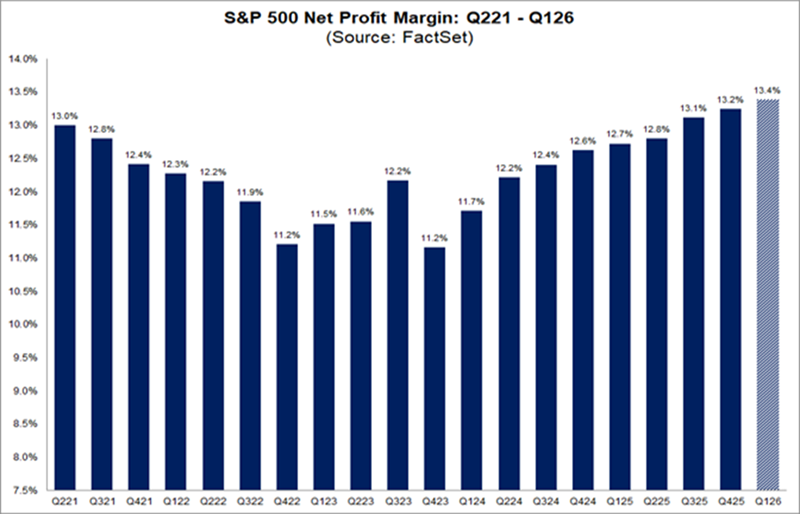
And thanks in large part to tech breakthroughs (AI, in other words) productivity is jumping, and those gains are showing up in strong corporate earnings growth. As of the end of 2025, profit margins had hit levels unseen in years, with more gains forecast:
Source: FactSet
And contrary to popular opinion, these productivity—and profit—gains are not coming at the expense of jobs. As I discussed last week, we’re starting to see data telling us that AI is, in fact, creating jobs. Over time, the resulting employment gains are likely to create opportunities for workers and companies to earn and spend, unlocking even more value from the stock market.
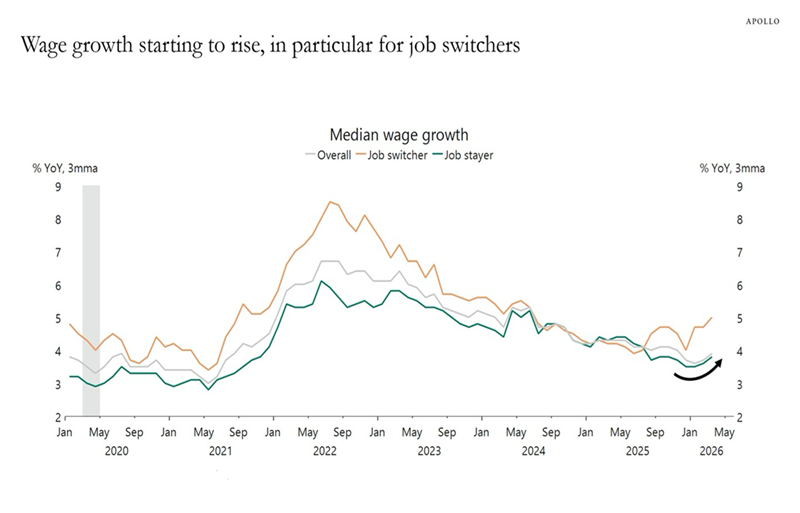
Here’s another report that backs this up (and pushes back on the whole “AI job apocalypse” narrative):
Source: Apollo Global Management
The chart above tells us a specific story: Workers moving from one job to another are likely to see their income rise—and significantly. This shows that companies are putting more emphasis on hiring, and are willing to pay for top talent. That’s another clear sign of a strong US economy.
Track 2: Our Bargain “Backdoor” On This Market Run
With all that said, it’s still easy to feel as if we’ve missed the bulk of the market’s upside. But with profits growing, and more money flowing through the economy, more gains are likely. And with a discounted CEF, as mentioned, we can do even better.
That’s because with CEFs we’re getting most of our return in cash, and we’re getting these funds for less than their portfolios are worth.
Consider a CEF called the Liberty All-Star Equity Fund (USA).
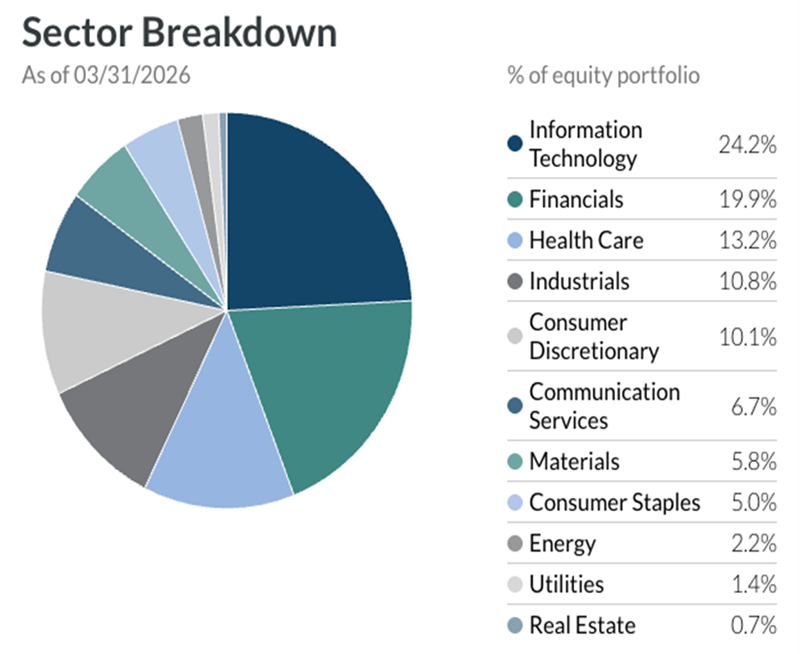
With a 10.3% yield, this fund pays nearly 10X what the average S&P 500 index fund does, while its large-cap focus means we get access to many of the same stocks: NVIDIA (NVDA), Microsoft (MSFT), Alphabet (GOOGL), Amazon.com (AMZN), Visa (V) and Charles Schwab (SCHW) are all main holdings, and USA is diversified in a way similar to the S&P 500 itself:
Source: Liberty All-Star Funds
USA takes the returns on these holdings and “converts” them into an income stream for us. It manages that 10.3% payout by linking the dividend to net asset value (NAV, or the value of the fund’s underlying portfolio) and committing to paying out roughly 8% of NAV as dividends every year, in four quarterly installments of 2%.
That does mean the payout floats a bit, but we’re okay with that, since this 8% “NAV peg” has resulted in a payout that’s been pretty consistent over the last three years:
USA Delivers Steady Dividends in Choppy Markets Source: Income Calendar
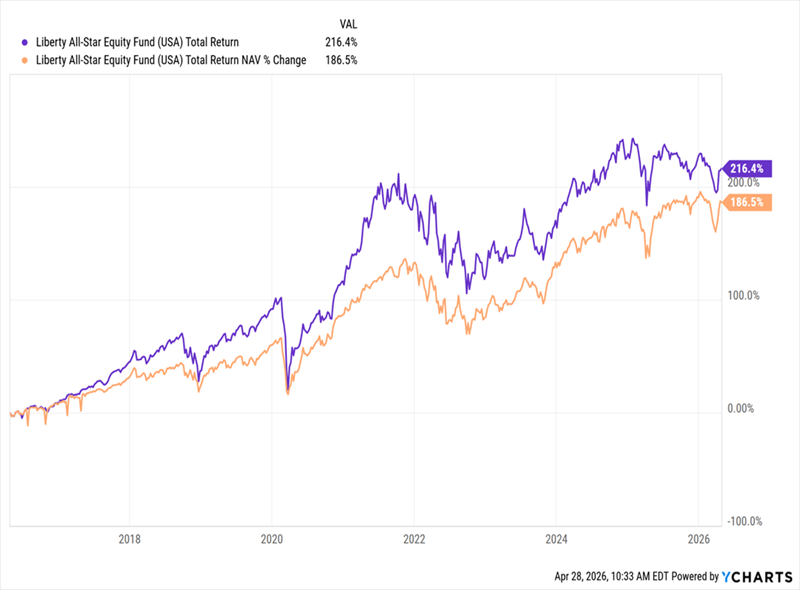
Moreover, the fund’s strong returns over the last decade—216% on a market-price basis (in purple below) and 187% based on NAV (in orange)—have been more than enough to keep USA’s payout rolling out at a high rate. With the economy’s strong (and improving) prospects, I see that continuing:
USA’s Market Price (and Portfolio) Deliver
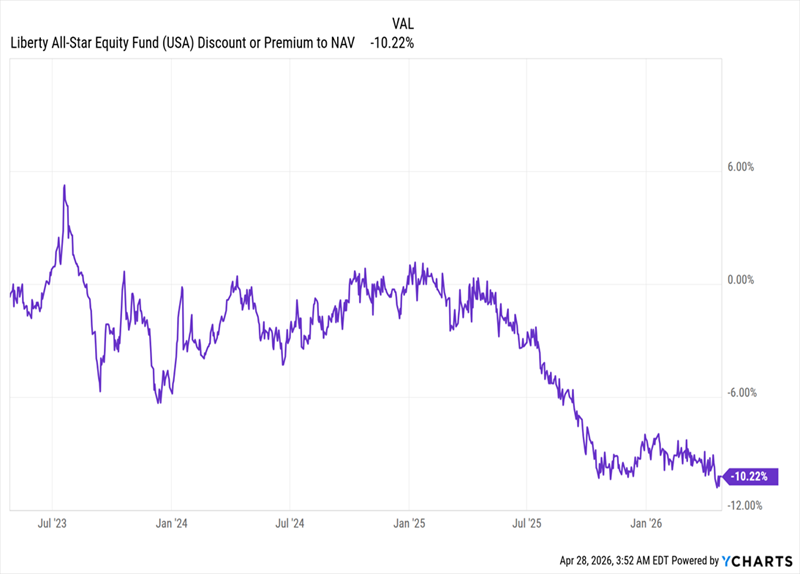
That gap between the fund’s own performance and that of its portfolio is unique to CEFs. As you can see at right in the chart above, it’s narrowed lately, setting up the discount opportunity you can see in the chart below:
USA’s Discount Hits COVID-Era Lows
USA now trades at a 10% discount to net asset value (NAV, or the value of its underlying portfolio). That’s far below its 4.2% long-term average and the lowest it’s been since the dark days of COVID. It’s also far too large of a markdown for a large-cap fund that’s performing (and maintaining high dividends) as well as this one is.
Moreover, any gains in the stocks USA holds are likely to compound as the fund’s discount narrows over time.
This leaves us with a fund sporting a big yield, strong performance and a discount unseen since COVID. And that deal comes at a time when the economy is strong and growing. It’s a situation that clearly shows why CEFs are our first stop when we’re hunting for value, no matter what the rest of the market is doing.
These 5 Overlooked Funds Pay Dividends 60 Times a Year, Yield 9.7%
USA’s “floating” dividend is actually unusual among CEFs. Many pay monthly, in fixed, predictable amounts.
Investors in “regular” stocks and ETFs almost never get that luxury!
Nothing in Contrarian Outlook is intended to be investment advice, nor does it represent the opinion of, counsel from, or recommendations by BNK Invest Inc. or any of its affiliates, subsidiaries or partners. None of the information contained herein constitutes a recommendation that any particular security, portfolio, transaction, or investment strategy is suitable for any specific person. All viewers agree that under no circumstances will BNK Invest, Inc,. its subsidiaries, partners, officers, employees, affiliates, or agents be held liable for any loss or damage caused by your reliance on information obtained.