Brave investors have beaten beat doom-mongers this year
Opinion by Hamish Mcrae
We’re halfway through the year, and my word it’s been a bumpy ride for investors.
If you had known on January 1 there would be a war in the Middle East, with the Strait of Hormuz closed and the oil price going to well over $100 a barrel, what would you have expected to happen to US share prices?

And had you known that Keir Starmer and Rachel Reeves would be on the way out, what would you have thought would happen to markets here?
You would surely have reckoned this all looked a bit hairy and decided it was time to de-risk your portfolio. You would sell some shares and switch to cash or something safe such as government bonds. And you would have been completely wrong.
The S&P500 index, the best measure of US equities, is up 9 per cent to date, while the FTSE 100 index is up 7 per cent. Allowing for dividends it would have returned more than 8 per cent.
Government bonds, by contrast, have been disappointing. US ten-year Treasury notes yielded 4.2 per cent in January and are at 4.5 per cent. The yield on ten-year gilts – UK Government bonds – has risen from 4.5 to 4.8 per cent.

Bumpy ride: We’re halfway through the year, and my word it’s been a bumpy ride for investors
Prices move inversely to yields and on my quick tally, allowing for the interest you’d receive, you would be down between 1 and 2 per cent on your investment.
What’s the explanation? What’s the message for the second half of the year, and what does this say about investing more generally
The simple explanation of what has happened to bond prices is to note that wars cost money in all sorts of ways and push up inflation, so investors want a bigger premium to lend to government.
For equities it is more complicated, as the UK and US are very different. American shares offer both the hope of technology-driven growth and solid profits for established corporations.
British-quoted companies also offer profit growth, but the key feature is that our market, by contrast, is a bargain basement.
The message for the second half is generally positive. The professionals in New York are bullish, with Morgan Stanley and Goldman Sachs both looking for the S&P500 to rise from 7,500 at present to 8,000 by year-end.*
In London there is more caution, for example with UBS suggesting that the FTSE 100 could go to 11,000 this year, up from today’s 10,679, but not far above the peak in February just before the Middle East war of 10,935.
Insofar as it is sensible to generalise, the big fund managers and investment advisers do not seem to rate the possibility of a share crash this year as very high. The overall view is that we are in a mature bull market for equities, but the forces that will cause it to end are not yet in place.
And investment more generally? Last week we had the latest annual Global Wealth Report from UBS, which assessed how global wealth had grown in 2025.
Among the headlines were that stock market gains last year created nearly a million more dollar millionaires. Also that global personal wealth rose nearly 11 per cent. And that Australia now ranks third-highest for median wealth.
As well as, more dismally, that allowing for inflation Britain had the sharpest fall in wealth of any country in the survey.
That’s because for most of us our homes are our biggest investment and since 2020 house prices have failed to keep pace with inflation.
Unpicking all this, the message I take away is that the enemy of people who want to try to build wealth, or even become comfortable enough not to have to worry about money, is indeed inflation.
It is not crashes in share prices, though they will inevitably come, for eventually global equities will produce positive real returns.
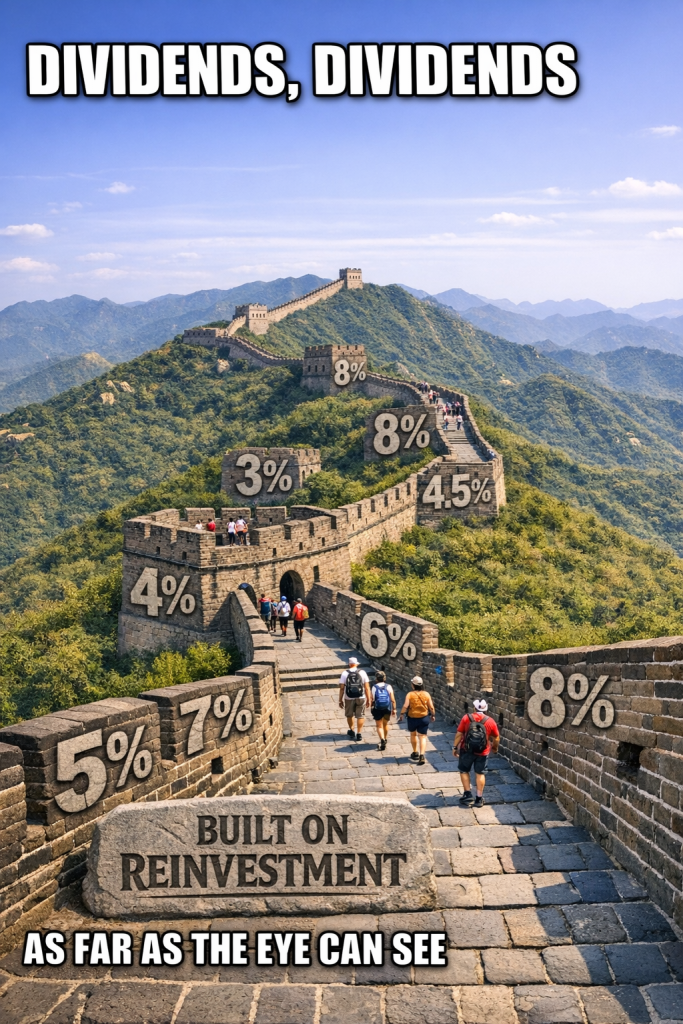
As long as people start saving as early as they can, keep adding to their pot and keep reinvesting the proceeds, compound interest will enable them to build real wealth – not to become billionaires but to be ‘the millionaire next door’.
But there’s another enemy. Governments not only permit inflation, they tax away paper gains even though these are only compensating for inflation and not real gains at all.
* Historically the S&P moves higher after the American Mid Elections.