
I’ve sold the recent purchase in
SUPR for a profit of £43.00 after all costs including the earned dividend and
GCP for a profit of £57.00 after all costs including the earned dividend.

Investment Trust Dividends
I’ve sold the recent purchase in
SUPR for a profit of £43.00 after all costs including the earned dividend and
GCP for a profit of £57.00 after all costs including the earned dividend.

The updated income fcast for the SNOWBALL at the half year point is £7,912.00. Although this is well ahead of the current plan do not scale to reach a year end figure as it contains special dividends.

It means the updated year end target should be met.

NextEnergy Solar Fund Limited
Fourth Interim Dividend Declaration
NextEnergy Solar Fund, a leading specialist investor in solar energy and energy storage, is pleased to announce its fourth interim dividend of 2.11p per Ordinary Share for the quarter ended 31 March 2026, in line with its previously
stated target of paying dividends of 8.43p for the year ended 31 March 2026.
The fourth interim dividend of 2.11p per Ordinary Share will be paid on 30 June 2026 to Ordinary Shareholders on the register as at the close of business on 15 May 2026. The ex-dividend date is 14 May 2026.
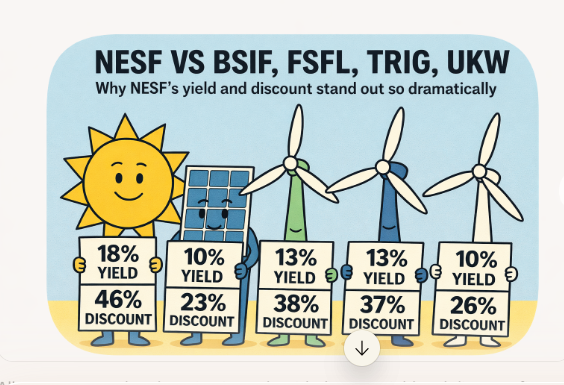
Note the dividend fcast for the year ending 31 March 2027 has been reduced to 4p. A current yield around 9%.
New focus on total returns
Following its strategic review, NextEnergy Solar Fund’s (NESF’s) board plans to refocus on delivering both income and capital growth, aiming for long-term total returns of 9%-11%. This year’s dividend target of 8.43p will be met, but future dividends will be set at 75% of operating free cashflows after debt and expenses. For the year ending 31 March 2027 (FY27), the estimated dividend range is 4.0p-4.6p.


Octopus Renewables Infrastructure Trust plc
Q1 2026 Factsheet and Net Asset Value
Octopus Renewables Infrastructure Trust plc, the diversified renewables infrastructure company, announces that its unaudited Net Asset Value (“NAV”) as at 31 March 2026, on a cum-income basis, was £491.5 million or 93.15 pence per Ordinary Share (31 December 2025: £494.8 million or 93.79 pence per Ordinary Share). This reflects a positive NAV total return of 1% over the quarter.
| Pence per Ordinary Share* | £m | ||
| Unaudited NAV as at 31 December 2025 | 93.79 | 494.8 | |
| Market price assumptions | 0.16 | 0.8 | |
| Macroeconomic assumptions | (0.35) | (1.9) | |
| Q4 2025 interim dividend | (1.55) | (8.2) | |
| Other movements | 1.13 | 5.9 | |
| Unaudited NAV as at 31 March 2026 | 93.15 | 491.5 | |
* Totals may not sum exactly due to rounding
Market price assumptions
Updates to market price assumptions increased NAV by a net £0.8 million, equivalent to 0.16 pence per Ordinary Share, during the quarter.
The majority of this valuation uplift arose from an increase in short-term power prices, reflecting market movements towards the end of Q1, driven by geopolitical developments in the Middle East which impacted global gas markets and increased uncertainty around LNG (Liquefied Natural Gas) supply. However, this was partially offset by modest reductions in medium to long-term power price forecasts. Changes in green certificate and capacity market assumptions were immaterial.
The limited impact of short-term volatility on this quarter’s valuation is supported by the Company’s high proportion of fixed and contracted revenues (86% over the two-year period to 31 March 2028). In addition, to avoid artificial movements driven by short-term price volatility a five-week average to 31 March 2026 is used in the valuation.
Subsequent to the period end, the UK Government announced the removal of Carbon Price Support, effective April 2028. Based on initial analysis using external advisor inputs, the estimated impact on NAV is less than 0.5 pence per Ordinary Share. As a post-period event, this impact will be reflected in the Q2 2026 NAV. The Company also notes the broader package of UK energy policy measures announced on 21 April 2026, which are not currently expected to have a material impact on valuation.
Macroeconomic assumptions
Changes to macroeconomic assumptions had a net negative impact on NAV in the quarter, decreasing valuation by £1.9 million or 0.35 pence per Ordinary Share.
This was largely driven by an increase in the level of French local infrastructure tax (“IFER”) applicable to the Company’s solar portfolio. Updates to inflation, interest rate and foreign exchange assumptions together broadly offset each other, culminating in a neutral impact overall.
Other movements
A net increase of £5.9 million or 1.13 pence per Ordinary Share was recorded from other valuation movements.
This includes a c. £10 million uplift relating to the expected return on the assets, reflecting the net present value of future cash flows being brought forward over the period. This was offset by plc costs and interest on debt facilities at the holding company level totalling c. £4 million.


I’ve recently been buying shares in a listed infrastructure investment trust called International Public Partnerships or INPP. In simple terms, this is the kind of steady, inflation-linked infrastructure money-making machine that shouldn’t be sitting on a chunky discount, especially now it’s added Sizewell C to the mix. INPP is meant to be the calm corner of the market: long-dated contracts, mostly government or regulated revenues, and a dividend that edges up year after year.
David Stevenson
That doesn’t mean the fund is boring and does nothing. Quite the contrary, in fact – as the recent full-year numbers showed, last year was actually very busy, even hectic. Despite this, the shares still trade at a mid-to-high-teens discount to NAV. The trust produced a 10.6% NAV total return (including dividends), one of its best years since launch back in 2006, while also running a pretty active playbook: selling mature assets at (or above) book value, buying back shares, and committing serious money to Sizewell C under the Regulated Asset Base model.
Fund details
· Share price: 128p
· NAV 153p with net assets £2.76bn
· Yield 6.7%
· 10-year NAV return 96%
· Discount 17% (average 18%)
Impressive 2025 numbers
Here’s a quick summary of the 2025 numbers, using City analysts’ commentary to flesh out the narrative. NAV per share ended 2025 at 151.5p (up 4.7% over the year), and once you add dividends, you get a 10.6% NAV total return.
JP Morgan (Overweight) had pencilled in 151.0p, so it’s a small beat rather than a shocker, but they still nudged up their live NAV estimate and slightly raised their steady-state return assumption. Analysts at Jefferies called it steady progress on NAV and dividends, but also flagged how much of the story is now about capital rotation and the gradual drawdown into investing in Sizewell C. Panmure Liberum went further, basically saying: this is a standout year, and INPP sits in that rare sweet spot of high income plus inflation linkage plus long visibility.
At the portfolio level, the assets delivered about a 10.2% return – roughly 120 basis points above the weighted average discount rate INPP started the year with. In plain English, the underlying projects performed better than the valuation model already assumed. A bit of macro helped too: higher short-term inflation assumptions added around 2.6% to the value, and foreign exchange chipped in roughly 0.5%. Higher risk-free rates were a small drag, but not enough to have a big impact.
In terms of portfolio positions, one success was BeNEX (German regional rail), with fair value up 35.1% after a run of concession wins and renewals; it now operates across 14 of Germany’s 16 federal states, covering about 67 million train kilometres a year. Tideway (the Thames “super sewer”), which is INPP’s single biggest asset at about 15.8% of the portfolio, added 7.6% as it moved through late-stage commissioning; JP Morgan notes that by March 2026, it had already diverted more than 19 million tonnes of sewage from the Thames. Cadent (gas distribution, c15.6% of value) dipped modestly (about -0.9%), mainly around regulatory updates; the RIIO-3 Final Determination was better than the draft, and there’s a CMA appeal in motion that isn’t yet being counted as upside in the valuation.
Here’s a simple snapshot of the major holdings.
Sizewell C is the headline change to INPP’s story. Financial close landed in November 2025, with INPP committing £254m of equity, drip-fed at roughly £50m a year over five years (with the first £35m going in during Q4 2025). What makes it different is the structure: it’s under the Regulated Asset Base (RAB) model, so INPP earns a fixed regulated equity return of 10.8% in real terms from day one. The cash yield is expected to be around 6%, and once you add CPIH inflation, the manager talks about a low-teens IR
Analysts also like that this isn’t a “blank cheque” construction bet. The construction-weighted average cost of capital (WACC) is fixed at 6.7% for the entire pre-completion period, with no regulatory resets. And there’s a Government Support Package designed to stop costs spiralling onto investors: if things breach certain thresholds, INPP isn’t forced to commit more than the original amount, and there’s a discontinuation compensation mechanism in really ugly scenarios. Panmure Liberum highlights the manager’s view that even then, returns should still come out north of 9%.
The bigger point is what Sizewell C does to the trust’s shape. Mature PPP assets tend to amortise i.e they generate cash, but the asset base gradually declines. Sizewell C is the opposite — the RAB compounds as equity are deployed, so NAV can keep building into the 2030s. Panmure Liberum reckons the deal adds roughly 0.3 percentage points to portfolio returns, nudges up the inflation linkage, and extends the portfolio’s dividend-supportable life from around 20 years to more than 25. JP Morgan’s take is similar: the incremental returns look better than simply buying back shares, even if the project risk is obviously higher.
The portfolio asset valuations are credible
One reason brokers sound comfortable about INPP’s NAV is that it has been selling assets in the real world at (or above) the values shown in the accounts. In 2025, it sold about £130m of assets at or above carrying value, taking disposals since June 2023 to more than £385m — roughly 14% of the portfolio. The highlights: a 49% minority stake in the Moray East offshore transmission link sold to Daiwa for about £40m; minority stakes in a bundle of UK education PPPs; and a partial stake sale in Angel Trains for roughly £32m. Jefferies and JPMorgan both point to this as “transaction evidence” supporting the valuation marks across the book.
At the same time, INPP has committed more than £345m to new investments (including Sizewell C) and has spent money on buybacks, even as the discount remains wide. The buyback programme was expanded to £225m (authorised to run to March 2027). By the time of the results, more than £135m had been completed, which management says has added roughly 1.6p to NAV per share. JP Morgan estimates there’s roughly £90m still available — around 4% of the market cap — which should provide some ongoing support for the share price
INPP hit its 2025 dividend target of 8.58p per share and covered it 1.1x by portfolio cash flows. It’s also sticking with the familiar 2.5% annual growth pattern: targets are 8.79p for 2026 and 9.01p for 2027. The line that keeps popping up in broker notes is the time horizon: management says it can keep paying progressive dividends at that pace for at least 25 years, even if it doesn’t do another deal. For income investors, that kind of visibility is the whole sales pitch.
My bottom line?
Ok, so let’s put this all together. The fund is selling assets at or above NAV. Dividends are steadily rising. The life expectancy of the asset base has also increased. Most revenues are government-backed or regulated.
Yet the shares trade at a persistent mid-to-high-teens discount, whereas for the first decade or so the fund traded at a persistent premium. Brokers suggest a few potential catalysts that could unlock value: continued buybacks; more evidence of disposals; investors becoming comfortable that Sizewell C really does add duration and compounding.
Panmure Liberum also reckon there’s a policy angle: they say it’s a bit odd that listed vehicles like this can provide daily-priced access to strategic UK infrastructure yet still get left out of some pension reform thinking. Strip it back, though, and the argument is straightforward: if you believe in inflation-linked cash flows, long dividend visibility, and a manager who can recycle capital sensibly, the current discount looks hard to sustain forever.
With the stock around 127p versus a NAV in the low-150s pence, you’re looking at roughly a 17% discount. Panmure Liberum pegs the prospective net total return at about 10% a year, made up of a yield of a bit over 7% plus dividend growth of 2.5%, and emphasises that about 98% of revenue is either government-backed or regulated. When 30-year gilts are in the mid-5% range, that spread starts to look pretty attractive.


| QD INSIGHTS & OPINION |
| Matthew Read on Foresight Solar: “Weaker operational performance was offset by higher inflation, resilient power prices and buybacks – none of which was particularly surprising. However, the curtailment issues in Spain merit closer attention, as they highlight the consequences of having too much renewable generation capacity without sufficient storage to absorb excess supply. As more renewable capacity comes online, this imbalance is likely to become increasingly common. Capturing and redeploying surplus power when demand is higher offers clear economic and environmental benefits, reinforcing the case for continued investment in both BESS assets and broader grid infrastructure. We also think the changes to power price assumptions deserve closer scrutiny. While it is no surprise that the conflict with Iran has lifted power prices in the near term, independent forecasters now expect elevated prices to persist through 2028. This could extend further if tensions escalate or the conflict drags on, suggesting the risks remain skewed to the upside for renewable generators such as Foresight Solar. Against this backdrop, it is unsurprising that inflation expectations have also risen in the near term, and further disruption could easily result in higher inflation for longer, providing additional support to renewable funds’ NAVs at the margin.” |

Current yield 10.8% Discount to NAV 34.32%

Technology and emerging markets trusts bounced back strongly in April after the previous month’s setback caused by the conflict in the Middle East, but private equity and infrastructure funds dominate our list of fallers.
Our two tables show the total returns, or losses, shareholders made from the 15 biggest risers and fallers in April. They also display the underlying movement in net asset value (NAV) during the month, if there was one, and to what extent that left the shares trading at a premium above the value of their investments, or at a discount below.
| Investment company | Total shareholder return % | Net asset value (NAV) total return | Premium (- discount) % |
| Seraphim Space | 34.3 | 0.0 | 41.6 |
| Manchester & London | 26.3 | 23.2 | -24 |
| Polar Capital Technology | 25.6 | 25.1 | -8.6 |
| Molten Ventures | 22.3 | 0.0 | -26.3 |
| EPE Special Opportunities | 21.2 | 0.0 | -47.2 |
| Allianz Technology Trust | 20.9 | 20.1 | -8.4 |
| Golden Prospect Precious Metals | 20.4 | 1.6 | -9.5 |
| Pacific Horizon | 18.9 | 17.8 | -9 |
| Fidelity Emerging Markets | 18.8 | 17.9 | -8.2 |
| Scottish Mortgage | 18.4 | 4.7 | 2.4 |
| Aberdeen Asia Focus | 18.1 | 14.9 | 7.3 |
| JPMorgan Global Core Real Assets | 17.8 | 0.0 | -8.7 |
| Herald | 16.6 | 17.3 | -11 |
| Templeton Emerging Markets | 15.5 | 15.3 | -8 |
| Parvus Energy Efficiency Trust | 14.8 | 0.0 | -40.1 |
Source: QuotedData 3/4/26

For expert commentary, catch up with our “In The Hot Seat” show last Friday when Andrew McHattie gave his monthly analysis on the main movers in the previous four weeks.
While Seraphim Space (SSIT) rebounded 34% ahead of its announcement of a £350m C-share issue, McHattie focused his attention on the 20.9% to 26.3% advance in the three generalist technology trusts from Allianz (ATT), Polar Capital (PCT) and Manchester & London (MNL)
Noting how “special situation” MNL stood on a wider share price discount than the 8% of the other two, McHattie said all three had proven to be “great long-term buy and hold investments”, but added that investors needed to assess “whether the excitement about AI [artificial intelligence] might be overblown in the near term. I do think that’s a distinct possibility,” he said.
The publisher of the McHattie investment trust newsletter highlighted the strong 18%-19% returns of Pacific Horizon (PHI) and Aberdeen Asia Focus (AAS) which hold big positions in semi-conductor stocks and other companies in the AI supply chain.
He said this was a “handy reminder there are different ways to stay engaged with the AI rally if valuations start to shift”, saying, “you don’t necessarily have to buy those technology trusts investing directly in the US, you can play it through Asia as well”.

| Investment company | Total shareholder return % | Net asset value (NAV) total return | Premium (- discount) % |
| Home REIT | -74.0 | – | -55.5 |
| Aquila European Renewables | -25.6 | -1.2 | -59.8 |
| Riverstone Energy | -23.7 | 0.0 | -53.6 |
| Abrdn European Logistics Income | -15.9 | 0.0 | -20.7 |
| Digital 9 Infrastructure | -13.4 | 0.0 | -52.7 |
| Symphony International Holdings | -8.6 | -3.0 | -50.5 |
| Tetragon Financial Group $ | -7.5 | -2.9 | – |
| DP Aircraft I | -6.0 | -3.0 | -20.2 |
| Partners Group Private Equity | -5.5 | -1.2 | -33.5 |
| Ecofin US Renewables Infrastructure | -4.5 | -3.0 | -53.9 |
| HgCapital Trust | -4.4 | 0.0 | -33.8 |
| Riverstone Credit Opportunities Income | -4.1 | -3.0 | -16.9 |
| US Solar Fund | -3.6 | -3.0 | -53.7 |
| CT UK High Income Trust | -3.6 | -3.0 | -9.8 |
| JZ Capital Partners | -2.9 | 0.0 | -45.6 |
Source: QuotedData 30/4/26
Last month also saw the return of Home REIT (HOME), losing three quarters of its value after an “extraordinary period of more than three years of suspension”, which McHattie said was “extremely frustrating” for shareholders but at least now they could sell out of the scandal-hit fund.
Having cash sitting in the SNOWBALL not earning is not a good strategy, unless markets are crashing, which they aren’t at the moment.
I’ve bought 6563 shares in SUPR, ahead of the xd date tomorrow for 5.5k.
The market is currently a

But in time, will it rollover into a

25/03/26
Foresight Solar Fund Limited
Trading Update, Q1 2026 Net Asset Value
Foresight Solar, the fund investing in solar and battery storage assets to build income and growth, announces its unaudited net asset value (NAV) was £543.0 million at 31 March 2026 (31 December 2025: £545.9 million). This results in a NAV per Ordinary Share of 99.2 pence (31 December 2025: 99.2 pence).
Summary of key changes to NAV
| Item | p/share movement |
| NAV on 31 December 2025 | 99.2 |
| Interim dividends paid | -2.0p |
| Time value | +1.9p |
| Project actuals | -0.3p |
| Power price forecasts | +0.1p |
| Inflation assumptions | +0.4p |
| Share buyback programme | +0.2p |
| Other movements | -0.3p |
| NAV on 31 March 2026 | 99.2p |
Lower-than-expected irradiation in the UK in January and February led to below-budget electricity generation. However, better weather in March improved production, and the associated revenues will be recognised after the period end due to the timing of cash receipts. Curtailment in Spain also weighed on output. Taken together, these factors reduced NAV by 0.3 pence per share (pps).
Power prices increased during the period, reflecting the impact of the conflict in the Middle East. Updated forecasts from independent consultants captured these changes, with higher price expectations in the UK to 2028. In Spain, the record hydro availability and the high share of renewables in the energy mix led to lower short-term price forecasts. Overall, these movements contributed 0.1pps.
Short-term inflation assumptions also moved higher, with RPI and CPI now expected to be 4.0% and 3.0% for 2026, respectively. This resulted in a positive NAV impact of 0.4 pence per share. Longer-term assumptions remain unchanged: RPI is forecast at 3% between 2027 and 2030 and 2.25% from 2031, while CPI is expected to be 2.5% between 2027 and 2030, easing to 2.25% from 2031.
The Company continued to buy back its shares, adding 0.2pps to NAV in the first quarter of 2026. Approximately £55 million of the £60 million programme has been deployed, delivering a cumulative NAV uplift of 3.3pps since repurchases began.
Other movements, including foreign exchange, power price hedges and minor portfolio adjustments, resulted in a net negative impact of 0.3pps.
Policy changes
The investment manager reiterates its expectation that the removal of the Carbon Price Support (CPS) mechanism will have a limited effect on NAV, estimated between 0.5pps and 1.0pps. A more precise assessment will be available once independent forecasters update their power price assumptions in the second quarter. The move has, therefore, not been adopted in this update.
The UK government’s announced changes to the Electricity Generator Levy do not impact Foresight Solar’s NAV since the net power price the Company expects to receive for its electricity production is lower than the established threshold.
The investment manager awaits details on the Wholesale Contracts for Difference mechanism and will continue to assess the potential for further revenue optimisation, as well as engage with industry groups and the government to deliver the best possible outcome for shareholders.
As previously announced, the policy changes as stated so far are not expected to affect Foresight Solar’s 8.10pps dividend target or its anticipated 1.1x dividend cover for 2026.
Trading update
Lower irradiation in the UK during the first quarter – a seasonally weaker period for generation – was partly offset by better weather and above-budget output in Australia. Overall, global production was 11.2% below forecast, with solar resource 5.9% under expectations.
The investment manager continued to actively manage the Company’s power price hedging strategy during the period. Global contracted revenues are now 87% for 2026, 75% for 2027 and 63% for 2028 of forecast total revenues for each year, with average UK prices at £75.76/MWh, £70.51/MWh and £74.27/MWh for those years, respectively.

Global stock markets remain near record highs but are volatile and vulnerable to shifts in the global geopolitical landscape. Analyst Edmond Jackson shares his new investment outlook.
5th May 2026
by Edmond Jackson from interactive investor

In King Lear, the phrase “all shall be well” represents a desperate, ironic, or deluded hope for peace amid overwhelming tragedy and madness.
Perhaps this, together with a collective willingness to “buy the drop” after authorities provided stimulus through financial crises since 2008, explains the social psychology propelling markets to record highs – despite the International Energy Agency (IEA) declaring the closure of the Strait of Hormuz to be the biggest energy security threat in history.
There was also the experience of equities rebounding strongly from April 2025 after US President Donald Trump imposed reciprocal tariffs.
But for how long can complacency run? With no sign of either the US or Iran blinking first over the oil deadlock, analysts predict a tipping point in four weeks as stocks of oil and commodities run down.
While UK government messaging reassures about petrol supply (chiefly to avert panic buying), as I cruised down the M40 on Sunday the gantries displayed “Beaconsfield Services: No Fuel”. It seems 20p or so on a litre of fuel is just a taste of things to come. And pick your own number as to where oil prices could go. At least crude markets sense what is happening, with Brent up from around $90 a barrel on 20 April to over $113 now.
Besides “all shall be well” (by way of a Middle East settlement despite no real negotiations) traders have also assumed the “Trump Always Chickens Out” (TACO) rationale; that he would back down in the face of US discontent with high fuel prices ahead of mid-term elections. Most have underestimated the resilience of the hardline Revolutionary Guard now in effective control of Iran, with its fresh sense of power over the US and its allies via control of the Strait.
Last Thursday, the Bank of England left interest rates unchanged at 3.75%, but said the UK may need to brace for increases later this year given that “higher inflation is unavoidable” and would probably peak at 6% by the start of 2027 – in a worst-case scenario of oil over $130 and remaining high. Unemployment would rise to 5.6% and interest rates to 5.25% to combat this.
Interestingly, several housebuilders saw share prices bounce as much as 10% in response to “in line” trading updates – as if builders had already fallen so far this year that they’re pricing in a worst-case scenario for confidence among home buyers and industry operating costs.
Yet as with many shares currently, a happy consensus remains for moderate earnings growth in 2026 and 2027, which is at odds with the rising risk of mild recession. Without a resolution over the Strait, forecasts need a dose of realism. Even if it was to promptly reopen, economists say 2026 growth would be half what was previously expected. But longer closure implies a recession.
Iran has this morning warned the US against being “dragged back into the quagmire” after a day of attacks in the Strait, with Monday having seen the start of Trump’s “Project Freedom” where the US military supposedly guides stranded cargo ships out of the waterway. Of around 2,000 such ships, the US says two US-flagged vessels were able to leave yesterday.
I doubt the US will be able to walk away as TACO traders assume. Israel and United Arab Emirate (UAE) states will likely be pushing to “finish the job” militarily, although it’s unclear how realistic that is given an entrenched and resilient Iran.
A chief hope would appear to be Iran facing its own crisis as oil storage capacity fills up and the flow of money to its military may soon start to dry up.
Perhaps the stalemate will persist another month until another big jump in oil prices forces a decision by the US.
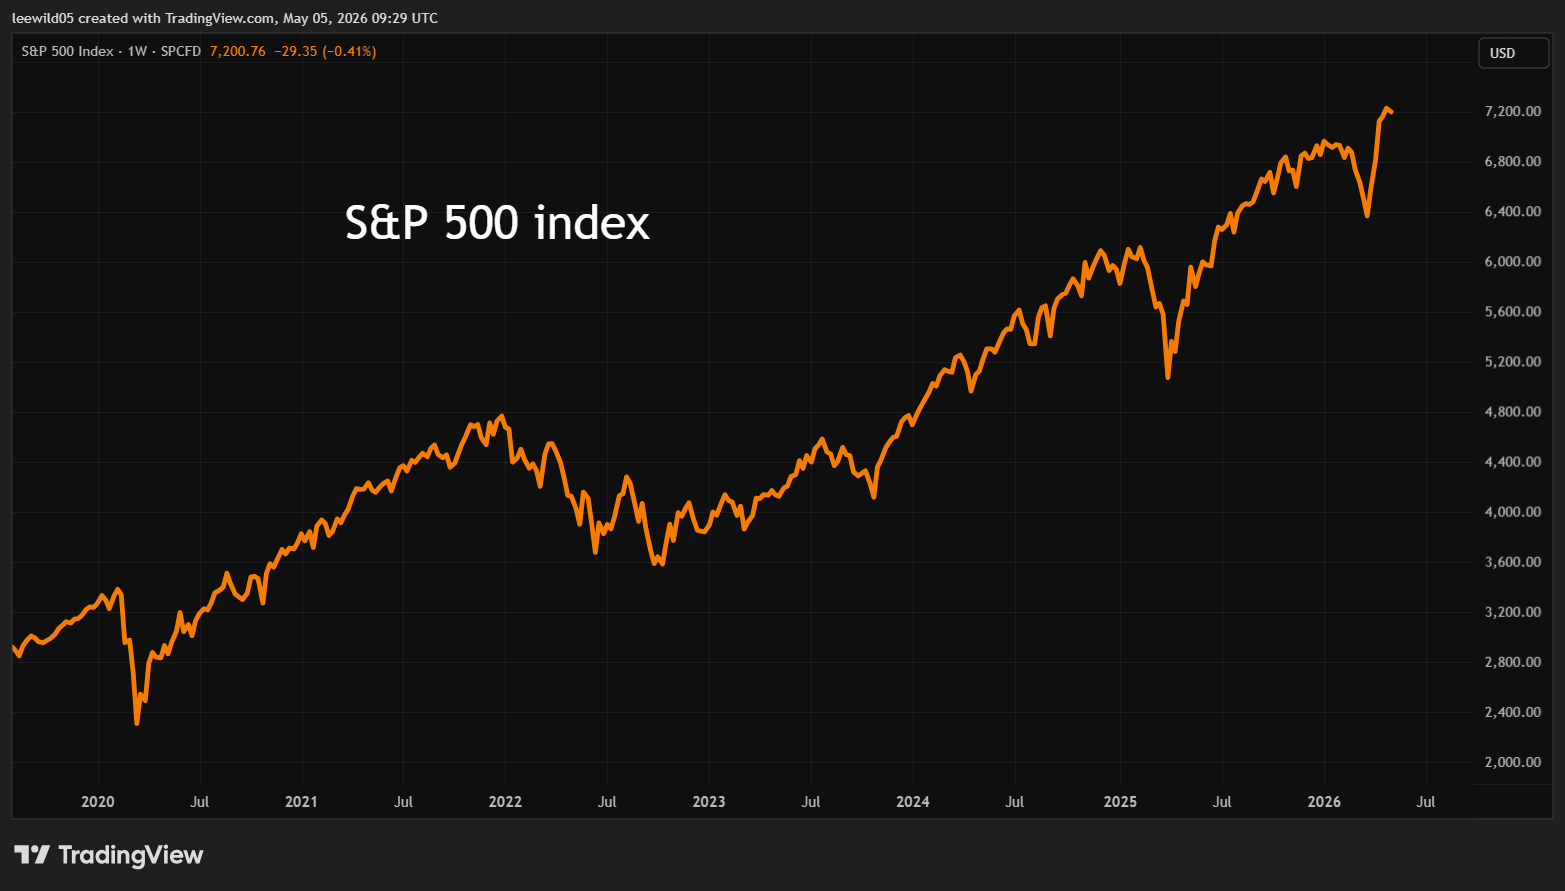
Meanwhile, US shares have continued to rally, aided by strong first-quarter earnings, but the S&P 500 looks exposed on a price/earnings (PE) ratio around 28-30x versus an historic mean average of 16-18x.
Source: TradingView. Past performance is not a guide to future performance.
While the government continues to reassure on fuel supply, a significant risk is US oil imports constituting nearly a third of the UK’s imported primary oil. If shortages continue to force US fuel prices up, then it seems to me that Trump’s America First agenda could see the US restricting exports. We have to hope the recent “soft diplomacy” of King Charles’ visit carries some influence, yet Trump is notoriously mercurial and it seems hard to envisage the UK being made a special case under export restrictions.
This Thursday’s local elections are an important test of the Labour government under Keir Starmer, where a drubbing will renew calls for a replacement prime minister. Andy Burnham, Labour mayor of Greater Manchester, has reportedly identified several seats where MPs are prepared to step aside, enabling a by-election for his return to Parliament. A formal challenge could therefore manifest shortly. The gilt market might see him as preferable – being relatively soft-left – than Angela Rayner, who still has to resolve her property tax affairs with HMRC.
If, therefore, Starmer is forced to step down by his Cabinet, it would create near-term uncertainty, but I do not think as serious a concern as, for example, the way Labour has run up welfare benefits ahead of income tax receipts (according to the Office for Budget Responsibility data in respect of the 2025-26 financial year).
If you recall, New Year 2019 already had reports about how the Wuhan virus was inevitably heading our way, yet stock markets continued to rally in January and February to record highs. It took until the week of 9 March 2020 for equities to fall sharply. While the ensuing lockdowns were obviously a starker hit to economic activity than high energy prices and possible fuel shortages, there seems a commonality in “reality postponed” as markets partied on.
It would seem to need price rises – air tickets, food and fuel especially – impacting inflation – to strike truth this time around.
Coincidental is the longstanding adage “Sell in May and go away”, which actually originated from farmers managing their cash flow in decades past, when the US market was dominated by individual investors. Yet various studies suggest it is not a reliable investment strategy despite summer and early autumn producing lower or more volatile returns than winter.
This is chiefly because you are then left with the dilemma when to buy back and may miss intervening rallies and compounding gains.
The same could be said to apply now, although a retreat from adding risk seems wise, if only to ensure cash is available for potential opportunities in what looks a volatile summer ahead.
Edmond Jackson is a freelance contributor and not a direct employee of interactive investor.

© 2026 Passive Income Live
Theme by Anders Noren — Up ↑