Passive Income Live

Investment Trust Dividends

Page 10 of 457

“Not Much You Can Do About the Yields.”

Wrong.

Brett Owens, Chief Investment Strategist
Updated: September 2, 2026

Three investors walk into a bar and start talking retirement. But just two of them volunteer their honest opinions.

The third sits there and haughtily judges them!

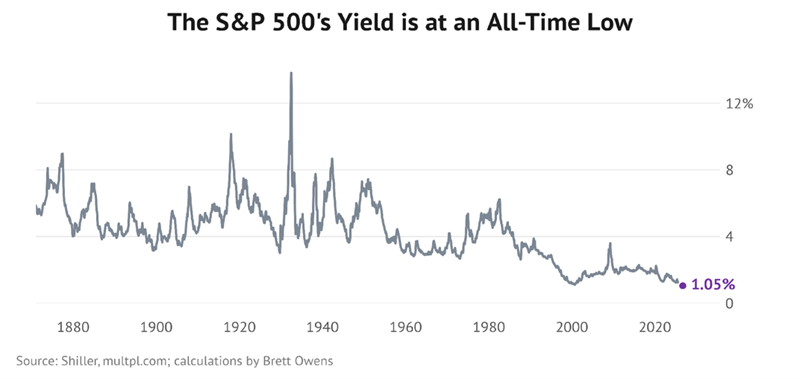
First up, a 75-year-old retiree. He looks at what the S&P 500 (America’s ticker!) offers these days. Today, it’s never paid less. Our veteran investor shrugs and gives up on dividends: “Not much you can do about these paltry yields.”

His counterpart is a 79-year-old who was told as a young man that he would care more about his dividends as he aged. Yup. (Spoiler alert! “They” were right, the man says. More from him later.)

Meanwhile, their judgy counterpart is, of course, a professor! He lacks their experience in the markets but that doesn’t stop him from casting aspersions. They’re both kidding themselves, he taunts. He even has a name for their mistake: the “free dividend fallacy!”

One correction on the story above. It wasn’t a bar—all three turned up in the same Wall Street Journal story. Yet reading it made me feel like I’d been overserved at our hypothetical dividend tavern. Let’s break down why the investors’ stories are relevant to our retirement goals.

First, the 75-year-old shrugging about low yields. Why? I suspect two reasons.

For starters, his quote smells like a roll of Benjamins. The type rich guys peel off and give to their kids. In fact, he mentions in the story that rather than reinvest his dividends, he’s handing the checks to his children instead.

Obviously not a dude who needs every dividend payment. He’s a retired doctor, and I assume his cash pile climbs plenty high.

But lots of dough, believe it or not, can be an income handicap. You receive too much vanilla financial advice. He mentions money market funds and yes, when your nest egg is sizeable enough, 3% payouts will cover the bills. And you can lament it is what it is at the country club without too much actual pain.

For you and me though, the multi-million-dollar option isn’t on the table. And that’s OK because we have available lanes on our income highway that pay 7%, 8% or even better. This yield advantage lets us generate as much passive cash flow on our $1 million as our doctor friend does on $2.5 or $3 million.

With 8% yields, we can collect $80,000 on a $1 million nest egg, without having to sell a single share. That’s 7%, or $70,000, better than America’s ticker, which yields an all-time low 1% today:
And here’s the advantage of this strategy: It makes our day-to-day way more peaceful and a lot less stressful. We don’t have to follow the market. We don’t live by whether the S&P 500 is up or down today. Yes, our account balance bounces around with everyone else’s. Our income doesn’t.

Here’s why. That $80,000 works out to $6,667 per month, hitting our account like clockwork. Now, contrast that with the withdrawal strategy—selling shares every month to raise the same $6,667. Suddenly, it matters a great deal whether the market is up or down!

A down market becomes the worst thing for us, because we must sell more shares of SPY to raise our $6,667. We find ourselves rooting for the market to rally so we sell fewer. But the market doesn’t care what we need! The market does what the market does and this market is a roller coaster. Do you want a bad month putting a dent in your retirement?

Here’s the choice. I ran the numbers on it. You can take $1 million in SPY and withdraw $6,667 every month, selling shares along the way. But if you try this during a down year like 2022, you’ll consume 36% more of your shares than selling in a calm year. And the shares are gone for good!

See, the problem is that when we sell lots of shares low, these shares never come back. Our principal has been reduced—permanently.

Our professor friend says it’s all the same. Well—how is it all the same if we sell more shares when stocks are low?

To be fair, the professor has a point. Dividends are not free money. When a company pays out a dollar, the share price drops by that dollar. He’s right about that.

He’s also right to warn people who chase a yield without verifying the income stream behind it. Market history is filled with companies that paid dividends they couldn’t afford to keep investors from selling, only to hit the wall and lose them with a dividend cut later.

We, as careful contrarians, know this. We do the math on what’s funding our dividends before we buy them. We check that a fund earns more than it pays out. When it does, the payout comes from profits—not from our principal. The fallacy only bites the folks who never check.

Where the professor loses me is at diversification. He warns that dividend investors end up un-diversified. That’s true, if you don’t know what you’re doing. Our income portfolio spreads across six independent buckets, among them Safe Muni Bonds paying 7% to 8% (federal tax-free, so we keep more of it), Energy Toll Collectors—our oil and gas pipelines—and our Dividend Lifeboats, covered-call funds paying 9% to 11%. Plus, a bond-fund lane paying up to 17% (yes, 17%). And two more buckets we’ll save for another day.

These six payout streams don’t rely on the same engine. For example, muni coupons don’t care what option premiums did this month.

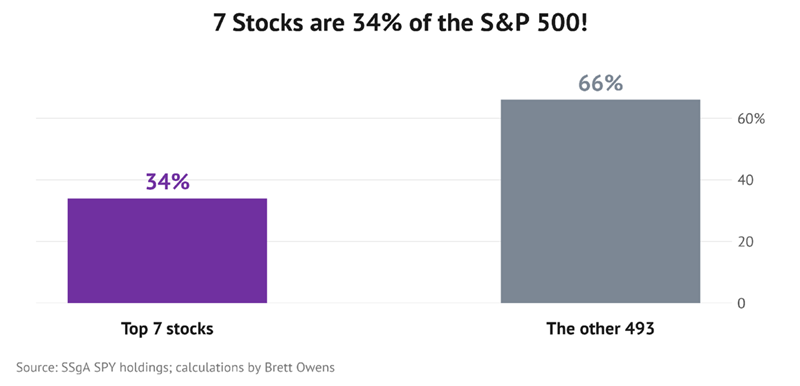
Contrast that with the S&P 500. Did you know that just seven stocks make up one-third of the index? One-third! Should be called the S&P 7:
And here’s the uncomfortable part that newbie dividend investors don’t want to hear: Dividends can disappear. UWM Holdings (UWMC) suspended its dividend and its stock plunged 35%. Papa John’s (PZZA) pulled its payout the very next day.

When we build an income portfolio, we’re not buying, holding and closing our eyes forever. We watch our payers. We make sure the businesses we own keep generating enough cash to fund their payouts. If and when the landscape or the fundamentals change, we move money between positions.

In other words, we never have to sell shares to pay the bills. When we move money between payers, that’s our choice—made on our schedule.

And hey, if we’re doing it wrong according to a judgy WSJ professor, that’s just fine with us.

Which brings me back to our 79-year-old friend at the bar. As a young man he was told he’d care more about his dividends with every year that passed. Now comfortably retired, he says, “Now I can attest to that as fact!” Smart… and our kind of guy! The professor can keep the fallacy. We’ll keep the checks.


Wall Street history is pretty clear

If a Downturn Is Coming, 50 Years of Market History Says This Is the Single Best Response

Wall Street history is pretty clear: if there’s a bear market on the way, you’ll probably want to follow Winnie the Pooh’s sage advice.

By Reuben Gregg Brewer – Sep 5, 2026

Key Points

  • The stock market goes up and down over time, but the long-term trend is upward. 
  • Getting caught up in the zigs and zags of Wall Street could leave you worse off than simply doing nothing. 

Winnie the Pooh probably isn’t the investment guru that first comes to mind when you think about Wall Street. And yet he has offered some pretty sage investing advice: “Doing nothing often leads to the very best of something.” The history of investing over the past 50 years very clearly shows that this fictional, honey-loving bear could be on to something. Here’s why.

The S&P 500 goes up and down, and then up again

Turning to a real person, iconic investor Warren Buffett, the former CEO of Berkshire Hathaway (BRKA-0.48%)(BRKB-0.41%), has said that “Investing is not a game where the guy with the 160 IQ beats the guy with the 130 IQ. Once you have ordinary intelligence, what you need is the temperament to control the urges that get other people into trouble in investing.”

Statues of a bull and a bear on a seesaw.

Image source: Getty Images.

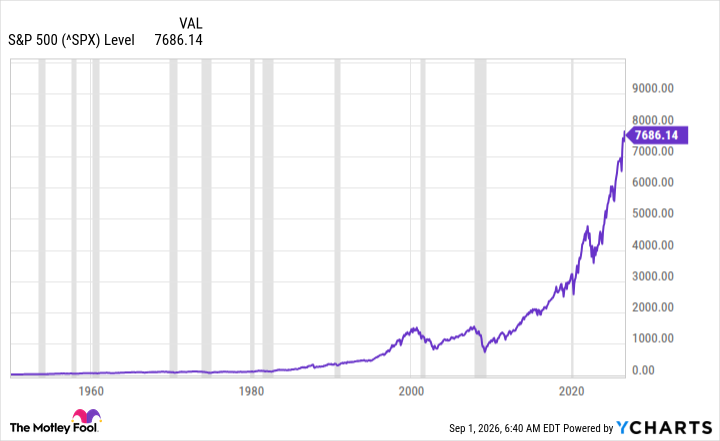
The issue of temperament is where Buffett and Pooh intersect. That’s because the S&P 500 index‘s (^GSPC-0.38%) history shows that Wall Street switches between bull and bear markets in a zigzag fashion, while generally moving higher over time. The chart below shows that simply buying and holding the S&P 500 index would have yielded a positive long-term outcome if you had the temperament to do nothing while it gyrated in the short term.

^SPX Chart

^SPX data by YCharts

In fact, Warren Buffett has actually suggested that most investors would be better off just buying the S&P 500 index and… doing nothing. That’s not entirely true; Buffett would likely recommend continuing to regularly buy an S&P 500 index ETF, such as SPDR S&P 500 ETF (SPY-0.39%) or Vanguard S&P 500 ETF (VOO-0.38%), regardless of market conditions.

Think long term, even when Wall Street is thinking short term

Buying every month (or at another regular interval) is known as dollar-cost averaging, which can be a powerful wealth-building tool. But the real key is to avoid market timing, or trying to buy and sell to take advantage of short-term price movements. That is difficult, if not impossible, to do successfully over the long term. Market timing would be one of the “urges” that get investors into trouble. And if you have the right temperament, 50 years of Wall Street history says you shouldn’t do it.

Instead, you should channel your inner Winnie the Pooh and do nothing. Well, nothing other than sticking to the same investment plan you had before the bear market downturn. In the end, buying and holding for the long term has a pretty incredible 50-year track record.

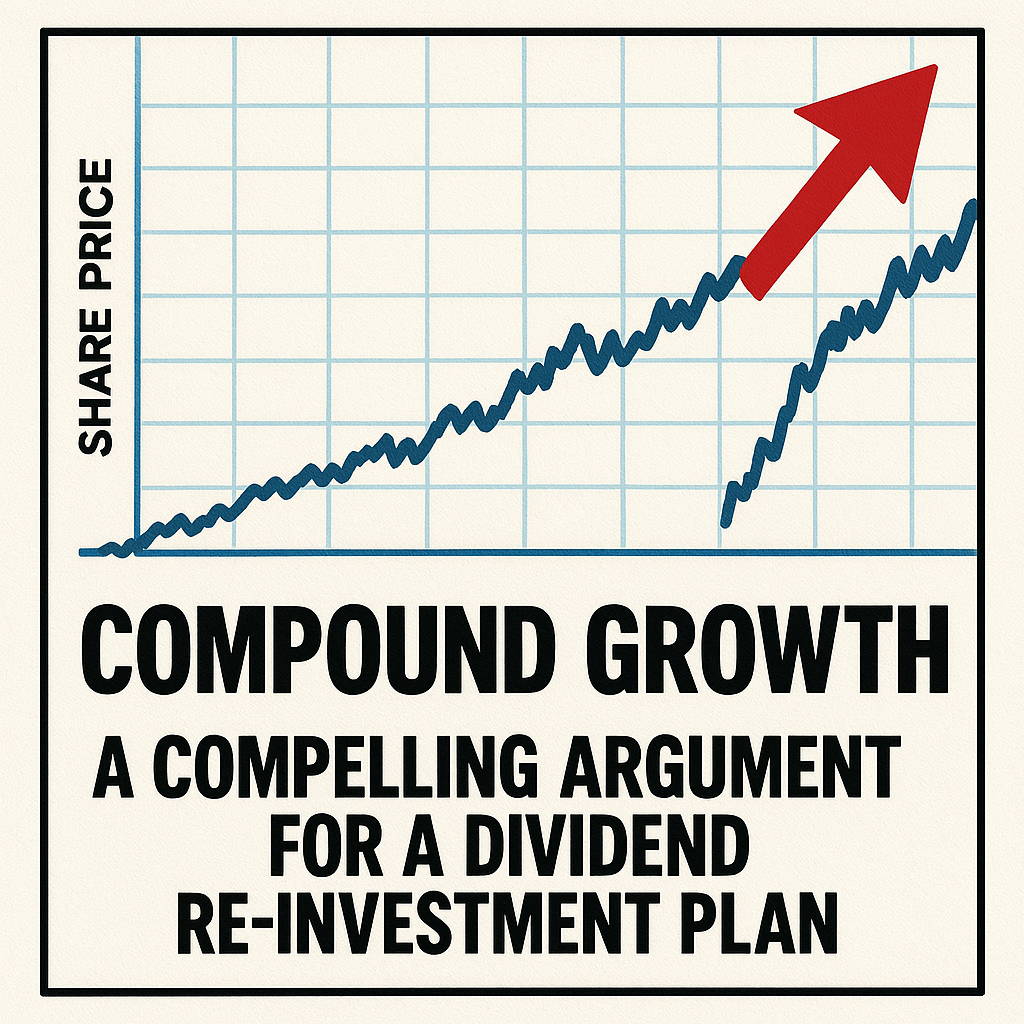
$10,000 Invested at 8% for 20 Years Could Become $46,610

$10,000 doesn’t need perfect timing to become meaningful wealth — it mainly needs time and compounding.

Posted by Amy Legate-Wolfe

Published September 5, 8:15 pm EDT

WSP

You’re reading a Fool.ca free article.

  • Most of the growth happens in the later years, when returns start earning returns at a larger base.
  • WSP looks like a long-run compounder with record backlog and rising profitability, supported by global infrastructure demand.
  • The key risks are valuation, acquisition execution, and how AI changes parts of engineering work.

A $10,000 investment doesn’t look like the beginning of a fortune. Give it 20 years, though, and it can become surprisingly ambitious.

At an illustrative 8% annual return, a single $10,000 investment left to compound for 20 years would grow to about $46,610. No additional contributions. No perfectly timed trades. Just time doing something investors frequently underestimate.

The Ontario Securities Commission’s investor education site describes compounding simply: returns are reinvested so they can begin earning returns of their own. The longer that process continues, the larger its contribution becomes. The early years are the least exciting part.

Decades of income

After 10 years at an illustrative 8%, $10,000 becomes roughly $21,589. That’s already respectable. Leave it invested another decade and the value more than doubles again.

* Returns as of July 30th, 2026

TIME INVESTEDILLUSTRATIVE VALUE AT 8%
Starting investment$10,000
10 years$21,589
15 years$31,722
20 years$46,610

An 8% return isn’t guaranteed. Stocks certainly won’t deliver it in a tidy straight line, either. Some years could produce enormous gains and others will make investors question every decision they’ve made since breakfast. The point is what happens when gains remain invested.

After 20 years, the original $10,000 generated roughly $36,610 of growth. The investor supplied less than one-quarter of the final portfolio value. Compounding did the rest. That’s why I’d rather own quality businesses for years than constantly hunt for the next short-term winner. Compound growth needs something productive to compound.

WSP

WSP Global (TSX: WSP) provides engineering, design, and consulting services across transportation, buildings, water, energy, and environmental projects around the world.

That puts WSP stock behind a huge amount of infrastructure investors rarely think about. Roads need designing. Power grids need expanding. Water systems need upgrading. Data centres, transportation projects, and new energy infrastructure all require engineers long before the ribbon-cutting photos appear.

The latest quarter suggests customers aren’t running out of projects. WSP stock finished its second quarter with a record $20.1 billion backlog, up 23.2% from a year earlier. Adjusted earnings before interest, taxes, depreciation, and amortization (EBITDA) increased 28.8% to $815 million, while organic net-revenue growth accelerated to 5%.

Looking ahead

Management also increased its 2026 financial outlook. For a long-term investor, that backlog may be the most interesting number. It represents work already waiting to be completed, giving WSP stock unusually good visibility into future revenue.

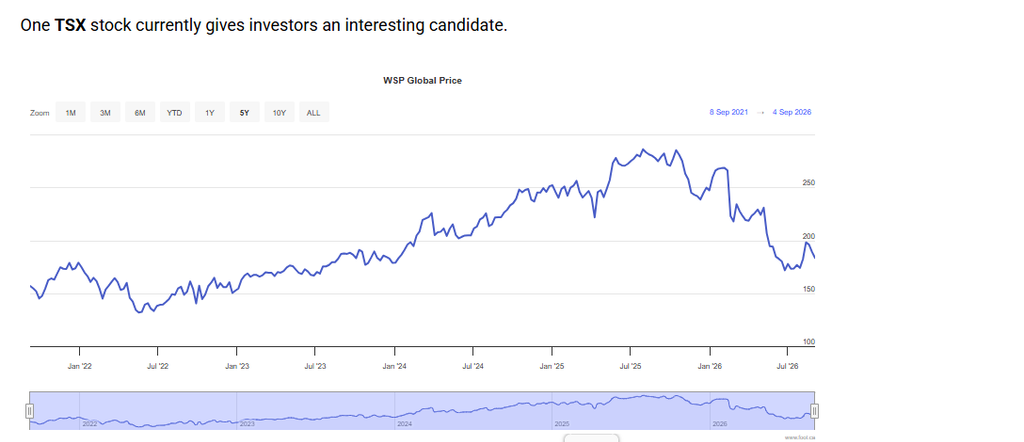
Meanwhile, WSP stock recently traded around $197. That remains roughly one-third below its 52-week high near $291. So, the stock isn’t exactly cheap at around 27 times trailing earnings. Even so, investors are paying considerably less than they were near the peak despite WSP producing record backlog and stronger profitability.

Part of the concern centred on whether artificial intelligence (AI) could eventually automate portions of engineering and design work. I wouldn’t dismiss that risk. WSP stock also grows heavily through acquisitions, and paying too much or integrating a major deal poorly could damage returns.

Its recent pursuit of Dutch engineering firm Arcadis shows both sides of that strategy. A successful acquisition could expand WSP stock substantially, but increasingly large deals also require increasingly careful capital allocation.

Bottom line

That’s why I wouldn’t buy WSP stock expecting another 8% every year like clockwork. I’d buy it because infrastructure spending, electricity demand, urban growth, and aging public assets can provide decades of work. Investors buying stocks in Canada don’t need every holding to double tomorrow.

Sometimes $10,000 simply needs a good business and enough time to become $46,610.

Watch List: SDV

You may have read that Smaller Company shares are under valued.

But just in case, you are early or late to the news, you want a dividend to re-invest in your Snowball, in case your research is wrong.

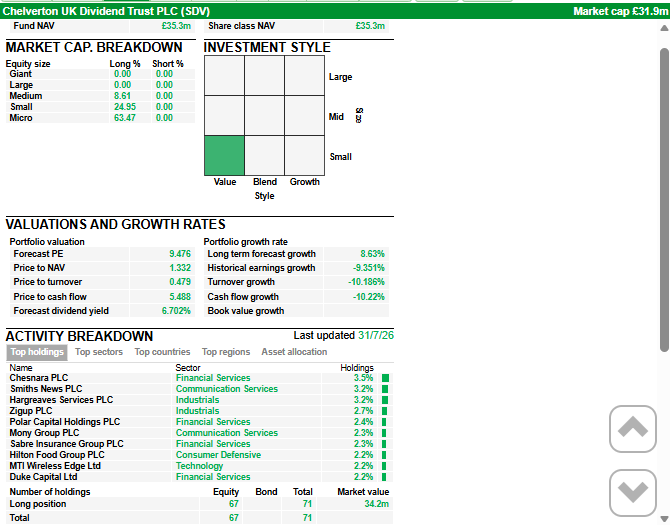
Current yield 7% but higher risk as the market cap is very modest.


Chelverton UK Dividend Trust PLC – Chelmsford, England-based investor in UK small- to mid-cap companies – Net asset value per share rises 8.4% to 144.20 pence at April 30 from 133.04p the year prior. Revenue return per share is 7.42p down 45% from 13.32p. Dividends per share paid in the financial year are 10.75p, down from 12.90p the year before. This results in a total return of 16%, the firm says, below the AIC UK Equity Income sector share price total return of 19% and a NAV total return of 17%. “Despite the uncertainties, we continue to be confident in the prospects for companies in the small and mid-cap sector, whose market rating remains historically low,” Chelverton says. “We believe the company continues to offer a compelling combination of an attractive dividend yield and the potential for capital upside from any recovery in the UK small and midcap market. The board keeps market circumstances under review and will continue to seek opportunities to reintroduce gearing into the company’s structure.”

———-

What’s Happening Across the Pond ?


Contrarian Outlook


The Next Boom Could Come From a Surprising Place. This 8.5% Dividend Is Ready

by Michael Foster, Investment Strategist

We don’t often see the European Union as a major driver of stock returns.

I mean, American investors usually see the EU as stuffy and overregulated – when they think about it at all! But I urge you to reconsider, because this could be about to change.

When it does, funds with exposure to the continent – including an 8.5%-yielding closed-end fund (CEF) called the Allspring Global Dividend Opportunity Fund (EOD) – could catch a lift.

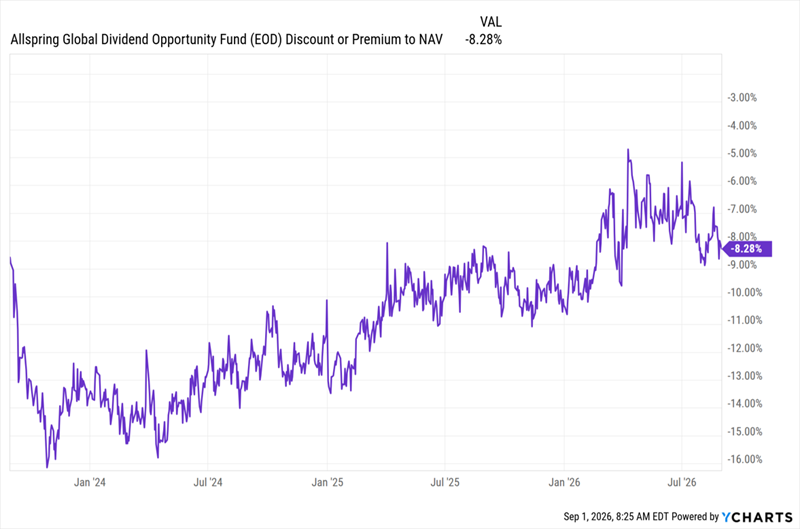
Let me be clear: This potential boost from Europe is only one reason to take a look at EOD. The main one is the fund’s discount to net asset value (NAV, or the value of its underlying portfolio). It’s in the “sweet spot”: cheap, at 8.3%, but moving toward par.

EOD’s Discount Trend Shifts in Our Favor 
I expect that to continue for two reasons. The first: EOD’s US investments, which account for about two-thirds of its portfolio, stand to gain from ongoing growth here, capped with a productivity boost from AI. Lower interest rates in the longer run would add an extra kick.

That’s the foundation of our play.

Then Europe comes in with a setup to boost the roughly 13% of EOD’s portfolio held on the continent and in the UK.

What’s Happening Across the Pond

Let me start with something most American investors don’t realize about their European cousins: They’re just not as into stocks as we are.

The data, based on recent figures from the European Central Bank, tells the story: 32% of workers’ wealth is kept in cash, versus 11% in the US. And although 31% of US wealth is in stocks, just 5% of EU wealth is.

The result is a lot of cash on the sidelines, and for a bloc eager to trigger new investments, it’s low-hanging fruit. About $11-trillion euros (or around $12.5 trillion) of low-hanging fruit, to be exact! To unleash that cash, the EU is considering special tax treatment for investors. New kinds of low-minimum accounts are being rolled out across the continent, too.

The question then becomes: How can we grab upside (and income) as more of this cash rolls into stocks?

Let me be clear that our route does not run through CEFs directly: Due to other regulations, American CEFs are difficult for Europeans to buy. So we can’t expect a wave of euros to flood into our favorite income plays.

There are limitations, too. One is the well-known phenomenon of home-country bias, or the tendency for people to buy stocks in the nation in which they live. Plus, there are legal and regulatory restrictions, since European lawmakers are aiming to encourage European stock investment.

That steers us back to EOD. With its European exposure (backstopped by a strong base in the US), that shrinking 8.3% discount and an 8.5% dividend yield, it’s a “one-stop shop” as more investment in America and Europe lifts stocks in the US and the EU.

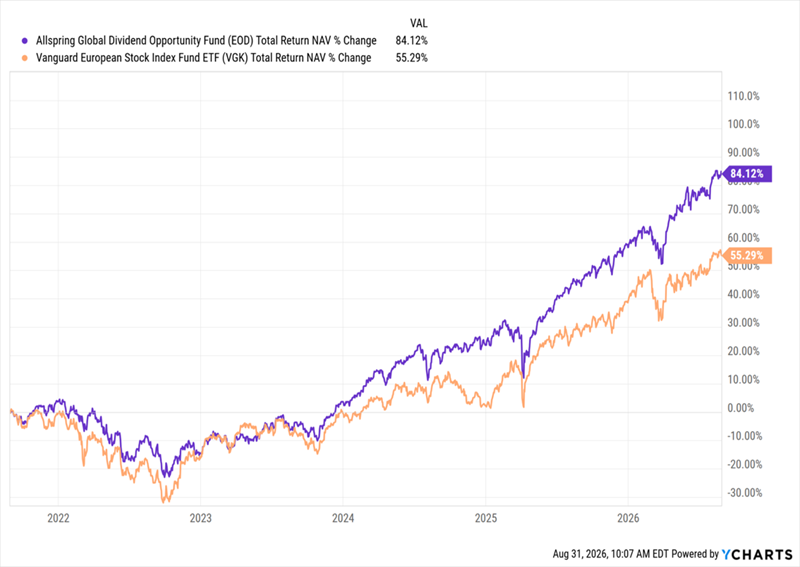
Beyond that, we have a history of strong performance, with EOD posting an 11.8% annualized total return, on a market-price basis, over the last decade, beating the benchmark Vanguard European Stock Index Fund ETF (VGK).

And on a NAV basis, EOD has been crushing VGK, too (see the purple line in the five-year chart below):

EOD’s Portfolio Outruns European Stocks 
That’s not surprising for a fund whose portfolio is fronted by outperformers like NVIDIA (NVDA), Apple (AAPL), Alphabet (GOOGL) and Microsoft (MSFT). The fund also boosts its income through its holdings of high-yield corporate bonds (around 20% of the portfolio). In addition, it sells covered-call options on its holdings – a strategy that generates extra income for the fund and performs best in volatile markets.

That’s another key, because I do expect more volatility as we enter the last few months of 2026, with midterms in the US, ongoing uncertainty in the Middle East and rising yields on long-term government bonds, both in the US and globally.

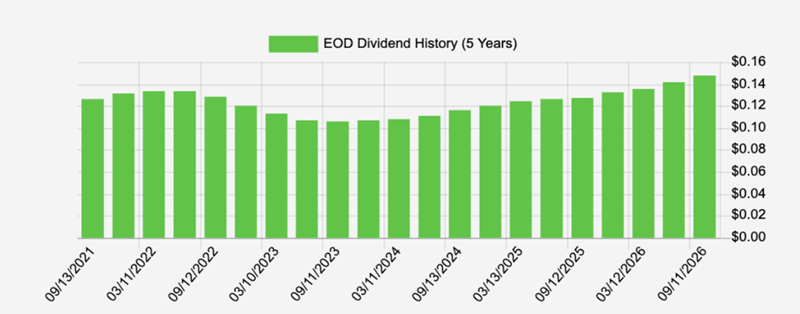
We also love the fact that the fund has been returning recent strong gains in its NAV to investors in the form of a rising dividend. As you can see below, the payout has been climbing since 2023, right around the time the fund’s NAV started to take off:

Dividend Tracker Source: Income Calendar
I expect more gains, and potentially further dividend hikes, as EOD’s portfolio benefits from continued strength in the US and more stock investment from Europe. That’s just the kind of diversified setup we crave in an uncertain market like today‘s.

The fact that we can get in for 92 cents on the dollar, thanks to EOD’s discount, is a bonus.

Your Best Play? Mix “Unloved” Europe With AI Gains for Big Upside, 10% Payouts

As contrarians, we’re always on the lookout for situations like the one brewing in Europe right now.

Europe has always been overlooked in the US, where it’s (too) often seen as a bastion of regulation and slow growth.

That’s changing. And CEFs like EOD give us a nice way to grab a piece of the action, with a portfolio boasting a solid position in Europe and a strong base of US stocks.

HICL

HICL is ready for the next twenty years.

Overview

Since its pioneering IPO two decades ago, HICL Infrastructure (HICL) has established itself as the leading core infrastructure trust, generating an NAV total return of 8.5% p.a. through different cycles, from both income and capital growth. A recent period of static dividends ended in the financial year ending 31/03/2026, and HICL’s board expects Dividends to 31/03/2028 to grow at an annualised 1.8%, while maintaining dividend cover at 1.1x.

Since HICL’s IPO, the infrastructure landscape has evolved and so has HICL, adding more diversified sources of return through different types of infrastructure across several geographies, alongside projects in different sectors and, selectively, at an earlier stage. Active management has also played a role, through project optimisation and judging when investments are ready for disposal. Increasingly, HICL’s investments, such as New Zealand’s FortySouth mobile towers business, are operating companies with capacity to grow, while retaining the key infrastructure characteristic of long-term stable and contracted revenues. HICL has therefore come a long way since its beginnings as a predominantly UK PFI investor.

In July 2026, the HICL team set out a detailed plan that, at a headline level, will gradually increase target medium-term returns from the 7–8% range set at IPO in 2006 to 10%. This builds on their record and is expected to be achieved while maintaining dividend growth and cover. Disposals of maturing assets and excess cashflows will be partly used to increase exposure to the new class of ‘enhancer’ assets, while c.80% of HICL’s portfolio is expected to remain in the familiar ‘yielder’ and ‘grower’ categories that have powered its long-term performance. This carefully thought-out plan reflects today’s long-term infrastructure opportunity landscape and, in the Portfolio section, we look at how HICL’s long-term performance includes significant contributions from both higher-returning investments and active management. The revised strategy could, therefore, be seen as a natural evolution of the team’s existing strengths and track record in a higher-rate environment.

Analyst’s View

One of the most striking numbers in HICL’s long-term performance is the comparison between its 20-year annualised NAV total return of 8.5% and the weighted average discount rate of 7.9% over the same period. In simple terms, discount rates give an indication of expected returns before fees. If the HICL team had achieved only what was modelled, the returns would have been less than 7% rather than the 8.5% actually achieved. The gap is explained by the team pulling the active management levers discussed above. As the revised strategy plays out, it seems very likely that HICL’s portfolio will come to include more of the types of investments that play to those strengths.

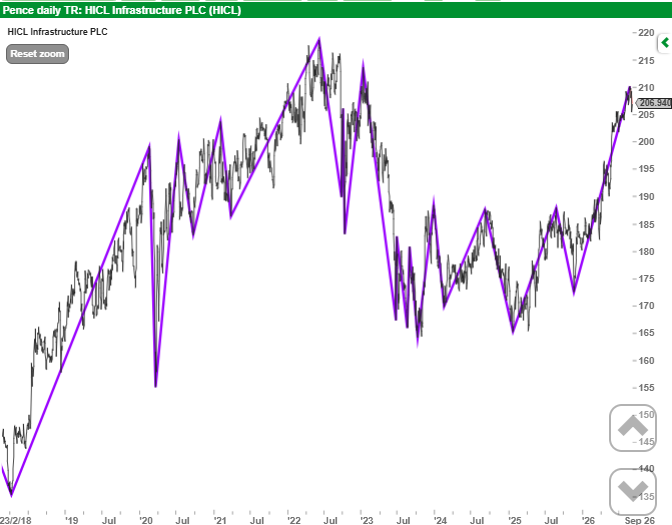
While the precise details of HICL’s plan for the next twenty years were revealed in July 2026, the direction has been clear for a while. The market has rewarded HICL with a significant share price rise this year as it starts to move past the end of the ‘bond proxy’ era that so heavily influenced HICL’s and peers’ share prices from 2022. That upward trajectory has continued since the announcement and puts HICL on a discount of under 15%. By the standards of the last twenty years that remains wide, but in a more recent context, it shows the success of HICL’s capital allocation policy, including share buybacks, and greater appreciation of HICL’s growth prospects. And, of course, a welcome return to dividend growth. If delivered, HICL’s plan for the next twenty years has the potential to reinforce its position as one of the UK’s leading listed infrastructure investment companies, while continuing to provide long-term income and capital growth for shareholders.

Bull

  • HICL has evolved to embrace the wider opportunity set of today’s infrastructure market and higher interest rates
  • Return to dividend growth
  • Discount has narrowed to a more sustainable level, although there is still work to be done

Bear

  • A higher return target has the potential to require more risk
  • Many of HICL’s investments are leveraged, which can amplify losses as well as gains
  • Rising interest rates and government bond yields could be a headwind

Current yield 6.2%, neither fish or fowl.

Mansion House reforms

Strategy

Point Break

If big institutions are coming back to the sector, which trusts will benefit first?

Thomas McMahon

Updated 02 Sep

Disclaimer

This is not substantive investment research or a research recommendation, as it does not constitute substantive research or analysis. This material should be considered as general market commentary.

KTI readers will be ‘experienced’ and ‘distinguished’ enough to remember the 1991 film Point Break. Skating over the fact it is now 35 years’ old, some readers might not know a point break is a surfing term for a piece of land which produces long, straight and predictable waves – perfect for surfing and analogously perfect for investing. Sadly, rocks are more predictable than stock market fundamentals, so the waves of momentum that pass over markets are always obvious in retrospect but very hard to see in advance. However, we think the conditions are just about right to see a wave of institutional money gathering to sweep through the investment trust sector.

To be clear, we can’t see it happening yet, although we may be seeing some early signs. This year we have noted some institutional investors adding to specialist equity trusts and to alternative assets trusts, both of which are arguably best accessed through the closed-ended structure. We also hear of pension funds and family offices researching, or adding to, alts and PE trusts. There is still some selling going on, perhaps around benchmark changes and other specific factors, but it is certainly not one-way traffic like it was a couple of years ago, and our ears to the ground may possibly be picking up some slight trembling. It may take some time, but we think that good medium to long-term returns might be achievable by getting the board lined up now (there may still be time to learn to surf). Here we consider which trusts are most likely to benefit if institutional investors start to return.

Cost disclosure

Costs have been one of the pressure points for professional investors for well over a decade. Regulators and analysts have focused on the all-in cost of investment services, spurred in part by the growing availability of low-cost tracker funds. This attention produced some perverse requirements which were particularly significant for institutional investors. The KID RIY figures which had to be reported until recently had a very liberal interpretation of costs which produced some very high numbers for certain business models. Particularly questionable, in our view, was the incorporation of the cost of debt facilities. Gearing is an essential part of the business model for some investment companies and a key advantage of the structure. Gearing gives the potential for much higher returns, and while there are also risks, this is a separate issue from cost. By incorporating gearing within the figure that institutions have to report in clients’ portfolios, regulation made any that included geared investment trusts look particularly expensive. This was a massive disincentive for institutions to invest.

Compounding this was the decision to treat the costs of investment companies like the charges of funds rather than the internal costs of other listed companies. This issue comes out most clearly when considering REITs. An AIC REIT would have to report an OCF and any institutional investor would have to report this as the cost of the investment in the portfolio reported to clients. However, if they bought a non-AIC REIT, like LondonMetric, there would be no OCF and therefore absolutely no cost to report. In that light, it is hardly surprising that LondonMetric has hoovered up so many AIC REITs in recent years and gone from strength to strength. Compounding the injury, stamp duty has to be paid on investment company shares but not on purchases of open-ended funds. So, investment companies were treated like open-ended funds when it hurt them, and shares when it hurt them. Ultimately, this has to stem from the fact the AIFM Directive (2013), which set out many of the rules, was a response to the GFC and was motivated by fear of alternative investment funds, some of which had blown up in the crisis.

The upshot of the old regulation was to disincentivise using investment companies over open-ended funds, and to disincentivise using those which have geared business models at all. These tend to be those investing in asset classes where the closed-ended fund structure enjoys the greatest advantages: infrastructure, renewables and private equity. In this light, the fact that fund of funds managers and other institutional investors no longer have to include the OCFs of investment companies when they calculate their costs makes investment companies much more attractive.

It isn’t just costs that have kept institutions out of the market. Successive governments have recognised underinvestment in the relevant asset classes of infrastructure and unlisted equity by large UK investors such as pension funds. Since 2023, chancellors have unveiled successive measures aimed at boosting allocations to UK infrastructure and private markets by pension funds and other institutions, with July 2025’s Mansion House Accord seeing 17 major workplace pension providers commit to invest at least 10% of their DC funds in private markets by 2030, of which half of that should be in the UK. The expectation is for these numbers to rise over time.

One of the key aims of the governments’ actions is to see more UK capital, more British savings, invested in the UK, in the interest of spurring growth, promoting entrepreneurship, and keeping control of UK-originated businesses at home. This is part of a global retrenchment from globalisation which seems likely to continue for years, if not decades, and we think further measures in this direction may follow.

The Mansion House Accord represents an opportunity for those closed-ended funds which have sufficient size to be investable by large institutions. However, the government is pushing to consolidate multi-employer private sector and local government pension funds, arguing that ‘mega-funds’ will be better placed to provide funding to the UK’s essential infrastructure. This means ‘sufficient size’ will be higher in future for many institutional investors.

Which investment trusts will benefit the most?

We think that regulatory and cultural change is laying the groundwork for institutions to invest more in the investment trust sector. The main beneficiaries, in our view, will be companies in the real assets and alternative sectors, including private equity and growth capital. Investment trusts offer a way to get a liquid and diversified investment in these sectors.

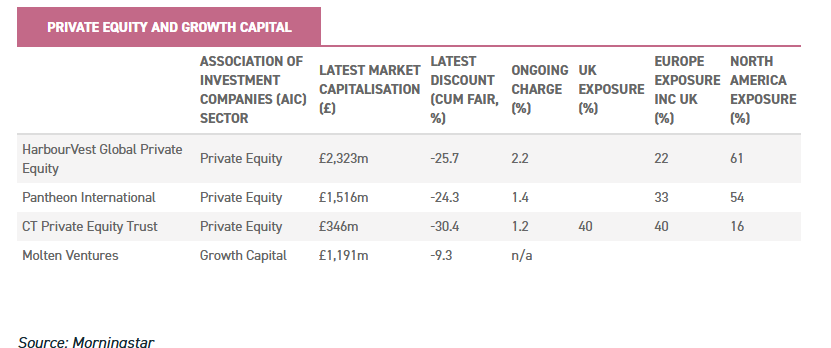
Turning to private equity, we think HarbourVest Global Private Equity (HVPE) looks well-placed to be a beneficiary. It has a large market capitalisation, meaning large investors could take meaningful positions. It also has quite a high OCF, and so the removal of the obligation to report these in look-through cost figures could weigh more heavily on the investment decision. Pantheon International (PIN) has the size, and cost disclosure changes work to its advantage. Neither of these have substantial UK exposure, however, so for investors looking for that, CT Private Equity (CTPE) would fit the bill better. On the other hand, its much smaller market cap will limit its appeal to the larger institutions, at least while the sector trades at a discount. If the trust’s shares get back to par, there would always be the possibility of raising fresh capital.

PRIVATE EQUITY AND GROWTH CAPITAL

The growth capital sector includes venture capital and investing in pre-IPO businesses, typically as a minority investor and usually without the level of influence of the private equity model. Providing growth capital to UK businesses is an explicit goal of the Mansion House Accord and regulation on consolidating pension funds. Molten Ventures (GROW) has the scale to offer meaningful exposure to a diversified portfolio of UK and European growth capital businesses. An interesting dynamic with GROW is that the Molten team also manage external funds and earn fees which benefit Molten Ventures plc. This means shareholders stand to benefit second hand from any segregated mandates or new funds the management team are involved in.

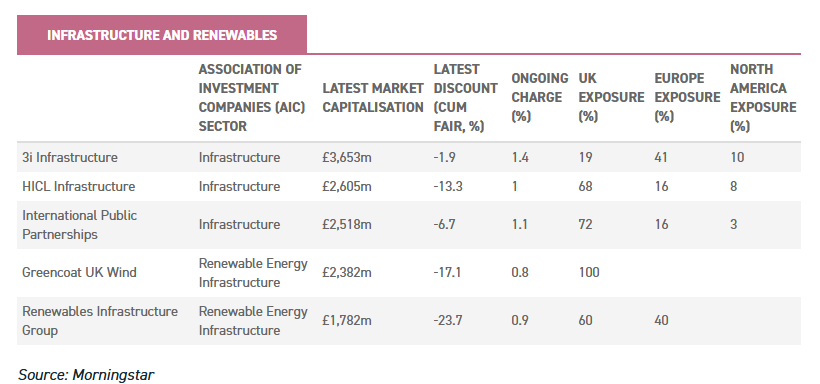
Within the infrastructure sector, we think HICL Infrastructure (HICL) and International Public Partnerships (INPP) stand out both for their size and their majority allocations to the UK. This sector has re-rated significantly over the past year and both trusts are on single digit NAVs, and buying by institutions may have played a role. Being on a narrow discount may also be an advantage: rather than seeing an opportunity, some investors may see wide discounts as a feature to be feared, while they may read a narrow discount as validation. 3i Infrastructure (3IN) also has the size to appeal, and the narrowest discount in the sector. On the other hand, it has much less invested in the UK, while its model of buying operating companies may not fit the bill.

INFRASTRUCTURE AND RENEWABLES

In the renewables sector, Greencoat UK Wind (UKW) really stands out. Not only does it have the largest market cap in the sector, but it is 100% invested in the UK, so it can make the biggest hit towards hitting the target allocation of 5% in UK private assets. The Renewables Infrastructure Group (TRIG) should also appeal, with 60% invested in the UK and a market cap approaching £2bn. OCFs are lower in these two sectors, but KID RIYs would have to carry the cost of the high gearing levels essential to these business models, so the changing legislation on cost disclosure should be impactful across the board.

Conclusion

Media narratives usually trail the facts because received wisdom is slow to change. As we have written elsewhere, the equity trusts are more or less back to ‘normal’ discount levels, while even over the past year the alternative assets space has started to see discounts move in. Equity trusts moved due to some basic technical factors in our view: lower rates are good for risk appetite, while consolidation meant there were fewer vehicles to take the inflows when they returned. We think some basic technical factors should see growing institutional interest in the sector over the coming months and years: regulation has reduced some of the disadvantages in how trusts had to be treated while encouraged investment in precisely those assets they are best designed to hold. While there is a new rival in town in the form of the LTAF, we don’t think it is clear this new structure’s advantages outweigh the disadvantages. So while it may divert some of the flows which could head for investment companies, we don’t think it can hold back the wave entirely. It’s always possible these dynamics could lead to the next cycle of expansion for the sector which history tells us should eventually follow, even if it is hard to imagine at the moment. But that is how investor psychology works in all markets!

« Older posts Newer posts »

© 2026 Passive Income Live

Theme by Anders Noren — Up ↑