Passive Income Live

Investment Trust Dividends

Page 11 of 457

Top 10 most-popular investment trusts: August 2026

A commodity switch took place this month.

1st September 2026

by Dave Baxter from interactive investor

Two commodity funds have traded place in our monthly investment trust bestseller list, with CQS Natural Resources G&I Ord  CYN

 entering while BlackRock World Mining Trust Ord  BRWM slips out.

CYN, which holds shares and bonds of companies across the mining and resources sectors, moves into the list in seventh place. 

The fund has had an eventful year, both via the substantial ups and downs seen in the commodities sector and via a change of investment manager.

The trust’s portfolio managers Keith Watson and Robert Crayfourd left their employer earlier this year and the board has since opted to reinstate them now that they have moved to Tufton Investment Management. The pair will be in post from 14 September.

The fund has quite the range of different exposures, with precious metals accounting for around 39% of the portfolio, and oil and gas almost 30%. It also has exposures to uranium, shipping and base metals among other areas. Performance has been choppy although the trust’s shares have still returned around 27% so far in 2026.

Rising yield

Beyond that, we see the same names in the list, with a combination of high-yielding trusts and more growth-oriented offerings. But it’s a trust from the first camp rising to the top of the list.

Greencoat UK Wind  UKW

which moves into the top spot, is a popular name from a troubled sector. Its shares have recovered aggressively so far in 2026, in part thanks to renewables getting more of the limelight amid the conflict in the Middle East.

And it still stands out on some of the fronts that bargain hunters and income investors value, from a 17% share price discount to net asset value (NAV) to a share price dividend yield of nearly 10%.

One other renewables fund sits in the list, in the form of Renewables Infrastructure Grp  TRIG

It yields roughly the same and has produced pretty much the same share price return so far in 2026, but does have a slightly more diversified portfolio. Onshore wind accounts for 47% of the fund, with offshore wind on 32%, solar on 13% and battery storage on 8%.

Sticking with the dividend focus, either two or three equity income funds sit in the list, depending on how one defines them.

There’s Henderson Far East Income Ord  HFEL

whose yield currently stands at 9.5%. As the performance table indicates, the fund has benefited handsomely from a rally for its market of choice, although it has tended to lag rival Asian equity income trusts.

HFEL’s manager did speak to us a few weeks ago, making the argument that the portfolio was lagging thanks to a more defensive approach than the competition. That, in theory, might protect it if an artificial intelligence (AI)-led rally in the region were suddenly to go sideways.

August’s bestseller list, which focuses on real-time buys and thus gives a sense of investors’ more tactical and timely choices, also contains the UK income favourite City of London Ord  CTY

The fund, which holds UK large-cap shares, has tended to please investors with its now 60-year record of increasing its dividend.

The shares do still offer a yield of 3.8%, even as this has been squeezed by strong returns, although investors might note that the shares trade on a modest premium to NAV.

Another equity income fund in the list, if an unconventional one, is JPMorgan Global Growth & Income Ord  JGGI

It has a so-called enhanced dividend policy, where it pays out around 4% of its NAV a year and funds this from capital rather than having to buy stocks with high yields.

The fund has tended to take a flexible approach when it comes to investment style although its top 10 holdings list does include plenty of “growth” stalwarts, from NVIDIA Corp  NVDAto Amazon.com Inc  AMZN Microsoft Corp MSFT, Alphabet Inc Class A and Taiwan Semiconductor Manufacturing Co Ltd ADR TSM.

Growth plays

Investors are going more obviously out for growth via other names in the list. Take F&C Investment Trust Ord  FCIT

which doesn’t deviate too much from its FTSE All-World benchmark index bar an 11.2% allocation to private equity. It has generated very respectable returns, even if it is slightly behind the FTSE All-World so far in 2026.

Investors are meanwhile sticking with some punchier names, too. Scottish Mortgage Ord  SMT

which has ridden high this year thanks to its early exposure to Space Exploration Technologies Corp Class A  SPCX 

but will most likely be looking to reduce its now sizeable allocation to the company, sits in second place. SpaceX accounted for 18.1% of the fund at the end of July, with TSMC on 6.9% and Nvidia on 5.5%. Private companies ByteDance and Anthropic also sit in its top holdings list.

Polar Capital Technology Ord  PCT

which has done well versus rivals this year in part thanks to its emerging markets exposure, slips from the top spot to third place. And an especially punchy name, Seraphim Space Investment Trust Ord  SSIT slides down to 10th place.

Top 10 most-popular investment trusts in August

RankingInvestment trustChange from JulyOne-year total return (%) to 31 AugustThree-year total return (%)
1Greencoat UK Wind UKW0Up 3121.5
2Scottish Mortgage Ord SMT0.0Unchanged39124.7
3Polar Capital Technology Ord PCT0.4Down 264.8190.3
4Henderson Far East Income Ord HFEL0.Down 126.467.3
5City of London Ord CTY0.5Up 122.268.8
6Renewables Infrastructure Grp TRIG0.Up 210.6-7.6
7CQS Natural Resources G&I Ord CYN0.2New95.4182.6
8F&C Investment Trust Ord FCIT0.2Down 319.865.9
9JPMorgan Global Growth & Income Ord JGGI0.Unchanged14.450.3
10Seraphim Space Investment Trust Ord SSIT0.7Down 3161.5308.7

Source: FE. Top 10 is based on the number of buys in August. Past performance is not a guide to future performance.


The most-bought funds and investment trusts in August

The four most-bought funds on Fidelity during August were all global tracker funds, with Lazard Emerging Markets Fund the highest-ranking fund that reflected anything other than a global equity strategy.

Investment trust exposure was more varied, with some of the top picks pointing towards strategic exposure to regions like Japan, asset classes like private equity, or renewable energy.

FundsInvestment Trusts
Fidelity Index World FundSchroder Japan Trust (LON:SJG)
Legal & General Global Equity Index FundCity of London Investment Trust (LON:CTY)
Vanguard FTSE Global All Cap Index FundJPMorgan Global Growth & Income (LON:JGGI)
HSBC FTSE All World Index FundPersonal Assets Trust (LON:PNL)
Lazard Emerging Markets FundPatria Private Equity Trust (LON:PPET)
Fidelity Multi Asset Allocator Growth FundTemple Bar Investment Trust (LON:TMPL)
Legal & General S&P 500 US Equal Weight Index FundGreencoat UK Wind (LON:UKW)
UBS S&P 500 IndexJPMorgan European Growth & Income (LON:JEGI)
Fidelity Special Situations FundBlackRock American Income Trust (LON:BRAI)
Artemis SmartGARP Global Equity FundTwentyFour Income Fund (LON:TFIF)

Senior Writer Dan McEvoy

MoneyWeek is part of Future plc, an international media group and leading digital publisher. 

Your Snowball

You only have limited funds, so you cannot buy a diversified portfolio.

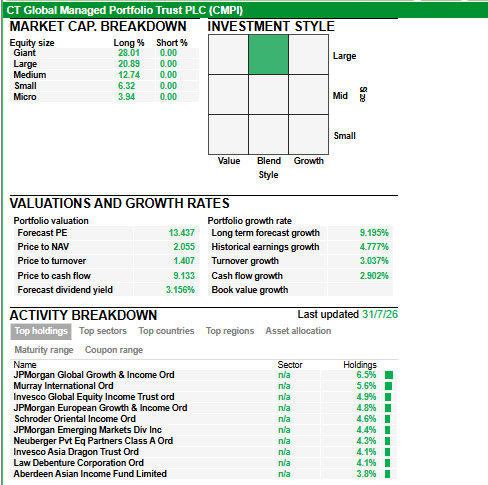
If you bought CMPI, when markets gyrate you could lose some of your capital but the share and the yield appears to be ‘Safe’.

The portfolio is an income portfolio but tilted more to a growth strategy rather than a high yield portfolio.

If after you buy the price falls and the yield rises you could re-invest the dividends back into CMPI, if not re-invest into a higher yielder where in time you will achieve a balanced yield of plus 7%.

Across the pond

Tariffs, Midterms, Soaring Bond Yields: This 8.8% Dividend Thrives on Chaos

Brett Owens, Chief Investment Strategist
Updated: September 1, 2026

It’s September—traditionally the weakest month for stocks—and we contrarians are responding.

We’ve got the (ugh!) midterms coming up. Tariff unpredictability has returned. And scorching long-term bond yields have (so far) resisted Treasury Secretary Bessent’s efforts to rein them in.

Let’s be honest: Things are going to get volatile.

Our plan? Go on offense and defense at the same time.

Of course, income is at the center of our strategy. We’re tapping market choppiness with an 8.8%-paying fund that loves volatility and sports a payout that gets stronger the longer the chaos lasts.

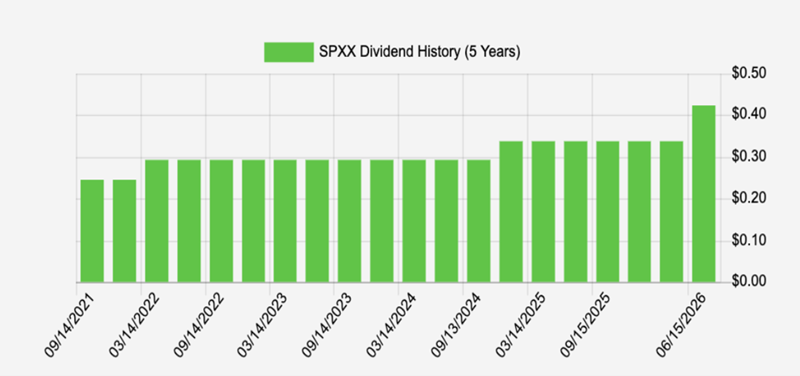
In fact, this fund—the Nuveen S&P 500 Dynamic Overwrite Fund (SPXX)—is already hiking payouts, to the tune of 25% with the July payment.


Source: Income Calendar

SPXX, which we’ll get back to in a second, is our defensive play here, though with the discount it’s sporting (more on that in a sec), I see upside to go along with that high payout.

But our real offensive play begins if, as history suggests, the market throws a fit in the coming weeks. That’ll put some of our favorite dividends on sale, including a pipeline that’s gushing cash (sorry, couldn’t resist!), thanks to AI’s bottomless power demand.

Before we get to that, let’s rewind for a second.

September the Cruelest Month? Not for Contrarians!

Back to September. For whatever reason, stock markets tend to wobble during the month, with a negative 1.1% return on average since 1890, according to numbers from Morningstar.

But of course, there are exceptions: The last two Septembers, for example, were strong, up 3.6% last year and 2.1% in 2024.

This is why we never sell solely on seasonal indicators like this: We don’t want to be caught out in an outlier year! And, of course, we do not want to cut off our dividends.

Which brings me back to SPXX.

Step 1: Grab 8.8% Dividends From This “Volatility-Loving” SPY Clone

You don’t have to spend much time looking at SPXX to see that it holds mostly the same stocks as the popular S&P 500 index fund, the State Street SPDR S&P 500 ETF Trust (SPY).

That’s by design: Nuveen has set up SPXX—a closed-end fund (CEF), to be specific—so investors can buy in essentially without having to sell the blue chips they already own.

That matters because of three other things that set SPXX apart.

The first is that the fund sells call options; these give the buyer the right to buy SPXX’s stocks at a fixed future price and date. No matter what happens with these trades, the fund keeps the fee it books for setting them up.

This strategy does best in volatile markets, but there is a drawback: It can cap returns when stocks rise (which is why I don’t recommend holding SPXX for the long term). But that’s something we’re willing to trade off right now.

SPXX’s option fees help fuel that 8.8% payout—the second key difference from SPY, which pays a sad 1%.

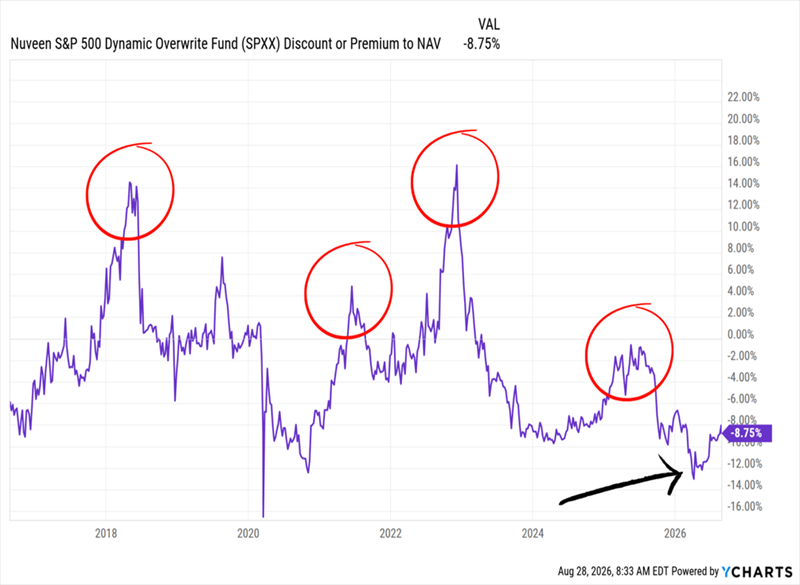
And here’s the third thing: Unlike ETFs, CEFs can (and often do) trade at different prices in relation to their portfolio value. When the price is below that value, it’s called a discount to net asset value (NAV).

SPXX Sells Cheap, Gets Set for the Next Market Storm

Look at this chart for a moment: You can see that the fund’s discount has narrowed, and even flipped to a premium, every time volatility has flared in recent years, as it did in the 2018 rate panic, the late-2021 pullback, the 2022 dumpster fire and the “tariff tantrum” early last year.

Now, we can see that the discount—a deep 8.8% as I write this—has stopped widening and is starting to narrow again as September dawns. Perfect!

Step 2: Put This Pipeline at the Top of Your Buy List

Which brings me to the second part of our strategy: Get set to buy our favorite dividends on the dip. At the top of our list? Pipelines.

Kinder Morgan (KMI) is one of the largest energy infrastructure companies in North America, with over 80,000 miles of pipelines and 140 terminals.

The company moves 40% of the natural gas produced in the US, and it gets paid no matter the price. That puts it in the “sweet spot” for fueling (literally!) data centers’ bottomless power demand.

It’s showing up in KMI’s financials: In the second quarter, net income hit $867 million, an all-time high for Q2. Adjusted EPS soared 32%. No wonder the company is doubling down on its business: It currently sports a $9.6-billion project backlog, with nearly all of that going to natural-gas infrastructure.

Management, for its part, is hurriedly shoveling these “tolls” over to investors as dividends. That move is likely made easier by the fact that the C-suite owns 13% of the company (with Executive Chairman Richard Kinder owning the bulk of that)—and human nature being what it is.

We’re okay with that, and are more than happy to see management’s interests aligned with ours.

As I write this, the stock yields 3.7%, which is a good start. Then there’s the dividend-growth story, which has gotten a lot happier in recent years.

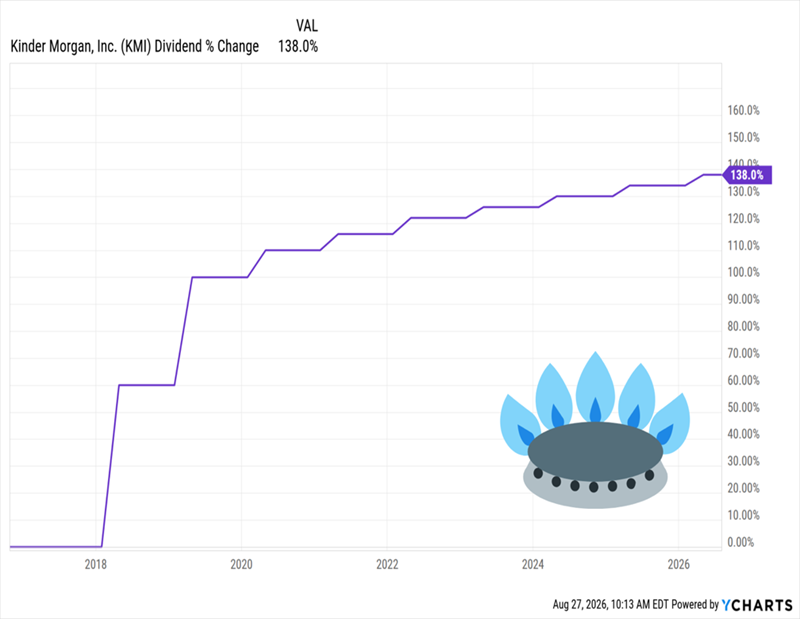
Kinder, you might recall, was in the “dividend doghouse” for years following a 75% payout cut in 2015. Investors were slow to forgive, but management kept trying, quietly rebuilding the payout. It’s now up 138% from right after the cut.

KMI’s Dividend Reignites

As I write this, the stock trades at 20-times earnings, around its five-year average. That’s a good multiple for a firm with lots of strengths, including that hefty backlog.

The dividend? It’s well covered at 72% of free cash flow. That is above the 50% level I look for in stocks, but a pipeline like KMI is different, as its “tolls” roll in predictably, letting management pass more of them to us.

The bottom line? KMI is attractive now, and a “September dip” would make it more so. That leaves us with a nice setup: Buy some KMI now, and some on the next dip—and “pair” it with our volatility-fueled 8.8% SPXX dividend as you do.

Watch List: CMPI

From:     CT Global Managed Portfolio Trust PLC (the ‘Company’)

Information disclosed in accordance with Disclosure Guidance and Transparency Rule 4.1.3

Statement of Audited Results for the year ended 31 May 2026

Growth Shares – 2026 Highlights

–     Share price total return(1) per Growth share of +25.6% for the financial year (2025: +1.6%).

–     Share price total return per Growth share of +117.4% in the 10 years to 31 May 2026, the equivalent of 8.1% compound per year(1).

Income Shares – 2026 Highlights

–     Annual dividend of 7.85p per Income share (2025: 7.60p), an increase of 3.3%.

–     Over the last three financial years the total annual dividend has increased by 9.0%, as compared to CPI of 8.4%.

–     Dividend yield(1) of 6.0% at 31 May 2026 (2025: 6.6%), based on total dividends for the financial year of 7.85p (2025: 7.60p) per Income share. Dividends are paid quarterly.

–     Share price total return(1) per Income share of +21.2% for the financial year (2025: +3.8%).

Chairman’s Statement

“We have listened carefully to what matters most to shareholders and, as a result, have undertaken a number of initiatives. Whether through clearer performance reporting, protecting income against inflation, providing a more convenient dividend payment schedule or making fuller use of existing features of the Company’s investment policy, each initiative is designed to improve the experience and outcomes for our shareholders.”

Dear Shareholder

Thank you for your ongoing investment in CT Global Managed Portfolio. Together with our Manager, Columbia Threadneedle Investment Business Limited, we continually focus on outcomes for shareholders and seek to make improvements when appropriate.

As part of this commitment, we have undertaken a number of important initiatives:

•    To make performance easier for shareholders to understand, we are replacing our single benchmark with three complementary comparators providing a more relevant view of investment performance.

•    To help protect Income shareholders’ purchasing power, we will aim to increase dividends by at least the rate of inflation as measured by the UK Consumer Price Index (‘CPI‘) over rolling three-year periods (based on financial years).

•    To better align with Income shareholders’ day-to-day finances, we intend to pay dividends monthly rather than quarterly, starting from the next financial year.

•    To enhance shareholders’ total return potential, the Investment Managers intend to make fuller use of the existing features of the Company’s investment policy, including using the borrowing facility in both Portfolios.

We believe these developments will benefit shareholders and support CT Global Managed Portfolio’s long-term success. You can find more information on each of these initiatives, along with other updates, within this Chairman’s Statement.

The SNOWBALL

Income for the SNOWBALL at the end of the third quarter will be

£10,287.00.

Income at the end of 2026 should beat the 2031 target, depending on any dividends earned but not paid until January 2027.

Next year’s fcast is the 2031 figure and the target the 2032 figure.

The rules for the SNOWBALL

For any new readers, there are only 3 rules.

Rule 1.

Rule 2.

Rule 3.

Once your share has earned some dividends and you re-invest those dividends back into your snowball, even if you have to sell at a loss, you will in time earn back those losses from the re-invested dividends. If you re-invest your dividends back into the share in your snowball, any loss will sit in your account forever.

Which REIT fits your strategy ?

AGNC vs NLY vs MFA — Mortgage REIT Comparison

Takeaway: AGNC and NLY are the two large‑cap agency mortgage REITs with similar risk profiles (pure agency MBS, high leverage, rate‑sensitive), while MFA is a smaller, credit‑focused hybrid REIT with materially lower leverage, deeper discounts to book, and the highest headline yield. AGNC/NLY = stability; MFA = value + credit risk.

Below is a clean, structured, side‑by‑side comparison using the latest 2026 data from the search results. (All figures sourced from the pages above: AGNC , NLY, MFA .)

📊 AGNC vs NLY vs MFA — Mortgage REIT Comparison

AGNCAgency MBSNLYAgency MBSMFACredit-focused hybrid
Valuation
Price/Book1.191.150.50
Market Cap$12.9B$17.4B$0.89B
Leverage
Debt/Equity7.177.386.57
Net Debt/Equity5.647.356.49
Profitability
ROE19.8%19.6%8.2%
ROA2.02%2.33%1.17%
Net Margin94%91%49%
Dividend
Dividend Yield13.24%12.95%16.36%
Payout Ratio76.5%75.8%143%
Risk Metrics
Beta1.301.241.50
Price Volatility (52w)+11.7%+9.9%-9.6%
Business Mix
Portfolio TypePure AgencyPure AgencyCredit + Non‑QM + MSR
Book Value TrendStableStableVolatile

Sources:

🧭 Interpretation — What the numbers actually mean

1. AGNC — High‑yield, high‑leverage agency specialist

  • Pure agency MBS → no credit risk, but extreme rate sensitivity.
  • ROE ~20% is strong for an agency REIT.
  • Dividend yield ~13% with payout ratio ~76% → reasonably covered.
  • Trades near book (1.19× PB), signalling investor confidence.
  • Best fit: income + relative stability within the mortgage REIT universe.

2. NLY — The benchmark agency REIT

  • Largest, most diversified funding base.
  • ROE ~19.6% and ROA highest of the three.
  • Dividend yield ~13% with similar payout ratio to AGNC.
  • PB 1.15× → slightly cheaper than AGNC.
  • Best fit: income + scale + liquidity.

3. MFA — Deep‑value credit REIT with highest yield

  • PB = 0.50× → trades at a huge discount to book.
  • Yield = 16.36%, but payout ratio = 143% → not fully covered.
  • Credit‑heavy portfolio (non‑QM, whole loans, MSRs) → more credit risk, less rate sensitivity.
  • ROE only 8.2% → materially lower profitability.
  • Best fit: maximum yield + value, but with higher risk.

🧩 Which fits your strategy?

If your priority is maximum income

→ MFA

  • Highest yield (16%+)
  • Deep discount to book
  • But dividend coverage is weak and credit risk is meaningful.

If your priority is income with stability

→ NLY

  • Largest balance sheet
  • Slightly lower volatility than AGNC
  • Strong ROE and well‑covered dividend.

If your priority is high yield + strong dividend coverage

→ AGNC

  • Yield ~13%
  • Payout ratio ~76% (best coverage of the three)
  • Very clean agency book.

🔍 Non‑obvious insight

MFA’s huge discount (0.50× book) is not simply market pessimism — it reflects the fact that credit REIT book values are harder to mark and more volatile. AGNC/NLY trade near book because agency MBS valuations are transparent and liquid. So MFA’s discount is structural, not just an opportunity.

AI generated so as always DYOR before investing your hard earned.

The SNOWBALL is going to build a position in AGNC. If/when interest rates rise the price may fall and the yield rises, which would be a positive for the SNOWBALL.

XD Dates this week

Thursday 3 September


abrdn European Logistics Income PLC ex-dividend date
Foresight Environmental Infrastructure Ltd ex-dividend date
Globalworth Real Estate Investments Ltd ex-dividend date
Hammerson PLC ex-dividend date
MIGO Opportunities Trust PLC ex-dividend date
Utilico Emerging Markets Trust PLC ex-dividend date

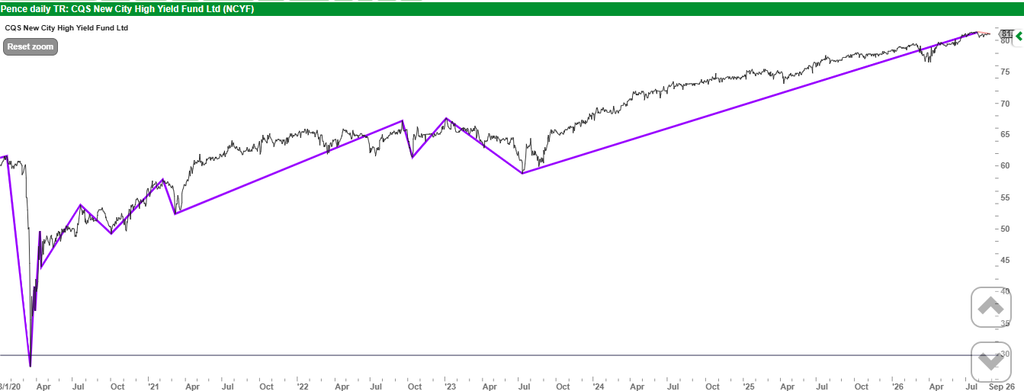
NCYF buying the yield.

Everyone bone in your body would be telling you not to trade but having done your research you have been waiting for Mr. Market to give you a life changing opportunity.

Not only have you achieved the holy grail of investing, the chart includes income but not re-invested back into the Trust but into your snowball, where you would be earning more dividends to buy more shares that pay dividends.

The next time you read timing doesn’t matter but only timein, you can have a quiet smile to yourself.

« Older posts Newer posts »

© 2026 Passive Income Live

Theme by Anders Noren — Up ↑