Passive Income Live

Investment Trust Dividends

Page 4 of 440

UKW

Results analysis: Greencoat UK Wind

2026 has so far seen an improvement for UKW on a number of metrics.

William Heathcoat Amory

Updated 30 Jul 2026

Disclaimer

Disclosure – Non-Independent Marketing Communication

This is a non-independent marketing communication commissioned by Greencoat UK Wind (UKW). The report has not been prepared in accordance with legal requirements designed to promote the independence of investment research and is not subject to any prohibition on the dealing ahead of the dissemination of investment research.

  • The first half of 2026 has been a positive period for UKW, supported by strong cash generation and a modest increase in NAV. Total shareholder return for H1 2026 was +9.2% (or +4.4% based on NAV), with dividends contributing to the majority of that return.
  • UKW’s NAV increased modestly by 0.6p per share over the period, reflecting the conversion of strong operational performance into cash. Net cash generation for the period was ahead of budget at £221.6 million, resulting in dividend cover of 1.9x for the period. This derives from electricity generation of 3,003 GWh, being 4.9% above budget, as well as favourable realised power prices. Net cash generation is now on course to be towards the top end of the £350-410m guidance for 2026.
  • The share price discount to NAV, which has not appreciably narrowed over the period, does not in the Board’s view reflect the strength of the business. The discount persists mainly due to macroeconomic and sector-wide pressures, including higher interest rates, policy uncertainty and an oversupply of listed renewable infrastructure vehicles. We are beginning to see some of these pressures ease, notably with the shrinking of the listed renewable trust sector. At this year’s AGM, 97.1% of shareholders voted for the continuation of the company.
  • Over the interim period, UKW refinanced £200m of 2026 debt maturities with new long-dated facilities provided by its existing lending group, with maturities now extended across 2032-34. The continued ability to place long-term debt demonstrates the durability of UKW’s financing model and the strength of its relationships with lenders.
  • UKW’s Board retains a clear approach to capital allocation, prioritising dividends alongside reinvestment of excess cash. The board has a 2026 dividend target of 10.7p per share, the thirteenth consecutive inflation linked increase. Beyond the dividend, the Group has also continued to strengthen its balance sheet, and has repaid £53.5m of debt during the period. Looking ahead, the Board continues to emphasise the importance of reinvestment to further sustain the Company’s dividend over the long term; renewable infrastructure assets are inherently finite, and maintaining the long term cash generating capability of the portfolio requires ongoing reinvestment. In this context, the Investment Manager has continued to evaluate a range of opportunities on behalf of the Company, with a focus on selective transactions that enhance risk adjusted portfolio returns.
  • Lucinda Riches, Chairman of UKW, commented “The outlook for UK wind remains attractive…as one of the largest owners of operational UK wind farms, UKW’s portfolio is well positioned to continue delivering both secure electricity and long-term cash flows for shareholders.”

Kepler View

2026 has so far proved to be significantly more positive for Greencoat UK Wind (UKW) than 2025, and we note an undercurrent of quiet confidence from the manager’s presentation for the interim results. UKW has a simple model, which puts the trust in a strong position to be a survivor over the short term, and over the long term a valuable constituent of diversified portfolios – for institutions and retail investors alike. UKW’s long standing attributes that underpin its position are that the trust is an attractive proposition at scale (gross assets of c. £5bn), it has a self-sustaining financial model ( long term dividend cover of 1.8x forecast over 2027-31), and that there is low execution risk in the trust continuing to deliver returns into the future, given the strategy is to keep doing what the trust has done for the past 13 years, and does not require a transformational pivot to continue to deliver for shareholders.

Fundamentally, UKW’s proposition remains faithful to its original design, having paid a covered, inflation-linked dividend for the last 13 years. Dividend cover is the key to UKW’s attractions in our view, given it gives the board so much flexibility to deploy capital to the advantage of shareholders. With net cash generation +36% for the six months to 30/06/26 over the same period last year, dividend cover has significantly improved (1.9x for the six months to 30/06/26). Responding to higher energy prices, the managers locked in 20% of annual electricity production for the year ahead at the interim stage, meaning that around 66% of UKW’s revenues for the remainder of the year are now fixed. The team commented that since the half year end, prices for a further 10% of production had been subsequently locked in, mainly in 2027. The managers note that this is not a change in policy, but more a tactical move taking advantage of higher prices. In our view, this should give confidence to shareholders that the target dividend for the year is effectively ‘in the bag’, and that for the full year, there will be significant excess cash for capital allocation.

The team have guided their expectations are that UKW should throw off c. £120-180m of surplus capital for the current financial year. In terms of uses of this capital, we understand that the board and manager are focussed on disciplined reinvestment which is key to delivering long term cashflows to shareholders, having already repaid £30m of the RCF. UKW’s gearing, at 41.7% is marginally higher than the board’s sub-40% target. The successful refinancing of maturing debt is good news for shareholders, and the team highlight that they expect further refinancing activities will be announced later this year. Progressive debt reduction is one source of surplus cash, but with c. £45m re-paid each year from the Hornsea 1 specific loan, the team suggested achieving the sub-40% target may be a medium-term feature, reached through debt repayments but also through re-investment in the asset base to grow the GAV.

UKW’s target dividend yields 9.8% at the current share price. The portfolio discount rate, less annual charges, implies a NAV total return of c 10.7% per annum. As with any investment there are risks that anticipated returns will not be achieved, and one specific risk for UKW shareholders is the threat of politics. That said, with an anticipated doubling of electricity demand to 2050 (NESO Future Energy Scenarios 2025), wind farms are well positioned to make a strong contribution to an increase in supply, being lower cost and emitting zero-carbon at the same time. Any UK government must in our view be careful not to frighten off private capital, which is key to delivering transformational change for voters.

UKW is projected to have c. £1bn of surplus capital available to invest over the next five years, and so the trust could be a meaningful participant in helping to meet the UK’s future energy demands. At the same time, shareholders stand to benefit from any future price spikes caused by geopolitical instability, which the managers observe is becoming an increasing feature of markets. In this regard, UKW potentially offers an appealing package from a portfolio context: the prospect of attractive returns from a base-case scenario, potentially also offering a hedge to energy price rises in the future. With the shares trading on a discount to NAV of c 18% and corporate activity continuing within the sector, a further narrowing of the discount cannot be ruled out.

GCP Infra

GCP Infra Strengthens Balance Sheet Through Asset Sales and Debt Reduction

Fiona Craig

LSE:GCP

03 August 2026

© Adobe Stock Images

GCP Infra (LSE:GCP) reported a net asset value (NAV) of 98.60 pence per share as of 30 June 2026, supported by a diversified portfolio of 47 infrastructure investments with a combined value of £810.4 million. The portfolio delivers a weighted average annualised yield of 8.0% and has an average remaining life of 11 years, with many assets benefiting from partial inflation-linked income.

The company also confirmed that its online investor portal has been updated with the latest quarterly valuation data, giving shareholders greater transparency into the composition and performance of the portfolio.

Capital Recycling Enhances Liquidity

During the period, GCP Infra continued to strengthen its financial position through a series of capital management initiatives. Borrowings under its revolving credit facility were reduced from £24.0 million to zero, while the company repurchased more than 19 million of its own shares, leaving it with only a modest level of net debt.

The investment company also completed several portfolio optimisation transactions, including introducing third-party financing into its solar assets, which generated approximately £40 million in additional cash. It further completed the sale of an anaerobic digestion project and two onshore wind assets at prices above their previous carrying values, improving liquidity while crystallising value for shareholders.

Stable Financial Position Supports Outlook

GCP Infra’s outlook continues to be supported by a conservative balance sheet, improving cash generation and favourable technical market indicators. These strengths are complemented by shareholder-friendly capital allocation policies, including share buybacks and a stable dividend.

However, revenue trends have been mixed in recent periods, while the company’s valuation remains relatively demanding despite its attractive dividend yield. Even so, management believes the portfolio’s defensive characteristics and disciplined capital management provide a solid foundation for long-term returns.

About GCP Infrastructure Investments Ltd

GCP Infrastructure Investments Ltd is a FTSE 250-listed closed-ended investment company focused on infrastructure debt and related assets across the UK. Its portfolio primarily consists of projects backed by long-term public sector or availability-based revenue streams, with many investments offering partial protection against inflation.

The company has also been awarded the London Stock Exchange’s Green Economy Mark in recognition of the positive environmental contribution of its investment portfolio.

This article was written by the editorial team at InvestorsHub/ADVFN and is provided for informational purposes only.

XD Dates this week

Thursday 6 August


Aberforth Smaller Cos Trust PLC ex-dividend date
AEW UK REIT PLC ex-dividend date
Custodian Property Income REIT PLC ex-dividend date
CVC Income & Growth EURO Ltd ex-dividend date
CVC Income & Growth GBP Ltd ex-dividend date
Dunedin Income Growth Investment Trust PLC ex-dividend date
EJF Investments Ltd ex-dividend date
GCP Infrastructure Investments Ltd ex-dividend date
Global Smaller Cos Trust PLC ex-dividend date
Marwyn Value Investors Ltd ex-dividend date
Monks Investment Trust PLC ex-dividend date
Murray Income Trust PLC ex-dividend date
Northern Venture Trust PLC ex-dividend date
Polar Capital Global Healthcare Trust PLC ex-dividend date

Dividend heroes vs enhanced income

Dividend heroes vs enhanced income: which approach is best?

Faith Glasgow compares two different investment trust approaches that look to appeal to income-seekers, particularly those approaching or in retirement.

29th July 2026

by Faith Glasgow from interactive investor

A fan of British banknotes 600

You might be approaching retirement and looking for an income stream, or keen to take a more “total return” approach to investing that incorporates dividends as well as capital gains; either way, investment trusts are a natural choice of collective investment.

That’s partly because of their listed company structure, which allows them to withhold some of the dividend distributions they receive from underlying companies and build up reserves; these can be used to supplement payouts to shareholders in years when there’s a shortfall of “natural” dividend income.

But it’s also because trusts are allowed, if they wish, to finance distributions from capital gains as well as natural income (and reserves). That ability has become increasingly popular with investment trust boards over the past decade or so, as trusts have become more attractive and accessible to retail investors managing retirement portfolios.

Some boards have taken the opportunity to introduce policies that will give shareholders greater certainty in regard to the income they can expect. This may involve trusts dipping into capital if necessary to meet their income ambitions.

A number of trusts, including JPMorgan Global Growth & Income Ord  JGGIThe European Smaller Companies Trust PLC  ESCTand Polar Capital Global Financials Ord PCFT, have introduced “enhanced dividend” policies aiming to pay out a set percentage of the trust’s net asset value (NAV), say 4%, each year.

Others, such as Mercantile Ord MRC

 and Murray International Ord  MYI have no target yield but simply aim to keep annual dividend growth ahead of inflation.

At the same time, there’s a high-profile movement led by the Association of Investment  Companies (AIC) in the shape of the “dividend heroes” – the rising number of trusts that have chalked up 20 or more consecutive years of dividend growth.

The longest-running heroes have almost 60 years of growing dividends under their belts. The AIC has further encouraged the trend with the “next generation” dividend heroes – those with between 10 and 20 years of payout growth.

    Dividend hero status is highly prized, and trusts that achieve it are unlikely to cut a dividend if they can possibly avoid it, so investors in those trusts can feel pretty sure of continuing growth in distributions in the coming years.

    However, both approaches to improving income security have their critics. 

    So, what are the pros and cons of each, and which strategy do the experts ultimately favour?

    Enhanced dividends: ‘robbing Peter to pay Paul’?

    The big plus about an enhanced dividend policy is that it frees up fund managers to invest in the best stocks for total returns, even if they have a low or no yield, rather than having to restrict themselves to those paying decent distributions.

    Emma Bird, head of investment trust research at Winterflood, argues that the capacity to deliver “a higher level of income from an unconstrained investment approach” may in turn stimulate a benign investment circle. “It can help to attract new investors, which can support the fund’s rating.”

    She points to JGGI as a good example of a successful enhanced dividend approach that has broadened the trust’s appeal for private investors. It pays out at least 4% of NAV a year, “while the investment approach remains unconstrained and style-agnostic, which has helped the fund to generate alpha in a range of market conditions”.

    For Thomas McMahon, head of investment company research at Kepler Partners, such a policy really comes into its own across sectors that don’t traditionally pay dividends.

    “For instance, investors can now draw an income while being invested in biotechnology, smaller companies and private equity, so the possibilities for diversification and generating growth as well as an income have expanded,” he explains.

      However, Job Curtis, manager of the dividend ‘superhero’ City of London Ord  CTY

      trust, is among those who have criticised enhanced dividend policies as “robbing Peter to pay Paul” – effectively dipping into the capital gains prized by growth investors to ensure generous payouts for income seekers.

      This could therefore deter growth investors, although James Carthew, head of investment company research at QuotedData, argues that it’s not an insurmountable issue if a dividend reinvestment plan is in place to enable them to roll up their gains within the trust.

      McMahon makes the additional point that the process of moving away from an equity income strategy could in itself be a negative. “Equity income investing involves identifying some highly attractive characteristics: companies which can generate spare cash and grow that spare cash consistently could be attractive investments, particularly for those who are looking for steady compounding growth.”

      There is therefore much to be said for a traditional approach in markets with a decent, diversified spread of high-yielding stocks, he suggests.

      Bear market challenges

      There are undoubtedly potential drawbacks to the enhanced dividend approach in some market conditions. The UK hasn’t seen a sustained bear market for a long time, but Carthew warns that “there are plenty of reasons why we might be approaching one”.

        As Bird points out, an enhanced dividend policy in such a scenario would result in “either a reduction in dividends (based on a lower NAV) or a need to sell more holdings at lower prices to maintain or grow distributions”. That’s far from ideal, especially for growth-oriented shareholders.

        An associated risk is that the sort of growth sectors that don’t pay dividends (but might be favoured for an enhanced dividend approach) may be more volatile and therefore lose more in falling markets. Income investors accessing these areas through trusts with enhanced dividend policies “need to think about their attitude to risk”, warns McMahon.

        Dividend heroes: low yields and token increases?

        The dividend heroes concept is a great piece of marketing and a valuable tool for investors to assess the likely reliability of a trust’s income stream.

        As Bird explains: “We would expect most boards classified as dividend heroes to be keen to demonstrate their commitment to continued regular dividend growth, and to utilise revenue reserves when necessary to maintain this record as far as possible.”

        However, one grumble around heroes is the fact that some have made only minimal increases to dividends in recent years, thereby ensuring their status is maintained but certainly not providing investors with inflation-beating income.

        For McMahon, this could actually be a benefit rather than a detraction, as it indicates prudent housekeeping. “One justification for investing in dividend-paying stocks is that a regularly increased dividend is a sign of a well-run company. The same could be said of some of the investment trusts which make small increases each year,” he suggests.

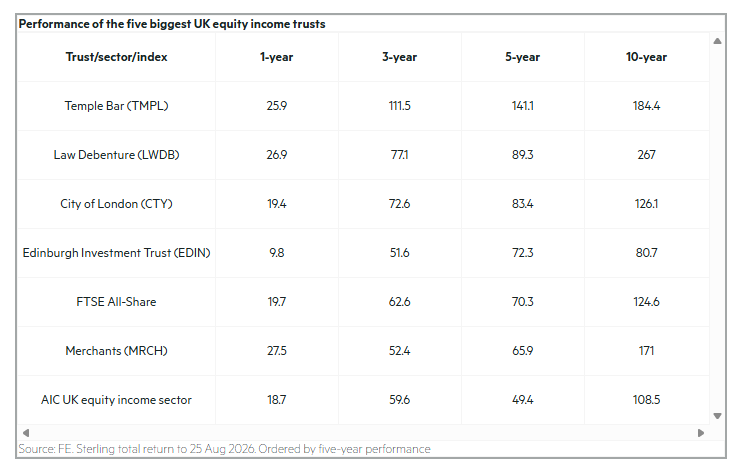
          Carthew agrees tokenism is a risk, but he too points to contrary arguments that indicate management strength, even at the expense of dividend hero status. “Temple Bar Ord  TMPL

           is a good example of the opposite stance,” he says. The trust cut its dividend to a more manageable level when management was taken over by Redwheel in 2020, losing its status as a dividend hero.

          “But that move gave the managers more flexibility to buy recovery stocks on low to no yields. The reward has come in great performance and a rising dividend that surpassed the previous peak some time ago.”

          In Bird’s experience, most dividend hero boards – certainly those with an income mandate – in practice “recognise the importance of delivering dividend growth ahead of inflation over the long term”.

          Another, arguably more pervasive, concern is that uninformed investors may be confused by the fact that dividend hero status is based on growth rather than yield. Four of the 20 current dividend hero trusts yield under 2%, while eight of the 30 next generation heroes are yielding less than 3%.

          In effect these are trusts with a focus on capital growth or total returns that are making modest but rising distributions to shareholders.

          Bird highlights dividend hero Scottish Mortgage Ord  SMT

           as a particular example. “It has 44 consecutive years of dividend growth, but its investment approach is purely focused on investment in growth companies, and its dividend yield currently stands at just 0.3%,” she points out.

          That’s fine, so long as you understand that you’re buying long-term growth and a small but secure payout, not an income-oriented investment.

          Importantly, if you’re seeking income from a fund, pay attention not just to its dividend hero status but also to its dividend yield, investment policy and approach, and long-term dividend growth rate.

          Conclusion

          So, is there a preference among the experts for dividend heroes or enhanced dividend policies? The consensus is that both are valuable approaches, but the best option will depend on the individual investor.

          Carthew notes that value investing tends to outperform growth investing over the very long term, so for younger investors seeking long-term growth, dividend hero trusts make more sense. “A sensibly managed natural income trust without too high a yield target might deliver the best overall long-term returns.”

            Income investors should consider where they plan to invest as a first step, points out McMahon. “Core income sectors with well-established dividend cultures are probably better invested in with a natural income approach, to benefit from the steadiness of operational performance underlying the income generation,” he says.

            Dividend hero status is a valuable plus in this context. Conversely, enhanced dividend payouts can vary as NAV fluctuates, so they’ll be less reliable.

            In the end, both strategies can work well for investors, but you do have to do your homework and delve beneath the alluring headlines to understand what you’re really investing in.

            ORIT

            Octopus Renewables Infrastructure Trust Reports Lower NAV Following Wind Portfolio Revaluation

            Fiona Craig

            LSE:ORIT

            03 August 2026

            © Shutterstock

            Octopus Renewables Infrastructure Trust (LSE:ORIT) announced an unaudited net asset value (NAV) of £454.7 million, or 86.18 pence per share, as of 30 June 2026, compared with £491.5 million, or 93.15 pence per share, at the end of March. The change represents a negative NAV total return of 5.8% over the quarter. The decline reflects lower long-term electricity price assumptions, a reduction of around 10% in projected energy production across the trust’s onshore wind assets, and higher discount rates, partially offset by more favourable macroeconomic assumptions and longer expected operating lives for certain assets.

            Onshore Wind Review Reshapes Portfolio Valuation

            According to management, the reassessment of its onshore wind portfolio reduced NAV by £30.4 million after replacing pre-construction production estimates with operational performance data. While the revision negatively affected valuations, the trust believes it provides a more realistic and resilient assessment of the portfolio’s long-term value.

            The company also revised the expected operating lifespan of selected onshore wind farms and updated decommissioning cost assumptions to better reflect current market standards. Gearing increased to 46.6% of gross asset value during the period. Despite these adjustments, the trust highlighted that approximately 86% of expected revenue through June 2028 has already been fixed, supporting its commitment to a progressive dividend policy that remains fully covered.

            Dividend Support Offsets Recent Financial Weakness

            Octopus Renewables Infrastructure Trust continues to benefit from a strong balance sheet, although recent financial performance has been affected by losses, lower shareholder equity and weaker free cash flow. These factors continue to weigh on the trust’s overall outlook despite its solid solvency position.

            Technical indicators remain moderately constructive in the near term, while the trust’s high dividend yield continues to underpin valuation. However, the negative price-to-earnings ratio reflects the impact of recent losses.

            About Octopus Renewables Infrastructure Trust plc

            Octopus Renewables Infrastructure Trust plc is an investment company focused on renewable energy infrastructure across the UK and Europe. Its portfolio includes onshore wind, offshore wind and solar assets at both operational and development stages, with the objective of delivering reliable long-term cash generation through disciplined investment management and a progressive dividend strategy.

            This article was written by the editorial team at InvestorsHub/ADVFN and is provided for informational purposes only.

            2 Great Canadian Stocks That Just Raised Their Payouts Again

            These two Canadian stocks are paying higher dividends with growing earnings and long-term expansion plans.

            Posted by Jitendra Parashar

            Published August 2

            NA TRI Key Points

            • Dividend increases could offer useful clues about a company’s financial confidence.
            • National Bank of Canada (TSX:NA) raised its payout after reporting strong second-quarter growth.
            • Thomson Reuters (TSX:TRI) extended its dividend-growth streak to 33 consecutive years.

            Foolish investors always love to hear dividend hike news from stocks they already own. Usually, increasing dividends also shows that management feels good about the company’s earnings, cash flow, and ability to keep growing. Of course, no dividend is guaranteed, but businesses that raise their payouts year after year tend to have a solid financial base and strong fundamentals behind them.

            Two well-known Canadian companies recently gave investors another reason to pay attention. National Bank of Canada (TSX:NA) followed strong banking results with a higher quarterly dividend, while Thomson Reuters (TSX:TRI) extended a dividend-growth streak that now stretches beyond three decades.

            Let’s take a closer look at both stocks, their financials supporting these latest dividend increases, and why each could still appeal to long-term income investors.

            dividend stocks bring in passive income so investors can sit back and relax
            Source: Getty Images

            National Bank stock

            National Bank of Canada offers investors a great mix of rising income, strong earnings growth, and expanding operations. The bank mainly provides personal and commercial banking, wealth management, capital markets, and international financial services.

            Its shares have gained 60% over the last year and 34% year to date to currently trade at $230.99 apiece, giving the bank a market capitalization of about $88.7 billion. At this market price, it has a 2.3% annualized dividend yield.

            That strong share-price performance has been backed by National Bank’s improving results. In the second quarter of its fiscal 2026 (ended in April), the bank’s net income rose 38% year-over-year (YoY) to about $1.2 billion, while its adjusted earnings advanced 13% to $3.23 per share. Growth across its business segments helped drive those gains. Lower provisions for credit losses also played a major role, since its quarterly results a year ago included initial provisions tied to acquired Canadian Western Bank loans.

            Similarly, National Bank’s wealth management net income climbed 18% YoY to $274 million, while U.S. specialty finance and international net income rose 10% to $186 million.

            Following those strong results, National Bank raised its quarterly dividend by 6% to $1.32 per share. Meanwhile, the bank continues to pursue synergies from its Canadian Western Bank acquisition and plans to expand further through transactions involving selected Laurentian Bank portfolios.

            With solid capital levels, growing earnings, and another payout increase, National Bank remains an attractive choice for investors seeking dependable dividend growth.

            Thomson Reuters stock

            For investors looking beyond the banking sector, Thomson Reuters also offers a healthy combination of recurring revenue, artificial intelligence (AI)-linked growth, and rising dividends.

            In short, Thomson Reuters provides software, information, and technology to legal, accounting, compliance, and media professionals. Its shares currently trade at $145.55 per share with a market cap of $63.5 billion. The stock has fallen 20% year to date, while its annualized dividend yield stands at 2.6%.

            This weakness in TRI stock contrasts with the underlying strength in the company’s operating results. Its first-quarter revenue rose 10% YoY to US$2.1 billion, helped by a 10% rise in recurring revenue and 15% growth in transaction revenue. Meanwhile, its organic revenue grew 8%, while the legal professionals, corporates, and tax, audit, and accounting professionals segments delivered combined organic growth of 9%.

            The company’s adjusted earnings also climbed 10% YoY in the latest quarter to US$1.23, and free cash flow jumped 19% to US$332 million. Demand for many of its products, such as Westlaw, CoCounsel, Practical Law, Pagero, and Confirmation, supported growth across its core businesses.

            Encouraged by these results, Thomson Reuters raised its annualized dividend by 10% to US$2.62. That marked its 33rd consecutive year of dividend increases and its fifth straight 10% hike. Moreover, the company is continuing to invest in AI, including its acquisition of Noetica.

            Its long dividend-growth record, healthy recurring revenue, and continued investment in AI-powered professional tools make Thomson Reuters an appealing stock for long-term investors.

            Contrarian Investor

            This 15.3% Dividend Is a “Trapdoor” We Must Avoid

            Michael Foster, Investment Strategist
            Updated: July 27, 2026

            Imagine a credit fund that yields 15.3% and is built to deliver strong returns in all rate environments. That’s the promise of a closed-end fund (CEF) called the XAI Floating Rate & Alternative Income Trust (XFLT).

            But the fund has, unfortunately, not backed that up with strong performance. As we can see in orange below, XFLT has badly lagged the popular S&P 500 index fund (in purple) since its launch in 2017.

            A Laggard, Even With a 15.3% Yield

            That performance amounts to just a 0.57% annualized total return! That’s less than many of the high-yield savings accounts offered by regional and national banks.

            To make matters worse, XFLT comes with high fees, with a 7.56% total expense ratio, including leverage costs and 2.74% just for management. This is unsurprising given that the fund holds collateralized loan obligations (CLOs), which bundle floating-rate business loans and slice them into tranches by risk. The result is an asset that gives investors a piece of many different loans. These are most often used by large financial firms to diversify and to get exposure to different kinds of assets that each respond differently to interest-rate changes.

            So what’s the appeal of this fund to everyday investors? Simple: the dividend yield.

            If you look up XFLT on Google or Yahoo Finance, you’ll see an eye-popping number here: 15.3% as of this writing. That means that every $100,000 invested in XFLT would return around $1,275 in monthly income.

            So the appeal is clear: a very large income stream—more than 15% of your investment back as dividends every year. Trouble is, XFLT’s income stream is far from reliable.


            Source: Income Calendar

            As you can see above, XFLT’s dividend has fallen over time, though most of that drop has been recent, so it’s possible to imagine an investor avoiding the payout cuts (or at least most of them) by selling within the last couple of years.

            Unfortunately, making such a move would not have averted our second problem with XFLT: the crash in the fund’s share price.

            XFLT’s Price Is a “Trapdoor” Under Its Dividend

            An investor who sold XFLT any time after the IPO would have done so at a loss, and that loss has kept growing. To wit, an investor who was in at the start would be down $65,530 on a price basis on a $100,000 investment, as of this writing, from the IPO date, but would have collected about $75,000 from dividends, just barely outrunning the loss on price. This is hardly a winning investment.

            Which brings us to another change happening with the fund.

            Management Shakeup Adds Uncertainty

            The firm that advises XFLT and ultimately decides what it will invest in is called Octagon Credit Investors. XFLT’s overall management firm, XA Investments, is seeking to replace Octagon with a subsidiary of King Street Capital Management in a shareholder vote ahead of a July 30 special meeting of shareholders. (King Street has has $30 billion in assets under management and $12 billion in CLOs.)

            There’s just one problem: King Street doesn’t have much in the way of publicly available information about the performance of its CLOs, so there remains a lot of risk here, no matter how the vote goes.

            As a result, it’s a good idea to sit back and see what happens with XFLT. While its 22% discount to net asset value (NAV, or the value of its underlying portfolio) makes it look like a potential rebound candidate, the risk that a new manager isn’t any cheaper or better at managing the fund means it’s better to look elsewhere.

            And there are better places to look.

            MCI: Smaller Dividend, (Much) Bigger Returns

            Instead of XFLT, I’d consider picking up shares in another CEF called Barings Corporate Investors (MCI), whose total return since XFLT’s IPO (shown in orange above) has been literally 10 times better. It also boasts a stronger record on the payout front:


            Source: Income Calendar

            With a long history of payout hikes (going back to the 1990s), MCI has proven itself as an income generator over many different kinds of markets. Moreover, its 10% annualized total return over the last five years is impressive, and one more reason why this fund is worth considering.

            To be sure, MCI’s yield is smaller than that of XFLT, but it’s not small by any means. At 9.5%, it’s still above the roughly 8% CEF average. Plus you’re getting that high income stream without sacrificing capital gains here.

            MCI’s Sturdy Share Price Supports Its Payout

            Above you can see that, purely on a price basis (or without reinvested dividends), MCI (in orange above) has vastly outperformed XFLT (in purple) over the last decade, putting it ahead of that fund on just about every count.

            Finally, MCI is also a collection of business loans (in MCI’s case, mostly bank loans with some straight loans to corporations on the side), so we’re still getting cash flow from lending to firms, just with more sustainability and a stronger track record.

            Across the pond

            2 “Lonely and Uncomfortable” Dividends up to 12.3% We Love (One More Than the Other)

            Brett Owens, Chief Investment Strategist
            Updated: July 28, 2026

            When the world is burning—as it feels like it is now—it pays to remember the words of Howard Marks, the smartest money manager most people have never heard of.

            The essence of Marks’s approach is contrarian thinking. In Chapter 11 of his excellent book, The Most Important Thing: Uncommon Sense for the Thoughtful Investor, he writes:

            The ultimately most profitable investment actions are by definition contrarian: You’re buying when everyone else is selling (and the price is thus low), or you’re selling when everyone else is buying (and the price is high).

            But he admits this isn’t easy: “These actions are lonely and uncomfortable.”

            Lonely? Uncomfortable? That’s exactly how corporate-bond buyers feel these days!

            We’re not just tipping our hats to these brave “loners.” We’re joining them with two “tossed-in-the-bin” bond closed-end funds (CEFs) paying up to 12.3%!

            Rates Up, Bonds Down—But Something’s Got to Give

            If you’ve been investing for income for a while, you likely know the golden rule of Bondland: When rates rise, bond prices fall (and vice versa). It’s simple—too simple, in fact! And it’s precisely why bonds are on the outs now.

            The Iran conflict is flaring. Oil (the engine of inflation) is spiking. And even Fed chair Kevin Warsh—appointed, remember, to cut rates—can’t seem to hold back the tide. Futures markets tell the tale: A year from now, they see two Fed rate hikes in the bag—and potentially more.


            Source: cmegroup.com

            I know. This does not sound like the best bond-buying setup. But here’s the thing: Everybody knows it. The mainstream crowd—folks Marks calls “first-level investors” because they buy and sell on headlines—has already sold.

            That’s fine for us “second-level” thinkers who dig deeper: It means the bad news is priced in. It also means it won’t take much for these funds’ discounts to reverse course and shrink.

            The bottom line? Now is the time to buy.

            To see what I’m getting at, consider the discount on the PIMCO Corporate & Income Opportunity Fund (PTY), one of the biggest corporate-bond CEFs.

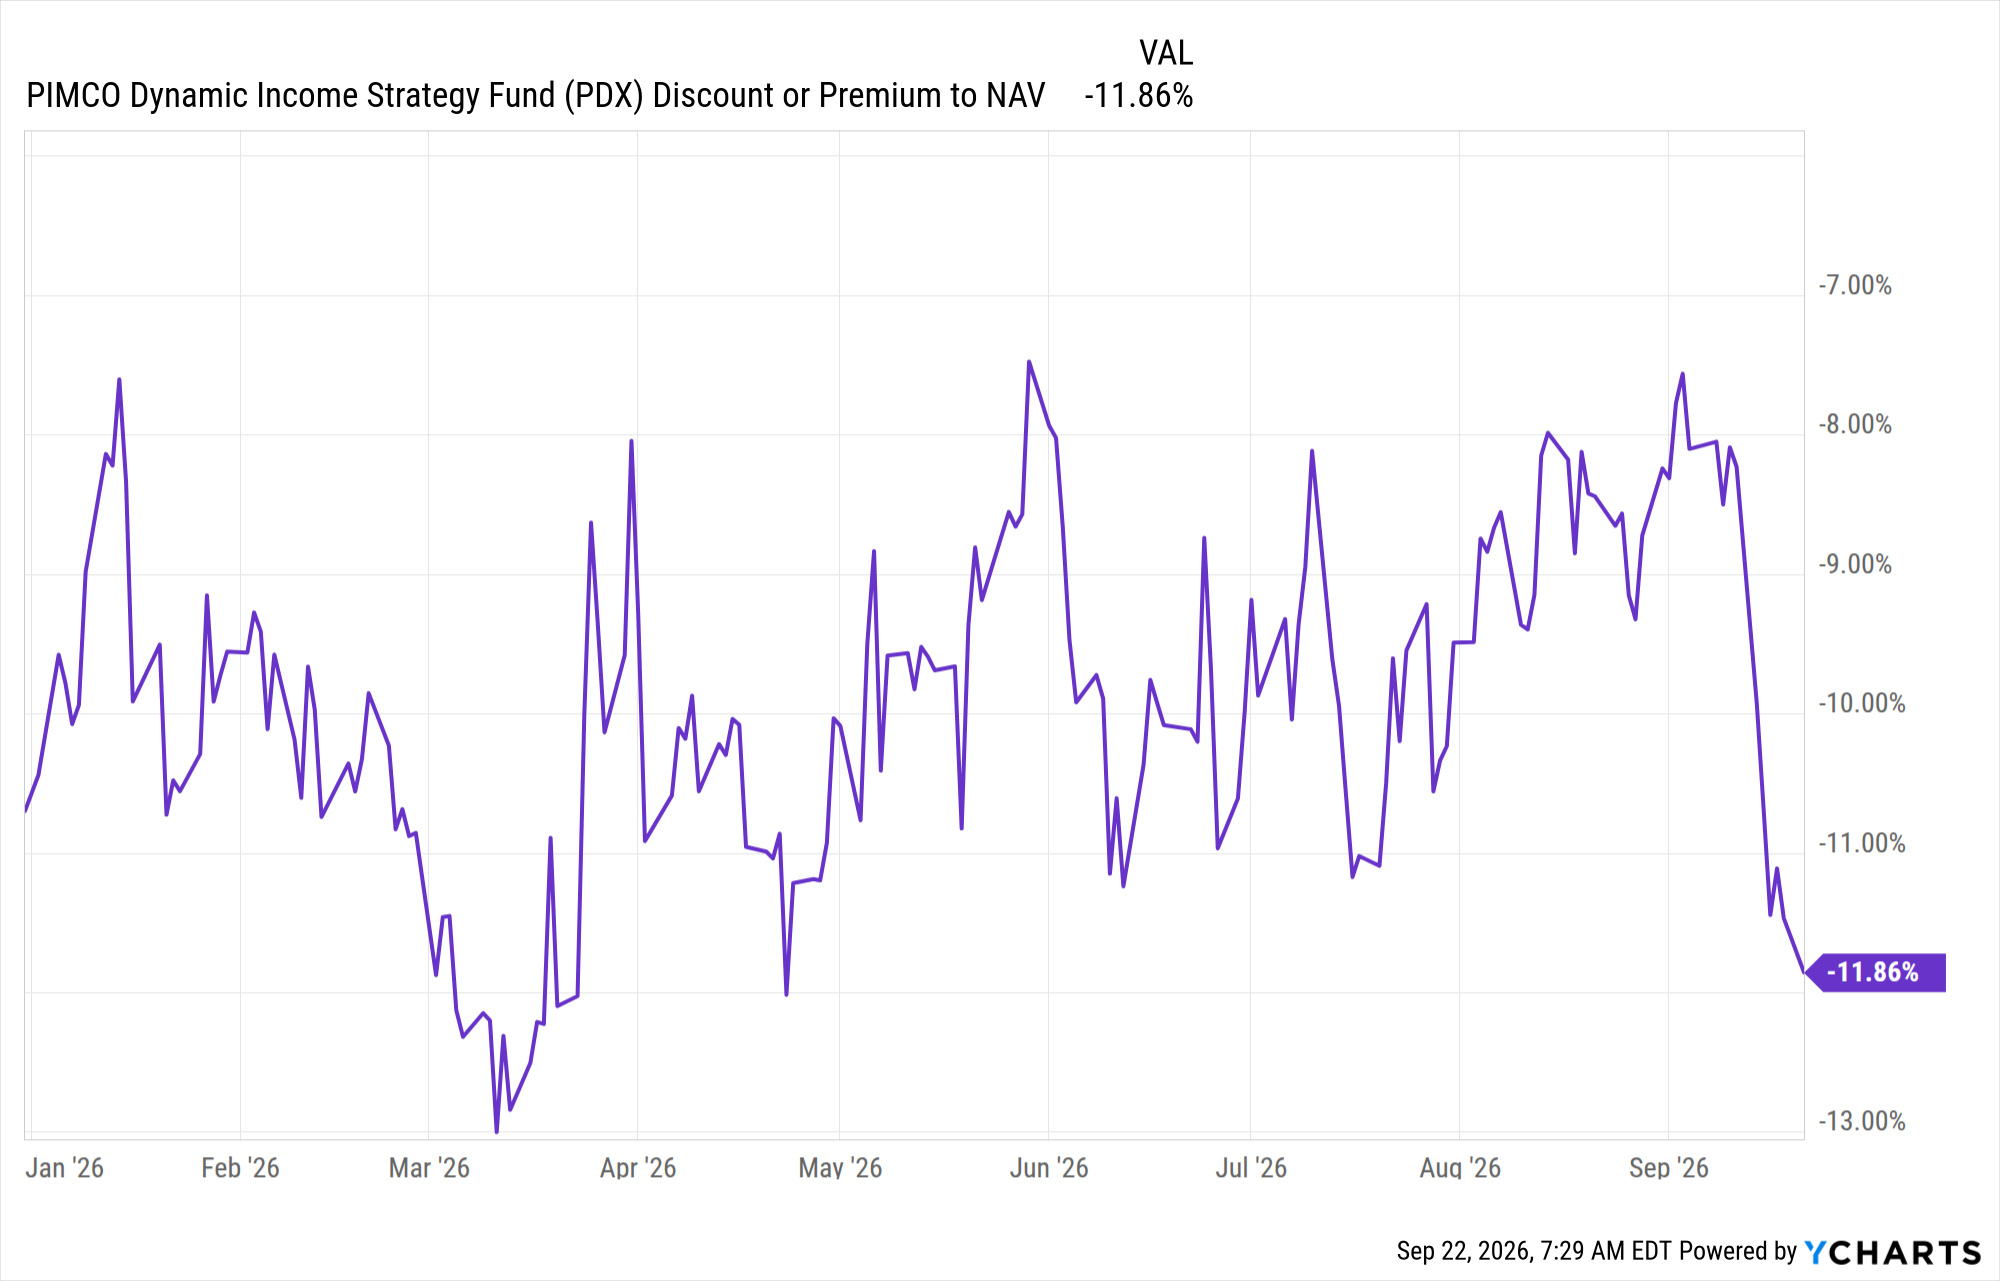
            As I write, PTY trades at a 2.7% premium to net asset value (NAV). That doesn’t sound cheap, but thinking any premium means a fund is pricey is another first-level blunder. With PIMCO funds, premiums—particularly big ones—are normal because of the company’s cachet in the CEF space.

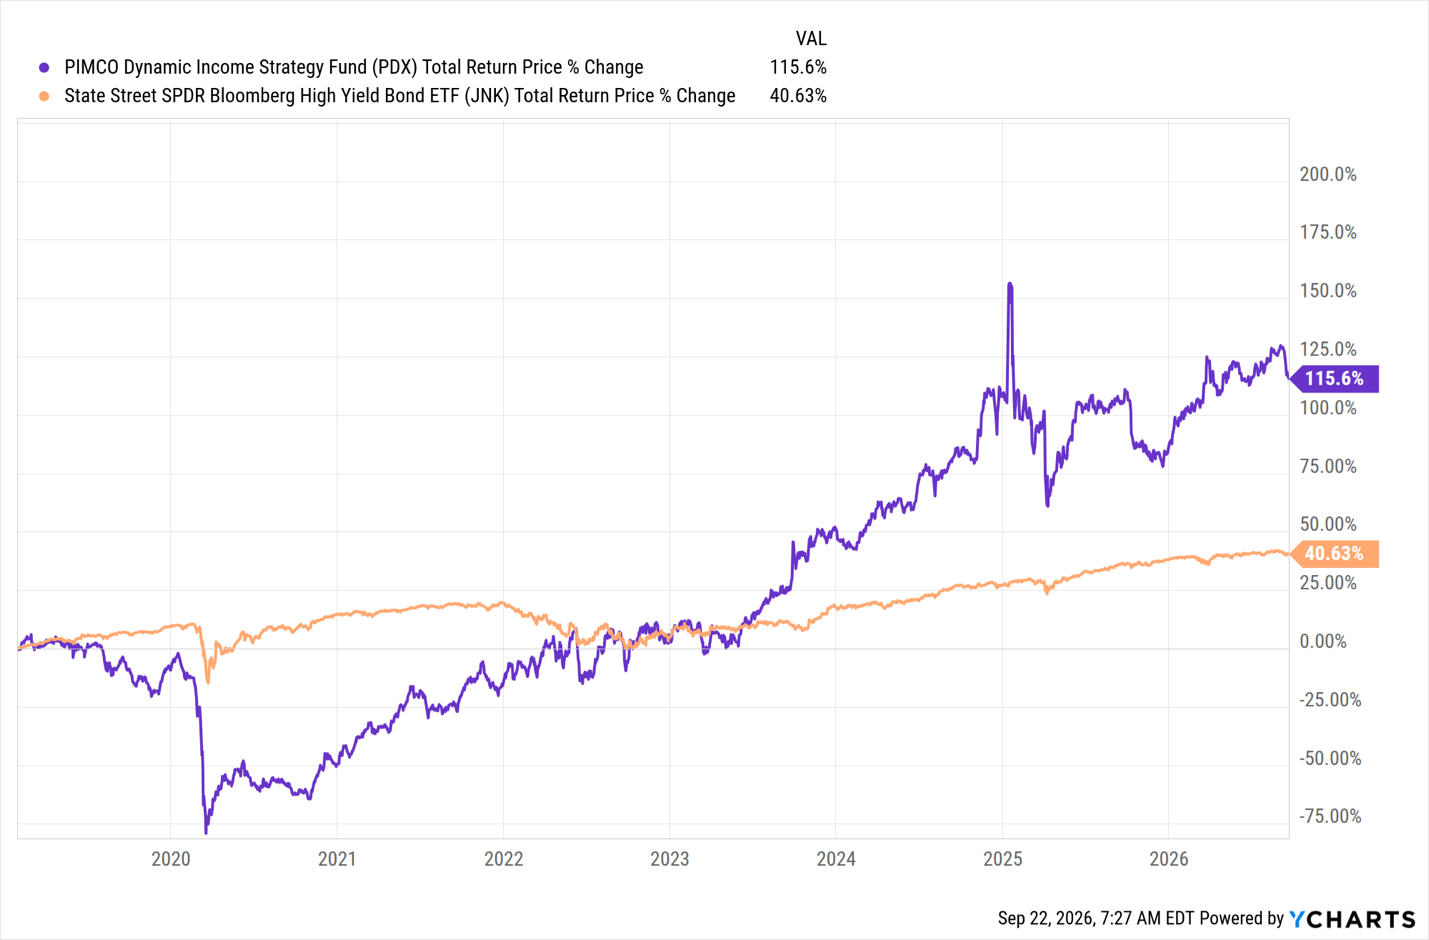
            Over the last five years, PTY has traded at a 20% (!) premium, on average. Take a look at this chart, showing its path to the bottom of the bargain bin:

            PTY Is Cheaper Than It’s Been in 11 Years

            This is a chart of PTY’s premium since its launch in 2002. As you can see, it’s cheaper than it’s been since 2015—and far cheaper than it was in 2022, when rates soared on the heels of an inflation rate that streaked to 9%!

            Even the most extreme forecasts don’t put us near that today. And PTY’s overdone premium-drop, despite that fact, is the first reason why the fund looks attractive now.

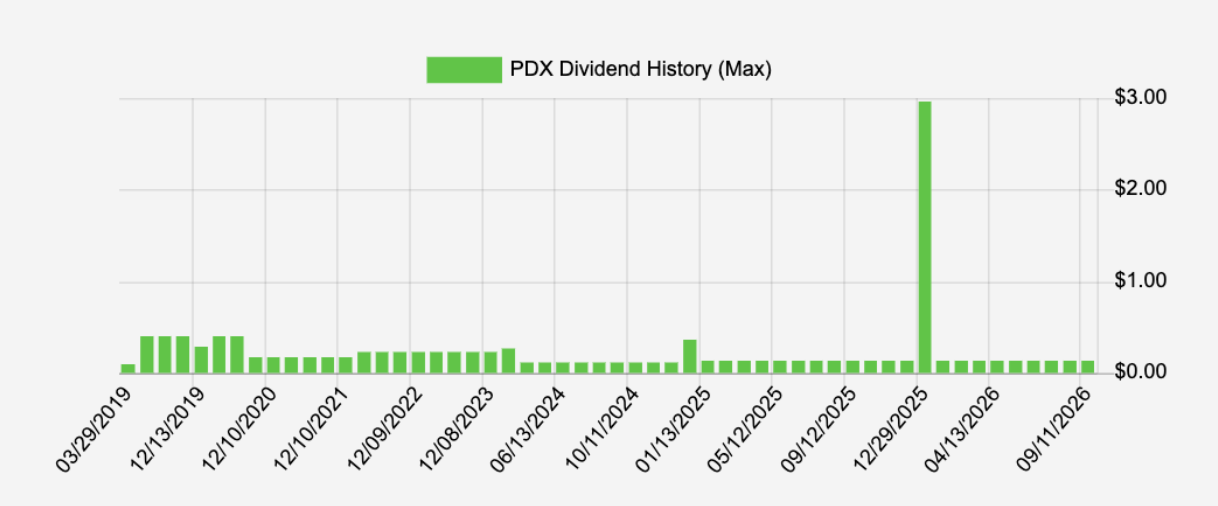
            Then there’s the dividend. As I write this, PTY pays 11.9 cents per share, per month, for a hefty 12.3% yield.

            Other than a slight adjustment, from 13 cents to 11.9 during the pandemic, that payout held steady, with the odd special dividend (the spikes and dips in the chart below), too:


            Source: Income Calendar

            PTY generates that income by handing its managers a wide mandate to scour the credit markets. The result is a portfolio that’s 59% US-based and mostly in high-yield bonds (29% of assets), non-US developed markets (16%) and emerging markets (17%).

            The team at the top has also focused on bonds with a leverage-adjusted duration of 4.2 years. That’s a good place to be—long enough to rise significantly as rates fall, but not so long as to hurt substantially if rates surprisingly head higher than expected.

            As I just hinted at, the fund does juice its returns by borrowing against roughly 29% of its assets. That’s modest and, again, will provide a tailwind as rates fall and PTY’s borrowing costs decline.

            And yes, I do still see lower rates in the longer run. Let’s talk about that more before we move on to another corporate-bond CEF we like even more than PTY.

            On the Interest-Rate Front, AI Beats Iran

            When it comes to rates (or anything in investing), things rarely go in a straight line.

            Despite the recent escalation in Iran, this conflict will eventually draw to a close. None of the participants in the conflict can afford any other outcome. Then there’s Warsh, who, as I mentioned earlier, Trump has charged with cutting rates. You can bet that as soon as the data allows him to justify such a move, he’ll push for it.

            Third (and more important) is AI, which provides a sweeping level of automation to white-collar work that is highly deflationary.

            In the 1990s, the Internet acted as a similar “deflator” on prices. The move from snail mail to email and from fax machines to web browsers made businesses wildly more efficient, which kept a lid on consumer prices—and a floor under bond prices. They rallied throughout the decade.

            If rate cuts happen sooner, great. The discount on a buy made today will snap shut, giving us price gains on top of our double-digit bond-fund payouts. If it takes longer, fine. We’ll collect our divvies in peace (since these funds are already cheap).

            Which brings me to another bond CEF I see as a savvy “second-level” buy today.

            The “Bond God’s” 10.1% Payout

            The 10.1%-paying DoubleLine Yield Opportunities Fund (DLY) is a holding of my Contrarian Income Report service that’s done exactly what we’ve wanted it to since we bought it in October 2021: deliver steady income.

            The fund rolled down the skids at what would seem to be an inopportune time: February 2020, on the eve of the societal dumpster fire that was soon to ensue. But DLY’s manager, Jeffrey Gundlach (a.k.a. the “Bond God”) was the right manager for the time: He used the opportunity to snap up high-yielding bonds at discounts.

            Since then, the fund’s dividend has been the picture of predictability, paying out steadily (and monthly) since launch, with two special dividends, to boot:


            Source: Income Calendar

            Then there’s the discount, which has also gotten cheaper over the last 16 months, dropping from a slight premium to a 7.7% markdown.

            That’s way too cheap for a fund run by Gundlach, who’s got a wide mandate to scour the credit markets. The discount’s widening has also raised the yield to that sweet 10.1%.

            DLY’s Discount Sends Its Dividend Higher

            DLY, like PTY, is a textbook “Marks-style” contrarian play on today’s rate worries. We’re happy to grab this stout fund at a discount, and a historically high 10.1% payout, too.

            This Ridiculously Cheap 12% Payer Is the “Perfect Pairing” for DLY

            Let’s keep the payout party rolling by adding another fund that perfectly complements DLY. This one pays 12%, hands us payouts monthly and is also cheap, thanks to the investor temper tantrum over rates.

            And take a look at this steady divvie:

            Heck, it’s not just steady—it’s growing. So we’re left with a 12% payout that comes our way monthly, has grown, and regularly sends special payouts our way!

            Many investors will tell you that such a thing simply can’t exist. Well, here’s the proof that they’re wrong. And with the world-class management team running this fund, we’ve got reassurance that they know how to weather any rate storm.

            Since this one pays monthly, getting in now means our next payment is only a few short weeks (not months!) away.

            « Older posts Newer posts »

            © 2026 Passive Income Live

            Theme by Anders NorenUp ↑